Smoothing Candles Pro


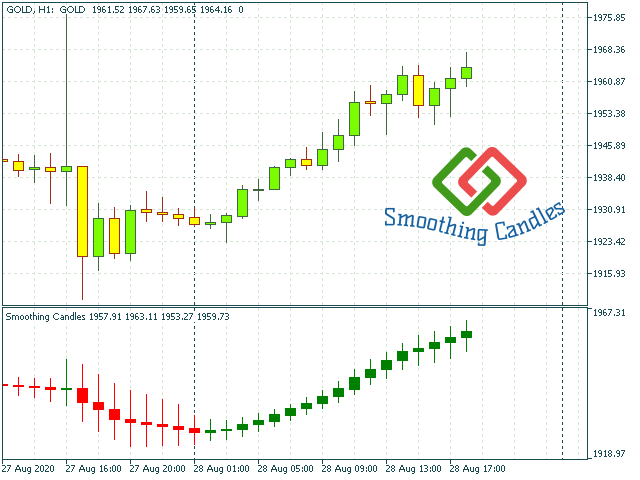
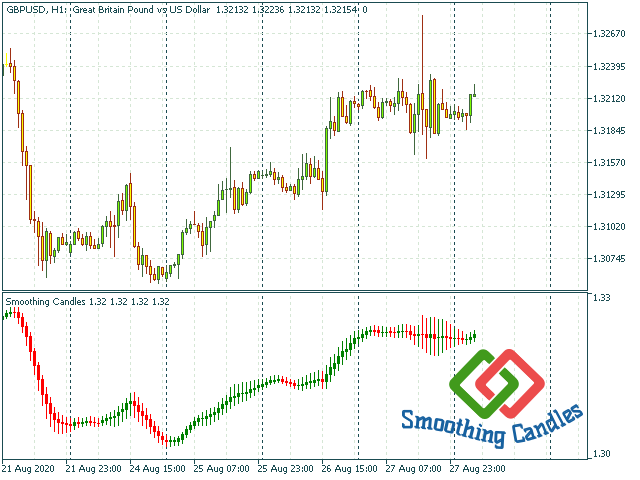
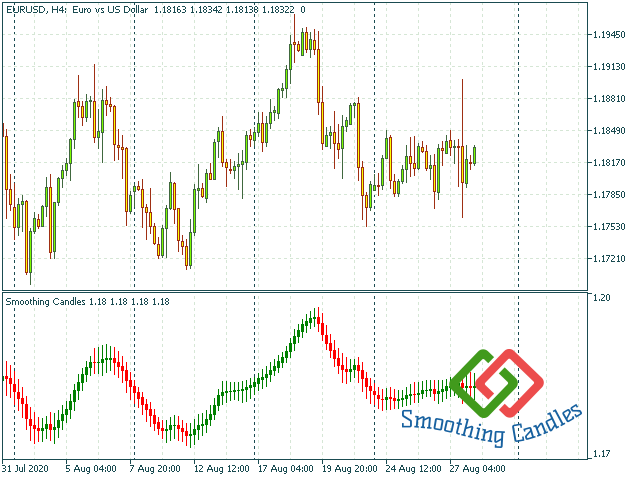
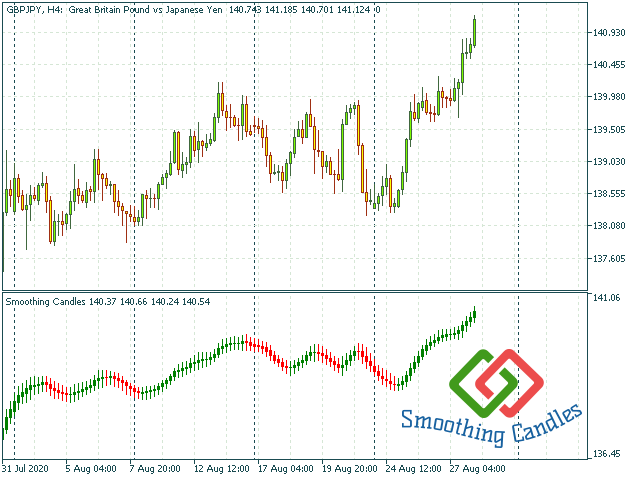
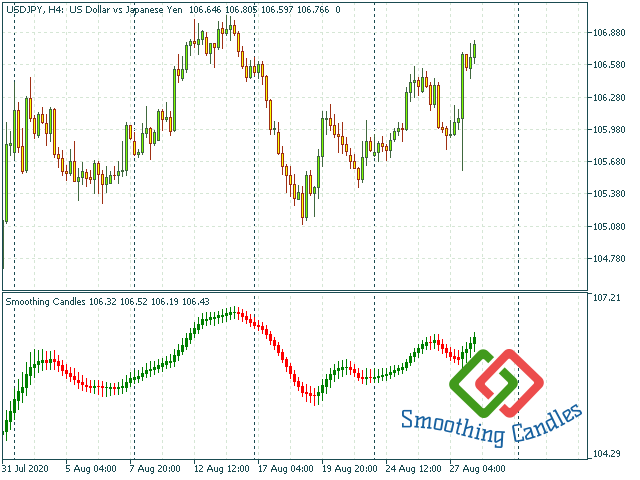
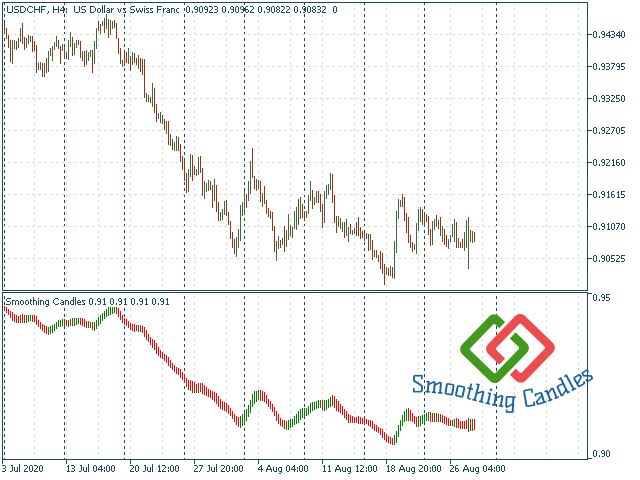
It is a Graphical and Trend indicator that brings several advantages.⭐ ⭐ ⭐ ⭐ ⭐ 

  • Eliminates noise.
  • Facilitates the identification of the trends.
  • Can be used as directional force indicator.
  • Identify lateralization: candles with close and open price closer.
  • Identifies high volatility: candles with shadows larger than the body.

Attention!!! Works on any asset and any time frame. 

Easy setup
  • Symbol: anyone ✅
  • Time frame: anyone 
  • Parameters: Indicator Period 
  • Recommended Period: between 4 and 12 

Help

If you have any questions, access our telegram group:
 Telegram group

Good Luck!


おすすめのプロダクト
This indicator uses a different approach from the previous version to get it's trendlines. This method is derived from Orchard Forex, and the process of making the indicator is demonstrated in there video   https://www.youtube.com/watch?v=mEaiurw56wY&t=1425s . The basic idea behind this indicator is it draws a   tangent line   on the highest levels and lowest levels of the bars used for calculation, while ensuring that the lines don't intersect with the bars in review (alittle confusing? I know
FREE
SMC Structure Markup
Seyed Mohammad Hosseini Hejazi
4.67 (15)
Overview The Smart Money Structure Markup Indicator for MetaTrader 5 is a powerful tool designed to help traders identify key market structures based on popular Smart Money Concepts (SMC) strategies. This indicator detects micro-market structures, providing insights into price movements and potential trend changes. It highlights important elements such as valid Break of Structure (BOS), Change of Character (CHoCH), and Inducement (IDM), helping traders to make informed decisions. Key Features Ma
FREE
The Better Volume indictator improves the comprehension on volume by coloring the classical histogram bars . The colors point out differents nature of volume . The Better Volume OnOff   allows to  open/close the subwindow   through  a botton   or using the keyboard   only.  There is the possibility to customize 3 symbols  and assign them  different parameters   for each time frame . The indicator   improves the comprehension   on volume by coloring the classical histogram bars : CLIMAX UP - 
Daily VWAP Indicator (Volume Weighted Average Price) Special Deal! Leave a review and get the indicator  Long & Short Cointegration Analyzer for free — just send me a message! Description The Daily VWAP (Volume Weighted Average Price) indicator is an essential tool for traders seeking to identify the true average price of an asset throughout the day, adjusted by traded volume. Primarily used by institutional and professional traders, the daily VWAP serves as a reference point to identify the av
FREE
Echelon EA – Chart Your Unique Trading Constellation Like the celestial guides that lead explorers through the vast universe, Echelon EA empowers you to create and optimize your very own trading strategies. This versatile system combines advanced grid and martingale techniques with cutting‐edge indicators, offering you an endless palette for designing a strategy that is truly your own. Craft Your Personal Strategy: Infinite Possibilities – Customize every parameter to build a trading system t
FREE
Quantum Viscosity Indicator
Muhammad Ahmad Abdulaziz Al-jamal
QVET Pro – Quantum Viscosity & Elasticity Tracker QVET Pro is a professional MetaTrader 5 indicator designed to analyze market behavior using volume, volatility, and statistical normalization. Instead of following traditional lagging indicators, QVET focuses on how price reacts to volume by measuring market viscosity and price elasticity . This helps traders understand when the market is consolidating, stretching, or preparing for a potential move. The indicator uses Z-score normalization to red
Volatility Regime ZScore Indicator Volatility Regime ZScore is a professional volatility–regime indicator designed to  classify the market into volatility regimes : low risk (calm market), normal conditions, high risk (unstable / news / breakout environments). This indicator answers a very specific question: “Is the market currently calm, normal, or unusually risky?” It does NOT predict price direction, trends, or entry points by itself. Instead, it acts as a risk and regime filter , not signa
VWAP indicator for MT5
Renaud Herve Francois Candel
Moving VWAP Indicator Moving VWAP is an important indicator drawing the Volume-Weighted Average Price (VWAP). The VWAP is a reference used by institutional traders and acts as a level of support / resistance. If price is above VWAP then means market is bullish. If price is below VWAP then means market is bearish. It can be used to enter in the market with low risk (near VWAP) and also identify the correct direction of the market. The Moving VWAP is as simple as a Simple Moving Average. The m
Simple Weis Wave
Jean Jacques Huve Ribeiro
3.67 (3)
One of the best tools for analyzing volume, Weis Wave was idelized by David Weis, to facilitate the reading of directional flow. For the VSA method disciples it is an evolution of the practices created by Richard Wycoff, facilitating a predictive reading of the market, always seeking an accumulation and distribution of the negotiated contracts. Cumulative wave volume  Range of wave ( removed) Average Wave volume Ref "Tim Ord lectures" ( removed)
FREE
Blahtech Moving Average indicator is a multitimeframe version of the standard Moving Average indicator. It is also enhanced with customisable alerts, period breaks and other configuration options. The 50 day and 200 day moving averages are widely followed by investors and traders, with breaks above and below the MA lines considered to be signals of interest. Links [  Install  |  Update  |   Training   |   All Products  ] Feature Highlights Up to three timeframes Configurable calculation variabl
FREE
The Mono Waves indicator is designed to display the wave behavior of the market on a chart. Its appearance is presented on slide 1.   This indicator uses the PPPC (Point-Percent Price Channel) indicator, which can be downloaded for free from the  Market .              When the market moves up, the upper border of the price channel is built on High candlestick prices (for more details, see the description of the PPPC indicator at the link given above). The higher the High prices rise
FREE
NakaTrend
Ricardo De Andrade Nakano
2 (1)
「NakaTrend」をご紹介します:MetaTrader 5向けの究極のトレンド検出器! 取引体験を革命化する準備はできていますか?NakaTrendは、トレンドの変化を精密かつ簡単に特定するための頼りになるインジケーターです。 NakaTrendを使用すると、市場の変化を見逃すことはありません。上昇トレンドが発生すると、NakaTrendは緑のドル記号でそれを示し、買い注文を入れるタイミングを示します。そして、トレンドが下降に転じると、赤いドル記号が現れ、売り注文を入れる絶好のタイミングを示します。 しかし、それだけではありません:NakaTrendは、手動で注文を入力できるようにすることで、取引をコントロールする力を与えます。あなたの直感とNakaTrendの洞察力が、利益をもたらす結果に導くでしょう。 推測や時代遅れの指標に依存する日々は過ぎ去りました。NakaTrendは、信頼できる明確で実行可能なシグナルを提供するために高度なアルゴリズムを活用しています。 そして、NakaTrendはMetaTrader 5内で直接動作するため、取引ルーティンに統合することは簡
FREE
NEXA Breakout Velocity NEXA Breakout Velocity は、チャネルブレイクアウト、価格変化率(ROC)、出来高フィルター、および ATR ベースのリスク管理を組み合わせた自動売買システムです。 本システムは、価格が一定のレンジを突破し、同時にモメンタムと出来高が増加する「ボラティリティ拡大局面」を検出することを目的としています。 すべてのシグナルは確定足のみで計算されます。 同一シンボルでは常に1ポジションのみ保有します。 戦略概要 本システムは以下の要素を組み合わせています。 チャネルブレイクアウトの検出 ROC によるモメンタムフィルター 出来高増加フィルター 下位時間足による確認(任意) ATR に基づくストップロス計算 リスクリワード比による目標設定 口座リスク率に基づくロット自動計算 動的リスク管理機能 単純なブレイクアウトではなく、モメンタムと出来高の条件を同時に満たす場合にエントリーします。 動作原理 直近の高値・安値から価格チャネルを計算します。 直前の確定足がチャネルを突破しているか確認します。 ROC 値を過去平均と比較します。
FREE
RSI Chart Levels
Nikolay Mitrofanov
4.83 (6)
The indicator draws levels based on the overbought and oversold values ​​of the RSI indicator. The maximum values ​​are taken into account, which are equal to or exceeded certain limits. That is, for example, when the price has gone into the overbought zone, the highest price is selected from all prices in this zone for this period of time, and as soon as the indicator value returns to a value below the overbought value, the level is fixed and the calculation of new values ​​begins. The same
FREE
The Volume Weighted ATR indicator is a helpful tool for measuring market activity. It is based on the idea of the Volume-Weighted ATR. Combining these two elements helps identify potential turning points or breakout opportunities. The indicator for the classification of the activity of the market uses the moving average and its multiples. Accordingly, where the VWATR bar is located (relative to the moving average), it is labelled as ultra-low, low, average, high, very high or ultra high. The Vo
FREE
The indicator highlights the points that a professional trader sees in ordinary indicators. VisualVol visually displays different volatility indicators on a single scale and a common align. Highlights the excess of volume indicators in color. At the same time, Tick and Real Volume, Actual range, ATR, candle size and return (open-close difference) can be displayed. Thanks to VisualVol, you will see the market periods and the right time for different trading operations. This version is intended f
FREE
Flash counter
Renato Aparecido Braguini
Contador de tempo que iniciará outro candle. Este indicador conta o tempo que falta para terminal um candle e iniciar outro, funciona em qualquer tempo gráfico. Em seus parametros de configurações permite alterar o tamanho e a cor da fonte da letra. Gratis para teste por 15 dias. Contador de tempo do candle. Permite alterar o tamanho e a cor da letra. Após baixar o contador de tempo de candle Flash arraste para o gráfico, configure o tamanho da fonte desejado e as cores preferidas.
FREE
BoomAndCrashEA
BILLY ARANDUQUE ABCEDE
The BoomAndCrashEA , based on vector machine learning, is an advanced trading tool that uses the latest advances in computing technology to analyze the forex market and predict future price movements. The Expert Advisor will use vector machine learning to learn huge amounts of historical data and quickly and efficiently detect patterns in the market. It will use a sophisticated and complex proprietary algorithm which uses advanced mathematical calculations to solve complex problems and optimize
This EA has been backtested with real ticks since January 2012 untill March 2025, with no delay in execution, and then with a delay of 1000ms, the backtest showed a drawdown of 30% with a 10k USD backtest account. The EA default parameters are optimised to work best on EURUSD pair, but can work on other currencies and metals like XAUUSD. Before using this EA and in order to not lose all your money make sure you have at least 5000USD in your account. Do not use another EA with this one on the sam
MiEasyOrderMT5
Carlos Miguel Iriondo
5 (1)
Mi Easy Order MT5 es un programa diseñado para facilitar y optimizar la ejecución de operaciones de compra y venta en los mercados financieros, proporcionando al trader una herramienta práctica, precisa y confiable para la gestión del riesgo. Su objetivo principal es simplificar el proceso de entrada al mercado, eliminando cálculos manuales y reduciendo errores comunes que suelen producirse al momento de definir el tamaño de la posición. El sistema permite al usuario ingresar como parámetro el n
FREE
Trading setup could be a simple thing. Triple Moving Average is a popular trading strategy to analyze market trends. It provides clear signals for identifying uptrends and downtrends based on the relative positioning and crossovers of short-term, medium-term, and long-term. Comparing Triple MA of two different time frame, provide a comprehensive look of price movement.
FREE
KVO Indicator
Saullo De Oliveira Pacheco
Klinger Volume Oscillator (KVO) - A Powerful Trend & Momentum Indicator This is an enhanced version of the Klinger Volume Oscillator (KVO) , a widely used indicator designed to help traders identify momentum shifts, trend direction, and overbought/oversold conditions in the market. How the KVO Indicator Works: Volume-Based Trend Identification – Unlike traditional oscillators that rely solely on price movements, the KVO uses both price and volume to detect market trends and momentum shifts .
FREE
(Special New Year promotion - free price!) The indicator displays the actual 'Scale in points per bar' (identical to the manual setting in the Terminal, see screenshot) in the upper right corner of the chart. The displayed value changes INSTANTLY whenever the chart scale is changed! (This is very convenient when planning screenshots). In Settings: Change language (Russian/English), font size of the displayed text, text label offset coefficient from the graph corner, equally in X and Y directi
FREE
CYCLE WAVE OSCILLATOR indicator is an indicator based on cyclical price fluctuations. This indicator can help you determine overbought and oversold levels, and help you predict price trends within the cycle. MT4 Version here! You can combine it with our indicators below to make your trading decisions more accurate: Supply Demand Ribbon MT5 Basic Feature: - Three Trend Types: + Zero + Basic + Advanced
FREE
マルチタイムフレーム対応、カスタマイズ可能なビジュアルシグナル、設定可能なアラートシステムを備えたAverage Directional Movement Index(ADX)インジケーター。 フリーランスプログラミングサービス、アップデート、その他のTrueTL製品は私の MQL5プロフィール からご利用いただけます。 フィードバックとレビューを大歓迎します! ADXとは? Average Directional Movement Index(ADX)は、J. Welles Wilderが開発した技術的指標で、方向性に関係なくトレンドの強さを測定するために使用されます。ADXはポジティブ方向指標(+DI)とネガティブ方向指標(-DI)から導出されますが、トレンドの方向ではなく強さのみを示します。 ADX値は0から100の範囲です。一般的に、20〜25未満の値は弱いまたは存在しないトレンド(レンジ相場)を示し、25を超える値は強いトレンドを示します。50を超える値は非常に強いトレンドを示します。ADXは市場がトレンド中かレンジ中かを識別するのに特に役立ち、トレーダーがトレンドフォ
FREE
The "Volume Range Profile with Fair Value" (VRPFV) indicator is a powerful volume analysis tool designed to help traders better understand market structure and identify key price areas where significant institutional activity occurs. Instead of just looking at volume on individual candlesticks, VRPFV analyzes the distribution of volume by price level within a specific time range, providing deep insights into the "footprint" of smart money. VRPFV consists of the following core components: Upper &
FREE
Build your own model to predict averages of turning points of the Triple Moving Average Oscillator. It is simple.  Rate me with stars. Just load the indicator Triple Moving Average Oscillator in you platform and choose the period.  Scroll through to observe the averages of the highs and lows over a period of time. Add the levels for a buy and a sell on the Triple Machine and this will show the average of highs and lows to look for buys and sell. You can load multiple copies with multiple levels.
Color Trend
Bruno Goncalves Mascarenhas
Combining the best of Price Action , Directional Movement , and Divergence / Convergence analysis, the Candle Color Trend is the easy and reliable way to identify the direction of the trend. The indicator automatically paints the candles according to the premise that the upward trend is defined by prices that form a series of ascending tops and bottoms. On the other hand, the downward trend is defined by prices that form a series of descending tops and bottoms. Color Trend is certainly one of
FREE
HTF Candle Plus Timer Upgrade your trading experience with HTF Candle Plus Timer, a smart indicator that displays higher timeframe candles directly on your current chart. It allows you to stay aligned with the bigger market picture while focusing on your preferred trading timeframe. Key Features: Higher Timeframe Candles Plot custom higher timeframe (HTF) candles such as H1, H4, D1, W1, or MN directly on lower timeframe charts for a clearer market overview. Current Candle Timer A live countdown
このプロダクトを購入した人は以下も購入しています
ARICoin is a powerful trading companion designed to generate high-probability entry signals with dynamic TP/SL/DP levels based on volatility. Built-in performance tracking shows win/loss stats, PP1/PP2 hits, and success rates all updated live. Key Features: Buy/Sell signals with adaptive volatility bands Real-time TP/SL/DP levels based on ATR Built-in MA Filter with optional ATR/StdDev volatility Performance stats panel (Success, Profit/Loss, PP1/PP2) Alerts via popup, sound, push, or email Cust
SuperScalp Pro — 高度なマルチフィルター対応スキャルピングインジケーターシステム SuperScalp Pro は、クラシックな Supertrend と複数のインテリジェントな確認フィルターを組み合わせた高度なスキャルピング用インジケーターシステムです。M1〜H4 のすべての時間足で効率的に機能し、特に XAUUSD、BTCUSD、および主要なFX通貨ペアに適しています。単体のシステムとして、また既存の取引戦略へ柔軟に統合して使用できます。 本インジケーターは 11 以上のフィルターを統合しており、短期・長期の EMA、トレンド判定に用いる 3 本の EMA、EMA スロープ(EMA slope)、RSI、ADX、出来高、VWAP、ボリンジャーバンドのブレイクアウト、MACD ダイバージェンスフィルターなどを含みます。スマートキャンドルフィルターはローソク足の終値を確認して弱いシグナルを排除し、3 本の EMA と MACD ダイバージェンスを組み合わせたトレンド認識メカニズムにより勝率の高いシグナルの選別を支援します。 SuperScalp Pro は ATR に基
AriX
Temirlan Kdyrkhan
1 (4)
AriX Indicator for MT5 A powerful trend-following and signal-evaluation tool AriX is a custom MT5 indicator that combines Moving Averages and ATR-based risk/reward logic to generate clear buy/sell signals. It visualizes dynamic SL/TP levels, evaluates past trade outcomes, and displays win/loss statistics in a clean on-chart panel. Key features include: Buy/Sell signals based on MA crossovers ATR-based SL/TP1/TP2/TP3 levels with visual lines and labels Signal outcome tracking with real-time stat
このインジケーターを購入すると、プロ仕様のトレードマネージャーを無料で差し上げます。 まず第一に、このトレーディングシステムがノンリペイント、ノンリドロー、ノンラグのインジケーターであることを強調する価値がある。これにより、手動取引とロボット取引の両方に理想的なものになっています。 オンラインコース、マニュアル、プリセットのダウンロード。 「スマートトレンドトレーディングシステム MT5」は、新規および経験豊富なトレーダー向けにカスタマイズされた包括的なトレーディングソリューションです。10以上のプレミアムインジケーターを組み合わせ、7つ以上の堅実なトレーディング戦略を備えており、多様な市場状況に対応する多目的な選択肢となっています。 トレンドフォロー戦略:トレンドを効果的に乗り越えるための正確なエントリーとストップロス管理を提供します。 リバーサル戦略:潜在的なトレンドの反転を特定し、トレーダーがレンジ相場を活用できるようにします。 スキャルピング戦略:高速で正確なデイトレードおよび短期取引のために設計されています。 安定性:すべてのインジケーターはノンリペイント、ノンリドロー、ノ
FX Trend NG:次世代マルチマーケット・トレンドインテリジェンス 概要 FX Trend NG は、複数の時間足に対応したプロフェッショナル向けトレンド分析およびマーケット監視ツールです。 市場全体の構造を数秒で把握することができます。 複数のチャートを切り替える必要はありません。どの銘柄がトレンド中なのか、どこでモメンタムが弱まっているのか、そしてどの時間足で強い整合性があるのかを瞬時に確認できます。 ローンチ特別オファー – FX Trend NG を $30(6ヶ月) または $80 永久ライセンス でご利用いただけます。 すでに Stein Investments のユーザーですか? -> メッセージを送信 して、プライベートグループへアクセスしてください。 セットアップや詳細情報が必要ですか? -> Stein Investments 公式ページ をご覧ください。 1. FX Trend NG が他と異なる理由 3ステート・トレンドロジック ― Buy と Sell だけではない • 多くのインジケーターは Buy または Sell の2状態のみを表示します。
このインジケーターを購入された方には、以下の特典を 無料 で提供しています: 各トレードを自動で管理し、ストップロスとテイクプロフィットを設定し、戦略ルールに基づいてポジションを決済する補助ツール 「Bomber Utility」 様々な銘柄に合わせたインジケーターの設定ファイル(セットファイル) 「最小リスク」、「バランスリスク」、「待機戦略」 の3つのモードで使用できる Bomber Utility 用の設定ファイル このトレーディング戦略をすぐに導入・設定・開始できる ステップバイステップのビデオマニュアル ご注意: 上記の特典を受け取るには、MQL5のプライベートメッセージシステムを通じて販売者にご連絡ください。 オリジナルのカスタムインジケーター 「Divergence Bomber(ダイバージェンス・ボンバー)」 をご紹介します。これは、MACDのダイバージェンス(乖離)戦略に基づいた 「オールインワン」型のトレーディングシステム です。 このテクニカルインジケーターの主な目的は、価格とMACDインジケーターの間に発生するダイバージェンスを検出 し、将来の価格の動きを示す
Market Flow Pro Market Flow Pro is an intelligent trading advisor for the MetaTrader 5 platform, designed for automatic trading on financial markets using algorithmic analysis and strict risk management. -Key features: - Fully automatic trading 24/5 - Adaptive trend and momentum entry algorithm -  Built-in risk management - Flexible lot settings (fixed/auto-calculation) - Support for major currency pairs and indices - Optimised for operation on various timeframes  How it works Market
Entry In The Zone and SMC Multi Timeframe is a real-time market analysis tool developed based on Smart Money Concepts (SMC). It is designed to analyze market structure, price direction, reversal points, and key zones across multiple timeframes in a systematic way. The system displays Points of Interest (POI) and real-time No Repaint signals, with instant alerts when price reaches key zones or when signals occur within those zones. It functions as both an Indicator and a Signal System (2-in-1), c
優れたテクニカルインジケーター「Grabber」をご紹介します。これは、すぐに使える「オールインワン」トレーディング戦略として機能します。 ひとつのコードに、市場のテクニカル分析ツール、取引シグナル(矢印)、アラート機能、プッシュ通知が強力に統合されています。 このインジケーターを購入された方には、以下の特典を無料で提供します: Grabberユーティリティ:オープンポジションを自動で管理するツール ステップバイステップのビデオマニュアル:インジケーターのインストール、設定、取引方法を解説 カスタムセットファイル:インジケーターをすばやく自動設定し、最大限の成果を出すための設定ファイル 他の戦略はもう忘れてください!Grabberだけが、あなたを新たなトレードの高みへと導いてくれるのです。 Grabber戦略の主な特徴: 推奨タイムフレーム:M5〜H4 対応通貨ペア・資産:どれでも使用可能ですが、私が実際に検証した以下を推奨します(GBPUSD、GBPCAD、GBPCHF、AUDCAD、AUDUSD、AUDSGD、AUDCHF、NZDUSD、NZDCAD、EURCAD、EURUSD、E
Power Candles – あらゆる市場に対応した強度ベースのエントリーシグナル Power Candles は、Stein Investments が長年培ってきた強度分析を価格チャート上に直接反映します。価格だけに反応するのではなく、各ローソク足は実際の市場の強さに基づいて色分けされ、モメンタムの蓄積、強度の加速、明確なトレンド転換を瞬時に把握できます。 すべての市場に共通する単一ロジック Power Candles は すべての取引シンボル で自動的に動作します。現在のシンボルが Forex か非 Forex 市場かを自動判別し、内部で適切な強度モデルを適用します。 Forex および Gold :FX Power のデルタ値を使用(絶対値レンジ最大 100) 指数、暗号資産、CFD :IX Power の強度値を使用(絶対値レンジ最大 50) 必要な強度計算は Power Candles に直接組み込まれています。ローソク足のカラーリングやシグナルロジックに、追加のインジケーターは不要です。 価格ノイズではなく「強度状態」 各ローソク足は、以下の 9 つの明確に定義された強
このインジケーターは、反転ポイントと価格戻りゾーンを正確に表示します。     主要プレーヤー 。新たなトレンドが形成される場所を把握し、最大限の精度で意思決定を行い、すべての取引をコントロールします。 TREND LINES PRO インジケーターと組み合わせることで、その潜在能力を最大限に発揮します。 VERSION MT4 インジケーターが示す内容: 新しいトレンドの始まりに活性化する反転構造と反転レベル。 リスクと報酬の比率を最小限に抑えた利益 確定 と 損失停止の レベルの表示     RR 1:2   。 インテリジェントな削減ロジックによるストップロス。 指定されたインジケーターから 2 つのトレンド タイプの反転パターンを表示します。 指標: トレンドを追う   TREND LINES PRO   (世界的なトレンドの変化) TREND PRO   (クイックトレンド変更) シンプルで効果的   スキャナー   リアルタイムトレンド(新機能)。 マルチタイムフレームのインストゥルメント フィルタリング。 画面   利益     LOGIC AI信号の後。 当日プラス方
Game Changerは、あらゆる金融商品で使用できる革新的なトレンドインジケーターです。MetaTraderを強力なトレンドアナライザーへと変貌させます。あらゆる時間枠で動作し、トレンドの特定、反転の可能性のシグナル、トレーリングストップ機能、そして迅速な市場反応のためのリアルタイムアラートを提供します。経験豊富なプロでも、優位性を求める初心者でも、このツールは自信と規律、そして根本的なトレンドダイナミクスを明確に理解した上で取引を行うための力となります。このインジケーターはリドロー機能も備えています。 購入後すぐにご連絡いただければ、個人ボーナスを進呈いたします。Strong SupportとTrend Scannerインジケーターの無料コピーを入手できます。[email protected]までプライベートメッセージを送ってください。 私のEAや特別なセットはTelegramでは販売しておりません。MQL5でのみ販売しており、セットファイルは私のブログでのみ公開しています。詐欺師にはご注意ください。他の方からセットを購入しないでください。 設定 トレンド変化時のアラート
FX Power: 通貨の強弱を分析して、より賢い取引を実現 概要 FX Power は主要通貨と金の実際の強弱をあらゆる市場状況で理解するための必須ツールです。強い通貨を買い、弱い通貨を売ることで、 FX Power は取引の意思決定を簡素化し、高い確率の取引機会を見出します。トレンドを追従する場合でも、極端なデルタ値を使用して反転を予測する場合でも、このツールはあなたの取引スタイルに完全に適応します。ただ取引するだけではなく、 FX Power で賢く取引をしましょう。 1. なぜ FX Power がトレーダーにとって非常に有益なのか 通貨と金のリアルタイム強弱分析 • FX Power は主要通貨と金の相対的な強弱を計算し、マーケットダイナミクスに関する明確な洞察を提供します。 • どの資産がリードしているか、または後れを取っているかを監視して、取引するペアを賢く選びましょう。 マルチタイムフレームの包括的なビュー • 短期、中期、長期のタイムフレームで通貨と金の強弱を追跡し、マーケットトレンドに基づいて取引戦略を調整できます。 • スキャルピングからスイングトレード
Azimuth Pro
Ottaviano De Cicco
5 (4)
発売プロモーション Azimuth Proは先着100名様限定で 299ドル でご提供します。最終価格は 499ドル となります。 リテールとインスティテューショナルのエントリーの違いはインジケーターではなく、ロケーションにあります。 多くのトレーダーは、モメンタムを追いかけたり、遅行シグナルに反応して、任意の価格レベルでエントリーします。機関投資家は、需給が実際にシフトする構造的なレベルに価格が到達するのを待ちます。 Azimuth Proはこれらのレベルを自動的にマッピングします:スイングアンカーVWAP、マルチタイムフレーム構造ライン、高確率ロケーションにのみ出現するABCパターン。 Azimuth Proは、構造分析とインテリジェントな自動化の両方を求めるプロフェッショナルトレーダー向けに構築されています。 Azimuthが外科的精度で市場構造をマッピングする一方、Azimuth Proはインテリジェンスレイヤーを追加します:トレーディングスタイルの自動検出、スマート設定された移動平均線、20年のデータでバックテストされた最適化パラメータ。その結果、お使いの銘柄と
Smart Stop Indicator – チャート上で実現するインテリジェントなストップロス精度 概要 Smart Stop Indicator は、ストップロスを勘や感情ではなく、明確で体系的に設定したいトレーダーのために設計されています。本ツールは、クラシックなプライスアクション(高値更新・安値切り下げ)と最新のブレイクアウト認識ロジックを組み合わせ、次に来るべき論理的なストップレベルを正確に特定します。トレンド相場、レンジ、急速なブレイクアウト局面のいずれであっても、最適な SL ゾーンとその状態(“new”、“broken”、“valid”)をチャート上に直接表示します。さらに今回、SL 距離の %ADR 表示も新たに追加されています。 主な特徴 マーケット構造に基づく自動ストップ配置 • 市場構造とリアルタイムの値動きに基づき、意味のあるストップロスレベルを自動検出します。 スマートなブレイクアウト感知 • 急激な方向転換やブレイクアウトにも柔軟に対応し、早すぎるストップ調整を避けます。 SL %ADR の表示 • ストップロスまでの距離を ADR(Averag
まず第一に、この取引インジケーターは再描画されず、再描画されず、遅延しないことを強調する価値があります。これにより、手動取引とロボット取引の両方に理想的なものになります。 ユーザーマニュアル:設定、入力、戦略。 アトミックアナリストは、価格の強さとモメンタムを利用して市場でより良いエッジを見つけるためのPA価格アクションインジケーターです。ノイズや誤ったシグナルを除去し、取引ポテンシャルを高めるための高度なフィルターを備えています。複雑なインジケーターの複数のレイヤーを使用して、アトミックアナリストはチャートをスキャンし、複雑な数学的計算をシンプルなシグナルと色に変換します。これにより、どのような初心者トレーダーでも理解して使用し、一貫した取引の決定を行うことができます。 「アトミックアナリスト」は、新規および経験豊富なトレーダー向けにカスタマイズされた包括的な取引ソリューションです。プレミアムインジケーターとトップノッチの機能を1つの取引戦略に組み合わせ、すべてのタイプのトレーダーにとって汎用性のある選択肢にします。 デイリートレーディングとスキャルピング戦略:高速で正確なデイ
RelicusRoad Pro: 定量的市場オペレーティングシステム 【期間限定】無制限アクセス 70% OFF - 2,000人超のトレーダーと共に なぜ多くのトレーダーは「完璧な」インジケーターを使っても失敗するのでしょうか? それは、文脈を無視して 単一の概念 だけでトレードしているからです。文脈のないシグナルは単なるギャンブルです。勝ち続けるには、 根拠の重なり(コンフルエンス) が必要です。 RelicusRoad Proは単なる矢印インジケーターではありません。完全な 定量的市場エコシステム です。独自のボラティリティモデリングを用いて、価格が推移する「適正価値の道(Fair Value Road)」をマッピングし、ノイズと真の構造的ブレイクを判別します。 推測はやめましょう。機関投資家レベルの「ロード・ロジック」でトレードを。 コアエンジン:「Road」アルゴリズム システムの中心となる Road Algo は、市場環境にリアルタイムで適応するダイナミックなボラティリティチャネルです。 安全ライン(平衡点) と、価格が数学的に反転しやすい 拡張レベル を投影します。 Si
Quantum TrendPulse を ご紹介します。これは、   SuperTrend   、   RSI   、および Stochastic のパワーを 1 つの包括的なインジケーターに組み合わせて、取引の可能性を最大限に引き出す究極の取引ツールです。精度と効率を求めるトレーダー向けに設計されたこのインジケーターは、市場のトレンド、勢いの変化、最適なエントリー ポイントとエグジット ポイントを自信を持って特定するのに役立ちます。 主な特徴: SuperTrend 統合: 現在の市場動向に簡単に追従し、収益性の波に乗ることができます。 RSI精度: 買われすぎと売られすぎのレベルを検出し、市場の反転のタイミングに最適で、SuperTrendのフィルターとして使用されます。 確率的精度: 確率的振動を活用して、変動の激しい市場で隠れたチャンスを見つけます。SuperTrend のフィルターとして使用されます。 マルチタイムフレーム分析:   M5 から H1 または H4 まで、さまざまなタイムフレームで市場を常に把握します。 カスタマイズ可能なアラート: カスタム取引条件が満たされ
トレンドラインプロ   市場の真の方向転換点を理解するのに役立ちます。この指標は、真のトレンド反転と主要プレーヤーが再び参入するポイントを示します。 分かりますか     BOSライン   複雑な設定や不要なノイズなしに、より長い時間足でのトレンドの変化と重要なレベルを把握できます。シグナルは再描画されず、バーが閉じた後もチャート上に残ります。 MT4バージョン   -   RFI LEVELS PRO インジケーター と組み合わせることで、その最大限の能力を発揮します インジケーターが示す内容: 本当の変化   トレンド(BOSライン) 一度シグナルが現れたら、それは有効です!これは、リペイント機能を持つインジケーターとの重要な違いです。リペイント機能を持つインジケーターは、シグナルを発した後、それを変更し、資金の損失につながる可能性があります。これにより、より高い確率と精度で市場に参入できます。また、矢印が現れた後、目標値(利益確定)に達するか、反転シグナルが現れるまで、ローソク足の色を変更する機能もあります。 繰り返しエントリ   主要プレーヤーの補充 エントリーポイントを探す
Trend Ai indicatorは、トレンドの識別と実用的なエントリポイントと反転アラートを組み合わせることで、トレーダーの市場分析を強化する優れたツールです。 この指標は、ユーザーが自信と正確さで外国為替市場の複雑さをナビゲートすることを可能にします トレンドAiインジケーターは、主要なシグナル以外にも、プルバックやリトレースメント中に発生するセカンダリエントリポイントを識別し、トレーダーが確立されたトレンド内の価格修正を活用できるようにします。 重要な利点: *MT4およびMT5の仕事 *明確な買いまたは売りシグナル *再描画しません ·すべての資産で動作します 私はeaやセットをtelegram it詐欺で販売しないように注意してください。 すべての設定はここでブログで無料です。  重要! 指示とボーナスを得るために購入後すぐに私に連絡してください! 私の他のプロダクトと同様、実質操作の監視はここに見つけることができます: https://www.mql5.com/en/users/mechanic/seller&nbsp ; 設定および入力: すべての
FX Dynamic: カスタマイズ可能なATR分析でボラティリティとトレンドを把握 概要 FX Dynamic は平均的な真のレンジ(ATR)の計算を活用して、日次および日中ボラティリティに関する卓越した情報をトレーダーに提供する強力なツールです。80%、100%、130%などのボラティリティ閾値を設定することで、通常の範囲を超えた際にすぐに警告を受け取ったり、有望な利益機会を素早く捉えられます。 FX Dynamic はブローカーのタイムゾーンに合わせて調整でき、安定したボラティリティ測定を維持しながら、リアルタイム分析のためにMetaTraderとシームレスに連携します。 1. なぜFX Dynamicがトレーダーにとって非常に有益か リアルタイムのATRインサイト • 日次・日中のボラティリティをひと目で把握。価格がATRの80%、100%、130%などに達したときに警告を受け取り、重要な水準にあるかどうかを確認できます。 • ボラティリティが完全に爆発する前に潜在的な反転やブレイクアウトを先取り可能。 幅広いマーケットへの適用 • 外国為替、コモディティ、株価指数な
トレンド スクリーナー インジケーターでトレンド取引の力を解き放ちます。ファジー ロジックと複数通貨システムを活用した究極のトレンド取引ソリューションです。 ファジー ロジックを活用した革新的なトレンド インジケーターである Trend Screener を使用して、トレンド取引を向上させます。 これは、13 を超えるプレミアム ツールと機能、および 3 つの取引戦略を組み合わせた強力なトレンド追跡インジケーターであり、Metatrader をトレンド アナライザーにする多用途の選択肢となります。 期間限定オファー : トレンド スクリーナー インジケーターは、わずか 100 ドルで生涯ご利用いただけます。 (元の価格 50$ ) (オファー延長) Trend Screener の 100% 非再描画精度の揺るぎない精度を体験して、取引の決定が過去の価格変動の影響を受けないようにしてください。 マルチタイムフレームおよびマルチ通貨機能の多用途性を解放し、比類のない自信を持って外国為替、商品、暗号通貨、インデックスの世界を取引できるようにします。 Trend Screener の包括的な
FX Levels: あらゆる市場における非常に高精度なサポート&レジスタンス 概要 通貨ペア、株式指数、個別銘柄やコモディティなど、どのような市場でも信頼できるサポートとレジスタンスを特定したいですか? FX Levels は伝統的な “Lighthouse” メソッドと先進的な動的アプローチを融合し、ほぼ汎用的な精度を実現します。ブローカーの実務経験を活かし、自動化されたデイリー更新とリアルタイム更新を組み合わせることで、 FX Levels は反転ポイントを見つけ、利益目標を設定し、自信をもってトレードを管理するための手助けをします。今すぐ試してみて、サポート/レジスタンス分析の正確性がどれほどトレードを向上させるかを実感してください! 1. FX Levels がトレーダーにとって非常に有用な理由 非常に正確なサポート&レジスタンスゾーン • FX Levels は異なるブローカー環境でもほぼ同一のゾーンを生成するよう設計されており、データフィードの差異や時刻設定のずれによる不一致を解消します。 • つまり、どのブローカーを利用していても一貫したレベルが得られるため、戦
これはMT5のインジケーターで、再描画なしで取引に参入するための正確なシグナルを提供します。 外国為替、暗号通貨、金属、株式、インデックスなど、あらゆる金融資産に適用できます。かなり正確な見積もりを提供し、取引を開始して終了するのに最適な時期を教えてくれます。1つのシグナルを処理しただけでインジケーターの元が取れた例の 動画 (6:22)をご覧ください。Entry PointsPro インジケーターの助けを借りたほとんどのトレーダーの最初の1週間の結果が改善しています。 Telegramグループ に登録してください。Entry Points Proインジケーターのメリットは次の通りです。 再描画のないエントリーシグナル 再描画されるインジケーターでは一度表示されたシグナルが削除されて大きな金銭的損失につながることがありますが、これと異なり、表示されて確認されたシグナルは消えることがありません。 エラーなしの取引開始 インジケーターアルゴリズムによって取引を開始する(資産を売買する)理想的な瞬間を見つけることができます。それを使用するすべてのトレーダーの成功率が向上します。 あら
Candle Smart Range
Gianny Alexander Lugo Sanchez
MetaTrader 5用 Candle Smart Range (CSR) Candle Smart Rangeは、複数のタイムフレームで価格レンジを自動的に識別するためのテクニカル指標です。このツールは、ローソク足の形成と、以前の高値・安値との相互作用に基づいて市場構造を分析します。 主な機能: レンジ検出: 勢いのある動きの前のコンソリデーション(保ち合い)ゾーンを特定します。 だまし(フェイクアウト)の識別: 価格が以前の水準を超えたものの、ローソク足の終値基準でレンジ内に戻った場合をマークします。 マルチタイムフレーム分析: カスタム期間を含む最大19のタイムフレームのデータを1つのチャートに表示します。 内部可視化(ズーム): チャートを切り替えずに、上位足のローソク足内部の値動きを確認できます。 時間フィルター: 主要な市場セッションなど、特定の時間帯で動作するように設定可能です。 履歴確認モード: 過去のデータをステップバイステップで確認し、分析できます。 アラート機能: ローソク足の確定や新しいレンジの検出を通知します。 インターフェース: 視覚的な負荷を管理する画面
Mirage Trading System — False Breakout (Fakey) Pattern Detector for MetaTrader 5 Overview   Mirage Trading System detects the Fakey pattern (false breakout reversal) on completed bars and draws entry, stop loss, and take profit levels on the chart. Detection is non-repainting: signal values do not change after bar close. The indicator scores each candidate pattern across 17 factors and routes scored signals through a 4-layer Signal Engine before displaying a tier-classified result. How Detectio
IX Power MT5
Daniel Stein
4.92 (13)
IX Power: 指数、商品、暗号資産、外国為替市場の洞察を発見 概要 IX Power は、指数、商品、暗号資産、外国為替市場の強弱を分析するための多用途ツールです。 FX Power が全ての利用可能な通貨ペアデータを活用して外為ペアで最高の精度を提供する一方、 IX Power は基礎資産の市場データにのみ焦点を当てています。この特性により、 IX Power は非外為市場に最適であり、単純な外為分析にも信頼性の高いツールです。どのチャートでもスムーズに機能し、取引判断を向上させるための明確で実行可能な洞察を提供します。 1. IX Power がトレーダーにとって価値がある理由 複数市場での強弱分析 • IX Power は指数、商品、暗号資産、外為シンボルの強弱を計算し、それぞれの市場に合わせた洞察を提供します。 • US30、WTI、ゴールド、ビットコイン、または通貨ペアなどの資産を監視して取引機会を発見できます。 幅広い市場に適応 • 外為取引では、 FX Power が関連する全ての通貨ペアを分析することで比類のない精度を提供します。 • IX Power
ARIPoint is a powerful trading companion designed to generate high-probability entry signals with dynamic TP/SL/DP levels based on volatility. Built-in performance tracking shows win/loss stats, PP1/PP2 hits, and success rates all updated live. Key Features: Buy/Sell signals with adaptive volatility bands Real-time TP/SL/DP levels based on ATR Built-in MA Filter with optional ATR/StdDev volatility Performance stats panel (Success, Profit/Loss, PP1/PP2) Alerts via popup, sound, push, or email Cu
The Trend Forecaster indicator utilizes a unique proprietary algorithm to determine entry points for a breakout trading strategy. The indicator identifies price clusters, analyzes price movement near levels, and provides a signal when the price breaks through a level. The Trend Forecaster indicator is suitable for all financial assets, including currencies (Forex), metals, stocks, indices, and cryptocurrencies. You can also adjust the indicator to work on any time frames, although it is recommen
「 Dynamic Scalper System MT5 」インジケーターは、トレンド波の中でスキャルピング取引を行う手法のために設計されています。 主要通貨ペアと金でテスト済みで、他の取引商品との互換性があります。 トレンドに沿った短期的なポジションオープンのシグナルを提供し、追加の価格変動サポートも提供します。 インジケーターの原理 大きな矢印はトレンドの方向を決定します。 トレンド波の中では、小さな矢印の形でスキャルピングシグナルを生成するアルゴリズムが機能します。 赤い矢印は強気方向、青い矢印は弱気方向です。 トレンドの方向には敏感な価格変動ラインが描かれ、小さな矢印のシグナルと連動します。 シグナルは次のように機能します。適切なタイミングでラインが現れるとエントリーシグナルが形成され、ラインが開いている間はポジションが保持され、完了すると取引が終了します。 推奨される動作時間枠はM1~H4です。 矢印は現在のローソク足に形成され、次のローソク足が開いている場合は、前のローソク足の矢印は再描画されません。 入力パラメータ Trend Wave Period - トレ
作者のその他のプロダクト
The tool allows user to easily add: Stop Loss, Take Profit,   Trailing Stop, Break Even, Target Manually editing the lines.  Parameters : Magic Number : number to identify your EA, used when applied to multiple assets. Distance from Bid Price (ticks):  Current price value to place the buy or sell order in ticks (each tick represents the smallest price variation). Slippage (0 = off):  represents the maximum difference in pips for the order to go through. Volume:   Lot size. Ex
An indicator for finding patterns of candles. Through this indicator it is possible to recognize several patterns of candlesticks: hammer, inverted hammer, doji, maximum swallow, minimum swallow and inside bar. The patterns can be found by modifying the values of the indicator parameters. In this way it becomes possible to recognize an infinity of patterns. How to use: Add the indicator to the chart. Parameters: [doji -> max body size] represents the maximum body size of the doji (difference b
It is an indicator that works with oscillations based on golden proportions. Through this indicator it is possible to operate using the proportions of the number of gold to elaborate strategies with the golden ratio. In this way, it is possible to make market analyzes respecting the proportions of Fibonacci. How to use: The closer the lines are to each other, the greater the possibility of retraction or inversion of the movement, the same is true for the distance of the lines. Nearby lines,  sug
É um indicador oscilador baseado no "MACD" convencional porém com suavização . Através desse indicador você será capaz de operar sem os ruídos produzidos pelo indicador "MACD" convencional. Em quais ativos o indicador funciona: Em qualquer ativo do mercado, tanto em forex, como B3 ou binárias.   Qual é o novo parâmetro: Smooth Period ou período de suavização, que representa o período que será suavizado no "MACD".
SR Breakup
Francisco De Biaso Neto
SR Breakup Indicator   it is an indicator based on support and resistance . It makes price breakout levels visible by opening the trader's mind to spot market opportunities.  Attention!!!   This Indicator can be used in any time frame. Suggestion of use Wait until the support and resistance lines are horizontal and closer. Do Trade (BUY):  if price breakout resistance level (outside line). Do Trade (SELL):  if price breakout support level (outside line). Use internal lines as StopLo
フィルタ:
レビューなし
レビューに返信