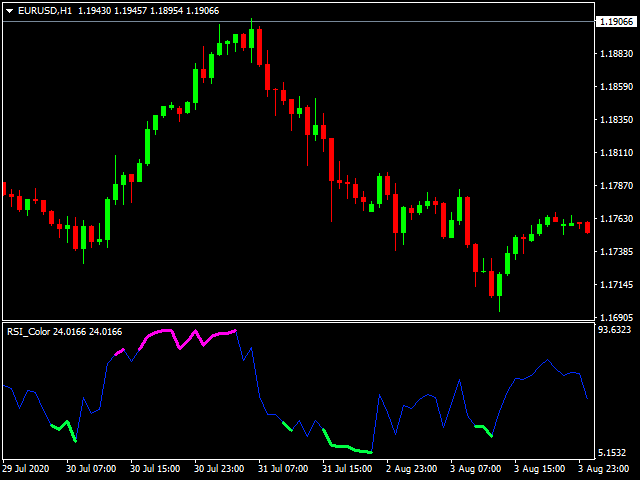
RSI Color and Notification
- インディケータ
- バージョン: 1.0

RSI Color and Notification
Setting Usages ::
1. Set value Oversold and Overbought
2. Set period RSI
3. Set Color
4. Notify to Alert, Email and Mobile.
For Trading :: Forex and Binary option
1. When the color alarm occurs in the OVB area, do the preparation. To enter a Sell order
2. When the color alarm occurs in the OVS area, do the preparation. To enter a Buy order
3. When RSI is between OVB and OVS, consider another indicator to trade.
ユーザーは評価に対して何もコメントを残しませんでした