Hyper Force

4.5
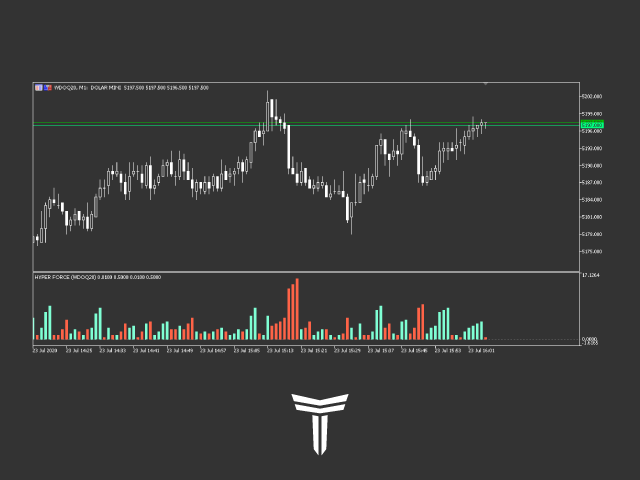
もともと1984年にDavid Weisによって作成されたハイパーフォースインジケーターは、シンボルのトレンドの強さを波形で示します。

波が大きいほど、傾向が強くなります。

小さな波はトレンドの弱い、またはトレンドのない市場を意味します。

波では、棒と棒の差が大きいほど、傾向が強くなります。

あるバーと別のバーの間の距離が減少し始めると、それは波がその傾向を失い始めたことを意味します。

そのため、強い力で波を捉え、弱まったときに外に出るのが理想的です。

移動平均などの他の指標であるMACDは、この傾向を強さで確認するのに役立ちます。

移動平均などの他の指標であるMACDは、この傾向を強さで確認するのに役立ちます。

レビュー 3
8953f8
34
8953f8 2022.04.01 15:19 
 

Parabéns amigo seu indicador é o elemento que faltava em combinação com outros indicadores para bons aproveitamentos!

cachimone
24
cachimone 2021.03.06 01:55 
 

Estou aprendendo a utiliza-lo.

おすすめのプロダクト
Value Chart Candlesticks
Flavio Javier Jarabeck
4.69 (13)
The idea of a Value Chart indicator was presented in the very good book I read back in 2020 , " Dynamic Trading Indicators: Winning with Value Charts and Price Action Profile ", from the authors Mark Helweg and David Stendahl. The idea is simple and the result is pure genius: Present candlestick Price analysis in a detrended way! HOW TO READ THIS INDICATOR Look for Overbought and Oversold levels. Of course, you will need to test the settings a lot to find the "correct" one for your approach. It
FREE
Free for now, price is going to be 30 USD at Jan 1. 2025. Features: Pin Bar Detection : The indicator is designed to identify bullish and bearish pin bars based on specific criteria, including the relative size of the candle’s body and shadow, as well as the position of the candle's body in relation to the 38.2% Fibonacci level. Customizable Labels : Custom text is displayed above each identified bullish or bearish pin bar, such as "[38.2]" for bullish and "[-38.2]" for bearish, helping traders
FREE
SPREADEX e' un indicatore per MT4 e MT5 che indica la distanza dell'ASSET dal GP. il GP e' il prezzo del vero valore dell'ASSET sottostante ottenuto per stima. Il GP e' come una calamita, attira il prezzo dell'ASSET con alta probabilita' ed all'interno della stessa giornata di trading. Quindi SPREADEX indica quali sono gli asset piu distanti dal GP al momento in tempo reale. Fornendo un punto di vista al TRADER su quali asset concentrarsi e cercare eventuali segnali di inversione dei prezzi per
FREE
The Multi-Frame MACD Indicator is a robust MetaTrader 5 (MT5) indicator that utilizes the Moving Average Convergence Divergence (MACD) to analyze trends across multiple timeframes. This indicator synchronizes MACD-based trend signals from up to nine timeframes (M1, M5, M15, M30, H1, H4, D1, W1, MN1) and presents them with clear visual cues, including a colored MACD line, signal arrows, and a customizable dashboard. Perfect for traders seeking momentum and trend reversal insights. Features Multi-
FREE
Trading Sessions by Mahefa R is an indicator for MetaTrader 5 that visually identifies the four main trading sessions: New York, London, Tokyo, and Sydney . Designed to provide a clean, intuitive, and professional market view, it highlights the most active periods of the Forex market using smart visualization of session ranges , session-specific candle colors , and daily separators . Main Features: Automatic detection of the 4 major sessions New York London Tokyo Sydney Each session is fully c
FREE
フェニックス移動平均メーター (MT5) MetaTrader 5向けプロフェッショナルな移動平均トレンド分析・可視化ツール。インテリジェントな傾き分析、雲幅測定、相場状態分類を洗練されたリアルタイムダッシュボードに統合。 概要 フェニックス移動平均メーターは、速い移動平均と遅い移動平均の関係を分析し、トレンドの方向性、強さ、成熟度を判定します。本指標は移動平均の傾き角度、雲幅の拡大・縮小、クロスオーバー発生からの経過時間を継続的に監視し、現在の市場レジームをリアルタイムで分類します。 システムは二つの馬蹄形メーター表示を採用。傾き位置メーターは短期移動平均の角度を「下降→横ばい→上昇」まで可視化し、雲幅メーターはトレンドの圧縮・拡大を過去平均値と比較して測定します。両メーターが連動することで、勢いの質とトレンド持続性に関する即時的な洞察を提供します。 トレンド状態は強気・弱気双方において「弱」「中」「強」「延長」に自動分類されます。雲のカラーリングはトレンド状態に直接連動し、チャートとダッシュボード間の視覚的整合性を確保。ノイズを低減し、生指標値ではなく実用的なトレンド状態
FREE
Free automatic Fibonacci is an indicator that automatically plots a Fibonacci retracement based on the number of bars you select on the BarsToScan setting in the indicator. The Fibonacci is automatically updated in real time as new highest and lowest values appears amongst the selected bars. You can select which level values to be displayed in the indicator settings. You can also select the color of the levels thus enabling the trader to be able to attach the indicator several times with differe
FREE
AZ session scalper A small but useful session indicator, designed primarily for scalping. Enable the session you plan to trade, watch the reaction of the M5/M15 candlesticks to the level of the previous trading session, and enter. We always look at the reaction of the current session to the previous one. For example, if you trade the Americas, enable the European session, and watch how one session takes away liquidity from another. Important: adjust the time to your broker's time zone in the i
FREE
この情報インジケーターは、アカウントの現在の状況を常に把握したい人にとって役立ちます。 VERSION MT 4 -   More useful indicators このインジケーターには、ポイント、パーセンテージ、通貨での利益、現在のペアのスプレッド、現在の時間枠でバーが閉じるまでの時間などのデータが表示されます。 チャート上に情報線を配置するには、いくつかのオプションがあります。 価格の右側 (価格の後ろにあります)。 コメントとして (グラフの左上隅に); 画面の選択した隅。 情報区切り記号を選択することもできます。 | / \ # このインジケーターは使いやすく、非常に有益です。設定で不要な情報項目を無効にすることも可能です。 設定 外観の種類     - 情報行の表示タイプ。次の 3 つのオプションがあります。 価格に従ってください     - 価格に従う。 コメントとして     - コメントとして; 画面の選択した隅に     - 画面の選択した隅にあります。 添付用グラフコーナー     - 表示タイプを選択した場合 画面の選択されたコーナーでは、この項目を使用して
FREE
The indicator highlights the points that a professional trader sees in ordinary indicators. VisualVol visually displays different volatility indicators on a single scale and a common align. Highlights the excess of volume indicators in color. At the same time, Tick and Real Volume, Actual range, ATR, candle size and return (open-close difference) can be displayed. Thanks to VisualVol, you will see the market periods and the right time for different trading operations. This version is intended f
FREE
Combining the best of Price Action , Directional Movement , and Divergence/Convergence analysis, Candle Color Trend is a easy and reliable way to identify trend direction. The indicator automatically paints the candles according to the assumption that an uptrend is defined by prices that form a series of higher highs and higher lows. In contrast, a downtrend is defined by prices that form a series of lower highs and lower lows. Additionally, ADX Wilder indicator is used to measure trend weakness
FREE
MIDAS Super VWAP
Flavio Javier Jarabeck
4.27 (11)
Imagine VWAP, MVWAP and MIDAS in one place... Well, you found it! Now you can track the movement of Big Players in various ways, as they in general pursue the benchmarks related to this measuring, gauging if they had good execution or poor execution on their orders. Traders and analysts use the VWAP to eliminate the noise that occurs throughout the day, so they can measure what prices buyers and sellers are really trading. VWAP gives traders insight into how a stock trades for that day and deter
FREE
O Afastamento da Média Móvel, é uma poderosa ferramenta de análise técnica projetada para fornecer uma representação visual do afastamento entre o preço atual e uma média móvel específica. Este indicador, desenvolvido para o MetaTrader, oferece aos traders uma perspectiva clara das mudanças na dinâmica de preço em relação à tendência de médio prazo. Versão MT4:  https://www.mql5.com/pt/market/product/111705
FREE
Mae Pla Green Pen Analysis Framework The Mae Pla Green Pen Analysis Framework is a multi-timeframe price action scanner for XAUUSD (Gold Spot) . It monitors all 9 timeframes simultaneously — M1, M5, M15, M30, H1, H4, D1, W1, and MN — and displays pattern detection results on a real-time dashboard drawn directly on the chart. The indicator is based on the Mae Pla Green Pen trading methodology, which uses structured price action patterns to identify potential trade setups. Pattern Detection Three
FREE
Stackable VWAP
Flavio Javier Jarabeck
3.5 (4)
Volume Weighted Average Price (VWAP) is a trading benchmark commonly used by Big Players that gives the average price a Symbol has traded throughout the day. It is based on both Volume and price. Additionally we put in this indicator the MVWAP (Moving Volume Weighted Average Price). For those who do not know the usage and the importance od this indicator I recommend a great article about this subject at Investopedia ( https://www.investopedia.com/articles/trading/11/trading-with-vwap-mvwap.asp
FREE
Fuzzy Trend Scanner
Gabriel Alejandro Sanchez Lledo
WARLOCK Trend Screener AI Fuzzy MT5 — 最先端のマルチシンボルAI搭載トレンドスキャナー 市場全体の高確率なトレンドトレードを数秒で発見 — リアルなAIスタイルの確率スコアリングを搭載。 WARLOCK Trend Screener AI Fuzzy MT5 は、誰よりも早く最強のトレンドを掴みたい本格的なトレーダーのために設計された、究極の次世代トレンドスキャナーです。 もう28個のチャートを切り替える必要はありません。動きの強さを予測する必要もありません。 ファジー論理 (Fuzzy Logic) + AIコンフルエンス・スコアリング を備えた洗練されたダッシュボードで、市場全体を一目で把握できます。 WARLOCK Trend Screener AI Fuzzy が選ばれる理由 主要28通貨ペア・9つの時間足 を同時にスキャン。 正確なトレンド確率% (0-100%) を各セルに表示。 100% リペイントなしのシグナル — 確定足でのみ矢印が表示されます。 プレミアム・ダークパステルデザイン を採用。 フルインタラクティブ&ドラッグ可能 な
FREE
フラワーインジケーターは、主にトレンドを特定し、スキャルピングやデイトレード戦略を支援するテクニカル分析ツールです。 フラワーインジケーターは、テクニカル分析と価格動向分析に基づいたシグナルトレンドインジケーターです。色付きの花を使ってトレンドを視覚的に示します。青い花は上昇トレンド、赤い花は下降トレンドを示します。 各レベルはサポートラインとレジスタンスラインのように機能します(チャート上に+/- 200レベルとドットが表示されたら注意してください)。 買われ過ぎ/売られ過ぎの静的レベル、付随するバンド、両方、またはどちらかを突破した時にドットが表示されるように設定できます。 このインジケーターは、アキュムレーション/ディストリビューションゾーンを特定しながら、市場の反転の可能性を探ります。あらゆる銘柄と時間枠に対応しており、パラメータは自由に調整できます。各レベルはサポートラインとレジスタンスラインのように機能します。
FREE
PROMETHEUS TECHNICAN VERSION Free | By THE SONS A gift from The Sons — no strings, no trial, no expiry. Every trader deserves access to professional-grade market intelligence. That belief is why Prometheus Technical Version exists, and why it costs nothing. Consider it our handshake to the trading community. What You're Getting This is not a simplified tool dressed up as a gift. Prometheus Technican Version is a fully built, institutional-quality technical analysis indicator running a dual-model
FREE
Simple Weis Wave
Jean Jacques Huve Ribeiro
3.67 (3)
One of the best tools for analyzing volume, Weis Wave was idelized by David Weis, to facilitate the reading of directional flow. For the VSA method disciples it is an evolution of the practices created by Richard Wycoff, facilitating a predictive reading of the market, always seeking an accumulation and distribution of the negotiated contracts. Cumulative wave volume  Range of wave ( removed) Average Wave volume Ref "Tim Ord lectures" ( removed)
FREE
この指標は、2つの移動平均の差をヒストグラムの形で示しています。 移動平均には巨大なカスタマイズオプションがあります。 ヒストグラムの色が変わると、あらゆる方法で通知されます。端末でビープ音が鳴り、電話に通知を送信し、メールに電子メールを送信します。今、あなたは間違いなく取引を見逃すことはありません。 チャート上の線の形で完全に無料の移動平均交差点インジケータ: https://www.mql5.com/ja/market/product/148478 あなたのフィードバックは私にとって非常に重要です。 フィードバックは開発をはるかに良くし、私たちが一緒に前進するのに役立ちます。 ご質問がありますか、あなたの意見を共有したいですか? コメントを書いたり、メッセージを送信します-私はいつも連絡を取り合っています! このツールは、市場を監視するルーチンを引き継ぐあなたの信頼性の高いアシスタントになります。 交差点の瞬間を見越してチャートを常に見る代わりに、このタスクをインジケーターに委ねることができます。 明確なヒストグラム列を使用してトレンド強度のダイナミクスを視覚化するだけでなく、最も
FREE
This is an indicator to assist a trader on trend detection of any market. This indicator is made up of a blend of moving averages for trend detection. I know no indicator is 100% accurate , but this might help you. I'm giving it for free and also , there are important settings on the last screenshot. This indicator should be on a separate window after you set it up on the chart.
FREE
Phoenix Delta Volume
Nigel Nii Darku Narnor Darko
This is the Phoenix Institutional SMC Dashboard (Emerald-Teal Edition). It is engineered to provide retail traders with the same "Volume-at-Price" clarity used by institutional desks. Below is a full breakdown of the benefits, the high-confluence logic for entries, and how to manage your trades using the current visual engine. Strategic Benefits to the User Sentiment over Price: Most indicators only look at where the price is. This dashboard tells you how much effort (Volume Delta) was required
FREE
MSX Hybrid Heiken Scalper Elevate Your Scalping Precision with a Next-Generation Non-Repaint Heiken Ashi Indicator The MSX Hybrid Heiken Scalper is a scientifically designed, non-repainting Heiken Ashi indicator optimized for M5 to H1 scalping on MetaTrader 5. It introduces a robust closed-bar smoothing method that preserves trend clarity while filtering minor price noise — all without using traditional EMA/WMA/HMA smoothing that causes repainting. Reliable Closed Candle Logic Each candle’s
FREE
VWAP and MVWAP
Flavio Javier Jarabeck
3.88 (8)
Volume Weighted Average Price (VWAP) is a trading benchmark commonly used by Big Players that gives the average price a Symbol has traded throughout the day. It is based on both Volume and price. Additionally we put in this indicator the MVWAP (Moving Volume Weighted Average Price). For those who do not know the usage and the importance od this indicator I recommend a great article about this subject at Investopedia ( https://www.investopedia.com/articles/trading/11/trading-with-vwap-mvwap.asp )
FREE
Follow The Line MT5
Oliver Gideon Amofa Appiah
4.6 (35)
This indicator obeys the popular maxim that: "THE TREND IS YOUR FRIEND" It paints a GREEN line for BUY and also paints a RED line for SELL. (you can change the colors). It gives alarms and alerts of all kinds. IT DOES NOT REPAINT and can be used for all currency pairs and timeframes. Yes, as easy and simple as that. Even a newbie can use it to make great and reliable trades. NB: For best results, get my other premium indicators for more powerful and reliable signals. Get them here: https://www.m
FREE
Indicator and Expert Adviser  EA Available in the comments section of this product. Download with Indicator must have indicator installed for EA to work. Mt5 indicator alerts for bollinger band and envelope extremes occurring at the same time. Buy signal alerts occur when A bullish candle has formed below both the lower bollinger band and the lower envelope  Bar must open and close below both these indicators. Sell signal occur when A bear bar is formed above the upper bollinger band and upper
FREE
Bollinger Bands B
Flavio Javier Jarabeck
4.25 (4)
John Bollinger created this indicator in 2010 as a way to read the original indicator (Bollinger Bands) in a more "technical" way, shown as an oscillator. The typical range of the Bollinger Bands %B is 0 - 0.5 - 1.0, where "0" represents the lower band, the "0.5" the middle band, and "1" the upper band. The line on the indicator represents the Closing prices. As simple as that. SETTINGS Bollinger Bands period of analysis Standard Deviation multiplier Shift Price type to be analyzed If you like
FREE
This indicator demonstrates the probable dynamic support and resistance levels of EMA, Ichimoku lines, and Key OHLC levels for different timeframes on one chart. This can drastically reduce the time and effort needed for switching between different timeframes. EMA and Ichimoku Levels are drawn for the M1, M5, M15, M30, H1, H4, and D1 timeframes, and the Key OHLC levels of the last periods are drawn for the H4, D1, W1, and MN1 timeframes. 
FREE
This indicator extracts a trend from a price series and forecasts its further development. Algorithm is based on modern technique of Singular Spectral Analysis ( SSA ). SSA is used for extracting the main components (trend, seasonal and wave fluctuations), smoothing and eliminating noise. It does not require the series to be stationary, as well as the information on presence of periodic components and their periods. It can be applied both for trend and for another indicators. Features of the me
FREE
This EA finds Fair Value Liquidity (FVL) on the chart, tracks when they get mitigated , and then looks for an inversion signal (price “fails” through the zone). When that inversion happens, it places a trade in the opposite direction of the original Liquidity gap (an Inverse FVG approach). It also lets you control when it trades using market sessions , and it can auto-close positions at New York open (all positions or profitable-only). Key advantages Clear, rule-based entries (no guessing): trad
FREE
このプロダクトを購入した人は以下も購入しています
SuperScalp Pro
Van Minh Nguyen
4.57 (21)
SuperScalp Pro – 高度なマルチフィルタースキャルピングインジケーターシステム SuperScalp Pro は、クラシックな Supertrend と複数のインテリジェント確認フィルターを組み合わせた高度なスキャルピングインジケーターです。M1 から H4 まで複数の時間足で効率的に動作し、XAUUSD、BTCUSD、主要 Forex 通貨ペア向けに最適化されています。 このインジケーターは明確な Buy / Sell シグナルを提供し、ATR に基づいてエントリー価格、Stop Loss、Take Profit を自動計算します。Fibonacci Take Profit 機能により、重要な価格帯で早期決済し、到達時に通知を送信します。 初期設定では Fibonacci Take Profit が有効化されており、より安定した取引体験を重視しています。チャートに適用するだけですぐ利用可能です。上級者向けに、すべてのパラメータは自由にカスタマイズできます。 EMA、RSI、ADX、Volume、VWAP、Bollinger Bands、MACD Divergence な
このインジケーターを購入された方には、以下の特典を 無料 で提供しています: 各トレードを自動で管理し、ストップロスとテイクプロフィットを設定し、戦略ルールに基づいてポジションを決済する補助ツール 「Bomber Utility」 様々な銘柄に合わせたインジケーターの設定ファイル(セットファイル) 「最小リスク」、「バランスリスク」、「待機戦略」 の3つのモードで使用できる Bomber Utility 用の設定ファイル このトレーディング戦略をすぐに導入・設定・開始できる ステップバイステップのビデオマニュアル ご注意: 上記の特典を受け取るには、MQL5のプライベートメッセージシステムを通じて販売者にご連絡ください。 オリジナルのカスタムインジケーター 「Divergence Bomber(ダイバージェンス・ボンバー)」 をご紹介します。これは、MACDのダイバージェンス(乖離)戦略に基づいた 「オールインワン」型のトレーディングシステム です。 このテクニカルインジケーターの主な目的は、価格とMACDインジケーターの間に発生するダイバージェンスを検出 し、将来の価格の動きを示す
Entry In The Zone and SMC Multi Timeframe is a real-time 2-in-1 market analysis tool that combines market structure analysis and a No Repaint BUY / SELL signal system into a single indicator, built on Smart Money Concepts (SMC) — a widely adopted framework used by professional traders to understand market structure. This indicator helps you see the market more clearly, make decisions based on structure rather than guesswork, and focus on high-probability zones where price is more likely to react
Azimuth Pro
Ottaviano De Cicco
5 (6)
Azimuth Pro V2:MT5向けシンセティック・フラクタル構造分析と確認済みエントリー 概要 Azimuth Pro は Merkava Labs によるマルチレベルスイング構造インジケーターです。4つのネストされたスイングレイヤー、スイングアンカーVWAP、ABCパターン検出、3タイムフレーム構造フィルタリング、そして確定バーでの確認済みエントリー — 1つのチャートで、ミクロスイングからマクロサイクルまでを網羅するワークフロー。 これはブラインドシグナル製品ではありません。ロケーション、コンテキスト、タイミングを重視するトレーダーのための構造ファーストワークフローです。 V2発売記念オファー — Azimuth Pro V2をUSD 399で(次の100本)。最終価格:USD 499。 1. V2での変更点 シンセティック・マルチタイムフレームエンジン 上位タイムフレーム分析をMeridian Proと同じ独自のシンセティックアーキテクチャで一から再構築。よりクリーンなHTFコンテキスト、安定したライブ動作、従来のMTF同期問題なし。シンセティックエンジンは 固定比率タ
Gold Entry Sniper – ゴールドスキャルピング&スイングトレード用プロフェッショナル多時間足ATRダッシュボード Gold Entry Sniper は、XAUUSDや他の銘柄向けに正確な 売買シグナル を提供する、MetaTrader 5用の高度なインジケーターです。 ATRトレーリングストップロジック と 多時間足分析ダッシュボード を搭載し、スキャルピングからスイングトレードまで対応します。 主な特徴と利点 多時間足シグナル分析 – M1、M5、M15 のトレンドを同時表示。 ATRベースのトレーリングストップ – ボラティリティに応じて動的に調整。 プロ仕様のチャートダッシュボード – シグナル状況、ATRレベル、回帰線、売買方向を表示。 明確な売買マーカー – 自動矢印とテキストラベル。 エグジットアラートとトレード管理 – 利益確定のための自動検出。 完全カスタマイズ可能 – パネル位置、色、フォント、ATR/回帰設定を調整可能。 ゴールド(XAUUSD)に最適化 – M1〜M15のスキャルピングに最適、FXや指数、暗号資産にも対応。 Gold Entry
Gann Made Easy   は、ミスター・ギャンの理論を使用した取引の最良の原則に基づいた、プロフェッショナルで使いやすい外国為替取引システムです。 W・D・ガン。このインジケーターは、ストップロスとテイクプロフィットレベルを含む正確な買いと売りのシグナルを提供します。 PUSH通知を利用して外出先でも取引可能です。 ご購入後、取引方法の説明と優れた追加インジケーターを無料で入手するには、私にご連絡ください! おそらく、ギャンの取引手法についてはすでに何度も聞いたことがあるでしょう。通常、ギャンの理論は初心者のトレーダーだけでなく、すでにある程度の取引経験がある人にとっても非常に複雑なものです。なぜなら、ギャンの取引手法は理論的にはそれほど簡単に適用できるものではないからです。私はその知識を磨き、最良の原則を私の外国為替インジケーターに組み込むために数年を費やしました。 このインジケーターは非常に簡単に適用できます。必要なのは、それをチャートに添付し、簡単な取引推奨事項に従うだけです。このインジケーターは常に市場分析の仕事を行い、取引の機会を探します。適切なエントリーポイントを検
Quantum TrendPulse を ご紹介します。これは、   SuperTrend   、   RSI   、および Stochastic のパワーを 1 つの包括的なインジケーターに組み合わせて、取引の可能性を最大限に引き出す究極の取引ツールです。精度と効率を求めるトレーダー向けに設計されたこのインジケーターは、市場のトレンド、勢いの変化、最適なエントリー ポイントとエグジット ポイントを自信を持って特定するのに役立ちます。 主な特徴: SuperTrend 統合: 現在の市場動向に簡単に追従し、収益性の波に乗ることができます。 RSI精度: 買われすぎと売られすぎのレベルを検出し、市場の反転のタイミングに最適で、SuperTrendのフィルターとして使用されます。 確率的精度: 確率的振動を活用して、変動の激しい市場で隠れたチャンスを見つけます。SuperTrend のフィルターとして使用されます。 マルチタイムフレーム分析:   M5 から H1 または H4 まで、さまざまなタイムフレームで市場を常に把握します。 カスタマイズ可能なアラート: カスタム取引条件が満たされ
このインジケーターを購入すると、プロ仕様のトレードマネージャーを無料で差し上げます。 まず第一に、このトレーディングシステムがノンリペイント、ノンリドロー、ノンラグのインジケーターであることを強調する価値がある。これにより、手動取引とロボット取引の両方に理想的なものになっています。 オンラインコース、マニュアル、プリセットのダウンロード。 「スマートトレンドトレーディングシステム MT5」は、新規および経験豊富なトレーダー向けにカスタマイズされた包括的なトレーディングソリューションです。10以上のプレミアムインジケーターを組み合わせ、7つ以上の堅実なトレーディング戦略を備えており、多様な市場状況に対応する多目的な選択肢となっています。 トレンドフォロー戦略:トレンドを効果的に乗り越えるための正確なエントリーとストップロス管理を提供します。 リバーサル戦略:潜在的なトレンドの反転を特定し、トレーダーがレンジ相場を活用できるようにします。 スキャルピング戦略:高速で正確なデイトレードおよび短期取引のために設計されています。 安定性:すべてのインジケーターはノンリペイント、ノンリドロー、ノ
OmniSync Projection
Antonio-alin Teculescu
5 (1)
Chronos Fractal Engine is an innovative price projection indicator for MetaTrader 5, designed to transform your technical analysis by intelligently identifying and projecting historical price patterns. Built upon an advanced correlation algorithm and the fractal principles of the market, this powerful tool visualizes potential future price movements, giving you a unique edge in your trading decisions. What is Chronos Fractal Engine? At its core, the Chronos Fractal Engine employs a sophisticat
Power Candles – あらゆる市場に対応した強度ベースのエントリーシグナル Power Candles は、Stein Investments が長年培ってきた強度分析を価格チャート上に直接反映します。価格だけに反応するのではなく、各ローソク足は実際の市場の強さに基づいて色分けされ、モメンタムの蓄積、強度の加速、明確なトレンド転換を瞬時に把握できます。 すべての市場に共通する単一ロジック Power Candles は すべての取引シンボル で自動的に動作します。現在のシンボルが Forex か非 Forex 市場かを自動判別し、内部で適切な強度モデルを適用します。 Forex および Gold :FX Power のデルタ値を使用(絶対値レンジ最大 100) 指数、暗号資産、CFD :IX Power の強度値を使用(絶対値レンジ最大 50) 必要な強度計算は Power Candles に直接組み込まれています。ローソク足のカラーリングやシグナルロジックに、追加のインジケーターは不要です。 価格ノイズではなく「強度状態」 各ローソク足は、以下の 9 つの明確に定義された強
FX Trend NG:次世代マルチマーケット・トレンドインテリジェンス 概要 FX Trend NG は、複数の時間足に対応したプロフェッショナル向けトレンド分析およびマーケット監視ツールです。 市場全体の構造を数秒で把握することができます。 複数のチャートを切り替える必要はありません。どの銘柄がトレンド中なのか、どこでモメンタムが弱まっているのか、そしてどの時間足で強い整合性があるのかを瞬時に確認できます。 ローンチ特別オファー – FX Trend NG を $30(6ヶ月) または $80 永久ライセンス でご利用いただけます。 すでに Stein Investments のユーザーですか? -> メッセージを送信 して、プライベートグループへアクセスしてください。 セットアップや詳細情報が必要ですか? -> Stein Investments 公式ページ をご覧ください。 1. FX Trend NG が他と異なる理由 3ステート・トレンドロジック ― Buy と Sell だけではない • 多くのインジケーターは Buy または Sell の2状態のみを表示します。
ご紹介     Quantum Breakout PRO は 、ブレイクアウト ゾーンの取引方法を変革する画期的な MQL5 インジケーターです。 13年以上の取引経験を持つ経験豊富なトレーダーのチームによって開発されました。     クォンタム ブレイクアウト プロ   は、革新的でダイナミックなブレイクアウト ゾーン戦略により、あなたのトレーディングの旅を新たな高みに押し上げるように設計されています。 クォンタム ブレイクアウト インジケーターは、5 つの利益ターゲット ゾーンを備えたブレイクアウト ゾーン上のシグナル矢印と、ブレイクアウト ボックスに基づいたストップロスの提案を提供します。 初心者トレーダーにもプロのトレーダーにも適しています。 量子EAチャネル:       ここをクリック 重要!購入後、インストールマニュアルを受け取るためにプライベートメッセージを送ってください。 推奨事項: 時間枠: M15 通貨ペア: GBPJPY、EURJPY、USDJPY、NZDUSD、XAUUSD アカウントの種類: ECN、Raw、またはスプレッドが非常に低い R
優れたテクニカルインジケーター「Grabber」をご紹介します。これは、すぐに使える「オールインワン」トレーディング戦略として機能します。 ひとつのコードに、市場のテクニカル分析ツール、取引シグナル(矢印)、アラート機能、プッシュ通知が強力に統合されています。 このインジケーターを購入された方には、以下の特典を無料で提供します: Grabberユーティリティ:オープンポジションを自動で管理するツール ステップバイステップのビデオマニュアル:インジケーターのインストール、設定、取引方法を解説 カスタムセットファイル:インジケーターをすばやく自動設定し、最大限の成果を出すための設定ファイル 他の戦略はもう忘れてください!Grabberだけが、あなたを新たなトレードの高みへと導いてくれるのです。 Grabber戦略の主な特徴: 推奨タイムフレーム:M5〜H4 対応通貨ペア・資産:どれでも使用可能ですが、私が実際に検証した以下を推奨します(GBPUSD、GBPCAD、GBPCHF、AUDCAD、AUDUSD、AUDSGD、AUDCHF、NZDUSD、NZDCAD、EURCAD、EURUSD、E
まず正直に言いましょう。 どんなインジケーターも、それ単体であなたを利益化させることはできません。もしそう言う人がいるなら、それは夢を売っているだけです。完璧な売買シグナル(矢印)を表示するインジケーターは、いくらでも“完璧に見せる”ことができます。正しい過去の区間を拡大して、勝ちトレードだけを切り取ればいいだけです。私たちはそれをしません。 SMC Intraday Formula はツールです。 市場構造を読み取り、最も高い確率の価格ゾーンを特定し、今この瞬間のスマートマネーの痕跡をシンプルな言葉で正確に示します。最終判断はあなたが行います。トレードを実行するのもあなたです。しかし今は「希望」ではなく「精度」でエントリーできます。 私たちはこのインジケーターを、ゴールド(XAUUSD)および主要FX通貨ペアで約3年間、日々のスキャルピングに使用してきました。M1、M5、M15、M30の主要ツールです。これは未来を予測しようとするのではなく、今まさに形成されている高確率セットアップを示し、その理由を説明します。 他のすべてのインジケーターと何が違うのか? ほとんどのトレーディングイ
CGE Trading Suite
Carl Gustav Johan Ekstrom
5 (2)
Institutional-Grade Analytics for MT5 C GE Trading Suite delivers the analytical edge typically reserved for professional trading desks. The platform integrates a full suite of analytical tools into one seamless workflow: dynamic grid mapping, liquidity behavior analysis, ECM, trend lines, MIDAS, trade cycles, and directional channel projections. Together, these provide a unified view of market structure and momentum. Directional clarity is further enhanced by the capital flow index, which meas
あなたのシンボルでどの戦略が実際に機能するか確認しましょう - リアルマネーをリスクにさらす前に。 Power Barは、あらゆるシンボルとあらゆるタイムフレームで 極端な価格バー を検出し、3つの異なるトレード戦略を即座にバックテストします。勝率、プロフィットファクター、損益を並べて比較できます。すべてが1つのインタラクティブなパネルに集約されています。 推測なし。カーブフィッティングなし。データだけです。 Power Barが特別な理由 ほとんどのインジケーターはシグナルを出すだけで、それが機能するかどうかは推測に任されます。Power Barはさらに先を行きます - すべてのシグナルを 3つの戦略 に対してテストし、統計を表示します。FlipFlop、Momentum、Reversalをワンクリックで切り替え、数値が即座に変化するのを確認できます。 FlipFlop - 常にポジションを保有。シグナルでエントリーし、反対シグナルでイグジット。当社のリサーチでは、US30、US500、DAXなどのトレンドのあるインデックスで最も効果的です。 Momentum - シグナルの方向に
まず第一に、この取引インジケーターは再描画されず、再描画されず、遅延しないことを強調する価値があります。これにより、手動取引とロボット取引の両方に理想的なものになります。 ユーザーマニュアル:設定、入力、戦略。 アトミックアナリストは、価格の強さとモメンタムを利用して市場でより良いエッジを見つけるためのPA価格アクションインジケーターです。ノイズや誤ったシグナルを除去し、取引ポテンシャルを高めるための高度なフィルターを備えています。複雑なインジケーターの複数のレイヤーを使用して、アトミックアナリストはチャートをスキャンし、複雑な数学的計算をシンプルなシグナルと色に変換します。これにより、どのような初心者トレーダーでも理解して使用し、一貫した取引の決定を行うことができます。 「アトミックアナリスト」は、新規および経験豊富なトレーダー向けにカスタマイズされた包括的な取引ソリューションです。プレミアムインジケーターとトップノッチの機能を1つの取引戦略に組み合わせ、すべてのタイプのトレーダーにとって汎用性のある選択肢にします。 デイリートレーディングとスキャルピング戦略:高速で正確なデイ
トレンド スクリーナー インジケーターでトレンド取引の力を解き放ちます。ファジー ロジックと複数通貨システムを活用した究極のトレンド取引ソリューションです。 ファジー ロジックを活用した革新的なトレンド インジケーターである Trend Screener を使用して、トレンド取引を向上させます。 これは、13 を超えるプレミアム ツールと機能、および 3 つの取引戦略を組み合わせた強力なトレンド追跡インジケーターであり、Metatrader をトレンド アナライザーにする多用途の選択肢となります。 期間限定オファー : トレンド スクリーナー インジケーターは、わずか 100 ドルで生涯ご利用いただけます。 (元の価格 50$ ) (オファー延長) Trend Screener の 100% 非再描画精度の揺るぎない精度を体験して、取引の決定が過去の価格変動の影響を受けないようにしてください。 マルチタイムフレームおよびマルチ通貨機能の多用途性を解放し、比類のない自信を持って外国為替、商品、暗号通貨、インデックスの世界を取引できるようにします。 Trend Screener の包括的な
Meridian Pro
Ottaviano De Cicco
5 (1)
Meridian Pro:MT5用プロフェッショナル・マルチタイムフレーム・トレンドマトリックス 概要 Meridian Pro は Merkava Labs が開発したマルチタイムフレーム・トレンドマトリックスで、方向性の状態、強度、モメンタムの状況、マトリックスの合意をひとつのコンパクトなパネルに集約します。ひとつのアダプティブエンジンがM1からW1まで一貫して適用されます。シンボルごとの調整は不要。インジケーターの積み重ねも不要。すべてのアセットとすべてのタイムフレームをカバーするひとつの構造化された読み取りです。 発売キャンペーン — Meridian Proを USD 99 (導入価格)で入手。通常価格:USD 149 。 1. Meridian Proが他と異なる理由 ひとつのエンジン、バラバラなインジケーターのダッシュボードではない 多くのMTFダッシュボードは、タイムフレームごとに生のインジケーター値を繰り返すだけです。Meridian Proはマトリックス全体でひとつのアダプティブ・トレンドエンジンを使用するため、パネルの各行が同じ構造化フレームワークから導出されます
BTMM State Engine Pro is a MetaTrader 5 indicator for traders who use the Beat The Market Maker approach: Asian session context, kill zone timing, level progression, peak formation detection, and a multi-pair scanner from a single chart. It combines cycle state logic with a built-in scanner dashboard so you do not need the same tool on many charts at once. What it does Draws the Asian session range; session times can follow broker server offset or be set in inputs. Tracks level progression (L
Crystal Heikin Ashi Signals - Professional Trend & Signal Detection Indicator Advanced Heikin Ashi Visualization with Intelligent Signal System for Manual & Automated Trading Final Price: $149 ---------> Price goes up $10 after every 10 sales . Limited slots available — act fast . Overview Crystal Heikin Ashi Signals is a professional-grade MetaTrader 5 indicator that combines pure Heikin Ashi candle visualization with an advanced momentum-shift detection system. Designed for both manual traders
Smart Stop Indicator – チャート上で実現するインテリジェントなストップロス精度 概要 Smart Stop Indicator は、ストップロスを勘や感情ではなく、明確で体系的に設定したいトレーダーのために設計されています。本ツールは、クラシックなプライスアクション(高値更新・安値切り下げ)と最新のブレイクアウト認識ロジックを組み合わせ、次に来るべき論理的なストップレベルを正確に特定します。トレンド相場、レンジ、急速なブレイクアウト局面のいずれであっても、最適な SL ゾーンとその状態(“new”、“broken”、“valid”)をチャート上に直接表示します。さらに今回、SL 距離の %ADR 表示も新たに追加されています。 主な特徴 マーケット構造に基づく自動ストップ配置 • 市場構造とリアルタイムの値動きに基づき、意味のあるストップロスレベルを自動検出します。 スマートなブレイクアウト感知 • 急激な方向転換やブレイクアウトにも柔軟に対応し、早すぎるストップ調整を避けます。 SL %ADR の表示 • ストップロスまでの距離を ADR(Averag
Auto Optimized Parabolic RSI: 高度な3Dモメンタムエンジン ほとんどのリテール向けインジケーターは、市場のボラティリティが変化した瞬間に破綻する静的な入力値に依存しているため、失敗に終わります。Auto Optimized Parabolic RSIは、自らの数学的優位性を継続的に再計算することで「インジケーターの陳腐化」問題を解決し、機関投資家レベルの定量的適応力をMT5ターミナルに直接もたらします。 最大の強み: カスタムインメモリ3D最適化 標準的な自動最適化ツールは、インジケーターの呼び出しで端末に過負荷をかけるため、頻繁にMT5プラットフォームをフリーズさせます。本ツールは、このボトルネックを完全に回避しています。RAMベースのカスタムネイティブ計算機を内蔵した内部エンジンは、チャートを読み込んだりタイムフレームを変更したりするたびに、超高速の3Dグリッド探索を実行します。RSI期間(頻度)、SARステップ(加速度)、SAR最大値(制限速度)を同時にスイープし、プラットフォームを遅延させることなく、数万通りものパラメーターの組み合わせを絶対的なミ
FX Power: 通貨の強弱を分析して、より賢い取引を実現 概要 FX Power は主要通貨と金の実際の強弱をあらゆる市場状況で理解するための必須ツールです。強い通貨を買い、弱い通貨を売ることで、 FX Power は取引の意思決定を簡素化し、高い確率の取引機会を見出します。トレンドを追従する場合でも、極端なデルタ値を使用して反転を予測する場合でも、このツールはあなたの取引スタイルに完全に適応します。ただ取引するだけではなく、 FX Power で賢く取引をしましょう。 1. なぜ FX Power がトレーダーにとって非常に有益なのか 通貨と金のリアルタイム強弱分析 • FX Power は主要通貨と金の相対的な強弱を計算し、マーケットダイナミクスに関する明確な洞察を提供します。 • どの資産がリードしているか、または後れを取っているかを監視して、取引するペアを賢く選びましょう。 マルチタイムフレームの包括的なビュー • 短期、中期、長期のタイムフレームで通貨と金の強弱を追跡し、マーケットトレンドに基づいて取引戦略を調整できます。 • スキャルピングからスイングトレード
Market Structure Order Block Dashboard MT5 は、チャート上でマーケットストラクチャーと主要な価格反応ゾーンを直接読み取りたいトレーダー向けに設計された MT5 インジケーターです。BOS、ChoCH、Order Blocks、Fair Value Gaps (FVG)、Liquidity、Kill Zones、Volume Profile、そして高速分析のためのコンパクトな dashboard を組み合わせています。 このインジケーターは、マーケットストラクチャー、ICT コンセプト、Smart Money コンセプトを意思決定の基準として使うトレーダー向けに作られています。トレンド継続、反転の可能性、価格の不均衡、流動性ターゲット、重要な注目ゾーンを、より構造的に把握するのに役立ちます。 Version 1.19 では重要な機能が追加されました。 Pending BOS / Pending ChoCH detection です。ローソク足が前回の swing を超えてクローズすると、標準的な swing 確認を待たずに、インジケーターが pe
ARICoin is a powerful trading companion designed to generate high-probability entry signals with dynamic TP/SL/DP levels based on volatility. Built-in performance tracking shows win/loss stats, PP1/PP2 hits, and success rates all updated live. Key Features: Buy/Sell signals with adaptive volatility bands Real-time TP/SL/DP levels based on ATR Built-in MA Filter with optional ATR/StdDev volatility Performance stats panel (Success, Profit/Loss, PP1/PP2) Alerts via popup, sound, push, or email Cust
ARIPoint is a powerful trading companion designed to generate high-probability entry signals with dynamic TP/SL/DP levels based on volatility. Built-in performance tracking shows win/loss stats, PP1/PP2 hits, and success rates all updated live. Key Features: Buy/Sell signals with adaptive volatility bands Real-time TP/SL/DP levels based on ATR Built-in MA Filter with optional ATR/StdDev volatility Performance stats panel (Success, Profit/Loss, PP1/PP2) Alerts via popup, sound, push, or email Cu
SignalTech MT5 is a trading system for EURUSD, USDCHF, USDJPY, AUDUSD, NZDUSD, EURJPY, AUDJPY, NZDJPY, CADJPY H2 and H3 Timeframe.  It can generate signals with Buy/Sell Arrows and Pop-Up/Sound Alerts. Each signal has clear Entry and Stop Loss levels, which should be automatically flagged on the chart, as well as potential Targets 1, 2, and 3. The Entry and TP levels are fixed after the trade is taken. The exit level is dynamic. If there are signs of a potential short-term trend reversal, the
MERAVITH SCANNERは、MetaTrader 5用のプロフェッショナルな金融市場インジケーターで、複数の分析ツールを一つの統合システムにまとめています。独自の出来高加重平均価格(VWAP)手法を使用してすべての計算を自動で行い、主観的な解釈を完全に排除します。 このインジケーターは、すべての資産クラス(FX、株式、指数、商品、暗号通貨)およびM1から月足までのすべての時間軸で動作します。基本原理は「価格は出来高に従う」というものです。MERAVITHは機関投資家の出来高が集中するポイントを特定し、その集中から数学的に正確な価格レベルを導き出します。予測や投機は行わず、計算のみを行います。 MERAVITH SCANNERを使用すると、28の主要FX通貨ペアをすべての時間軸でわずか2~3分でスキャンできます。また、任意の市場をスキャンすることも可能です。例えば、約100銘柄の株式を約10分でスキャンできます。 インジケーターは、消耗レベル、均衡線、偏差、統計レベル、およびターゲット予測を算出します。 チャート要素 Origin Point :すべての計算が始まる起点です。イン
Was: $299  Now: $99  Supply Demand uses previous price action to identify potential imbalances between buyers and sellers. The key is to identify the better odds zones, not just the untouched ones. Blahtech Supply Demand indicator delivers functionality previously unavailable on any trading platform. This 4-in-1 indicator not only highlights the higher probability zones using a multi-criteria strength engine, but also combines it with multi-timeframe trend analysis, previously confirmed swings a
作者のその他のプロダクト
Hyper Renko
Rodrigo Matheus da Silva
3.75 (4)
蓮子はタイムレスなチャートです。つまり、期間は考慮されませんが、価格の変化が考慮されるため、チャート上の価格の変化がより明確になります。 ハイパー蓮子はこれを提供する指標です。 設定するには、使用するティックのろうそくのサイズ*のパラメーターを1つだけ使用します。 * tick:アセットの可能な限り小さなバリエーションです。 Hyper Traderインジケーターをお選びいただきありがとうございます。 ウィキペディア: レンコグラフは、変数の値(金融資産の価格など)の経時的な変化が最小限であることを示しています。グラフは、検討中の値(価格など)が特定の最小数量によって変化する場合にのみ時間とともに進みます。たとえば、資産価格のR $ 1の変動を考慮したレンコチャートでは、変動が発生するのにかかった時間と変動に関係なく、その変動が発生した場合にのみ、新しい「レンガ」が描画されます取引されたボリューム。したがって、横軸に時間、縦軸に価格変動をプロットすると、すべての「レンガ」は同じ高さ(同じ価格変動)を持ち、それらの間の間隔は視覚的に同じであるにもかかわらず、時間の変化。
FREE
Hyper Trader
Rodrigo Matheus da Silva
3.95 (61)
This EA is complete,   multi-strategy ,   free ,   Brazilian and translated into English . If you prefer, download the EA in English: https://www.mql5.com/en/market/product/59417 Light box robot , that is, you define the settings, which strategy you will use to operate. More than 5,150 different input / output signals ; More than 362.273148.218.750.000 possibilities   combining up to 5 options of purchase (entry or exit) or sale (entry or exit), that's right, I checked this account! Over 1,0
FREE
Hyper DM
Rodrigo Matheus da Silva
5 (1)
Hyper DM, Moving Distance from Moving Averages is an indicator that allows you to define the distance in points of the upper and lower bands in relation to the moving average in the middle. Its operation is simple, it has configuration parameters of the moving average of the middle and based on it and the defined distance parameters of the upper and lower bands, it is plotted in the graph.
FREE
フィルタ:
8953f8
34
8953f8 2022.04.01 15:19 
 

Parabéns amigo seu indicador é o elemento que faltava em combinação com outros indicadores para bons aproveitamentos!

cachimone
24
cachimone 2021.03.06 01:55 
 

Estou aprendendo a utiliza-lo.

Aleksandr Tamonin
4108
Aleksandr Tamonin 2021.01.24 10:37 
 

ユーザーは評価に対して何もコメントを残しませんでした

レビューに返信