Mercadulls Trade
- インディケータ
- バージョン: 1.66
- アップデート済み: 3 12月 2021
- アクティベーション: 5
The Mercadulls Indicator gives to you many signals types, detecting supports, resistances and accumulation/distribution zones. The indicator constantly checks the graph for direct analysis and the appearance of long trends.
Main characteristics
- No repaint!
- Stop loss and take profit levels are provided by the indicator.
- Suitable for Day Traders, Swing Traders, and Scalpers.
- Optimized algorithm to increase the accuracy of signals.
Technical analysis indicator for all assets available in the market.
Periods:
- M1
- M3
- M5
This indicator does not repaint signs. It gives immediate signal when a new candle opens.
Easy to use.
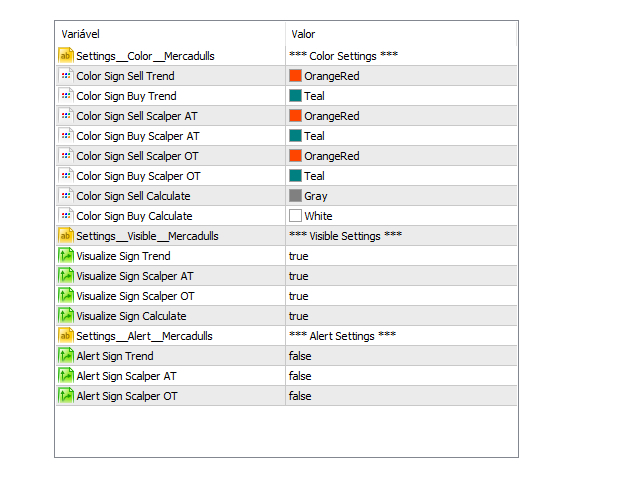
Display Settings
Color
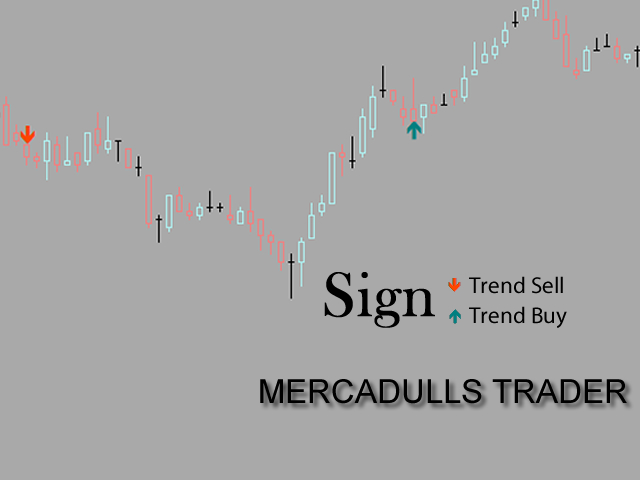
- Color Sign Sell Trend – Sell trend color signal. The default value is OrangeRed.
- Color Sign Buy Trend – Buy trend color signal. The default value is Teal.
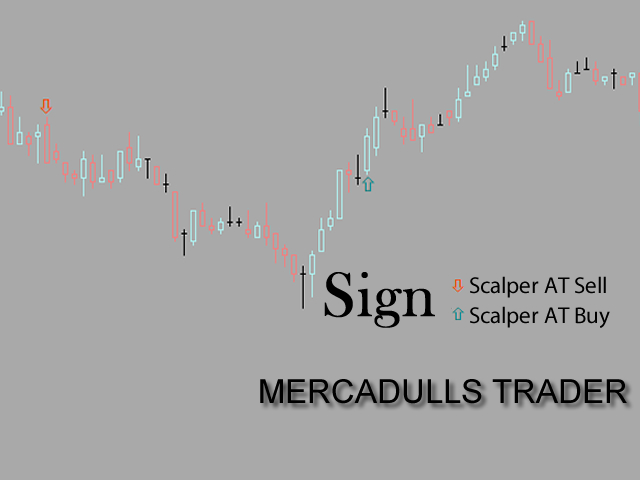
- Color Sign Sell Scalper AT – Sell scalper AT color signal. The default value is OrangeRed.
- Color Sign Buy Scalper AT – Buy scalper AT color signal. The default value is Teal.
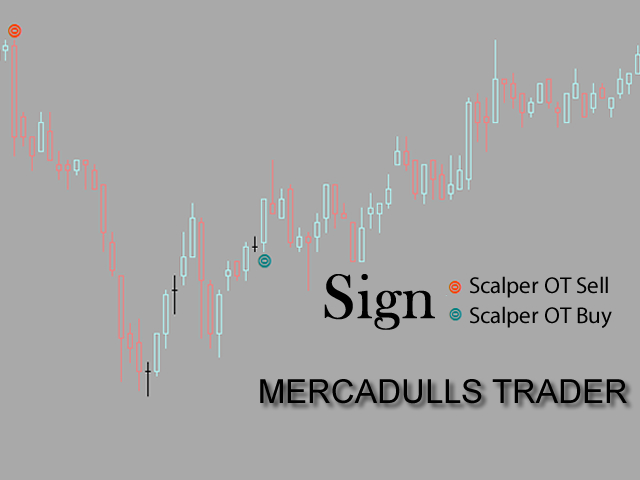
- Color Sign Sell Scalper OT – Sell scalper OT color signal. The default value is OrangeRed.
- Color Sign Buy Scalper OT – Buy scalper OT color signal. The default value is Teal.
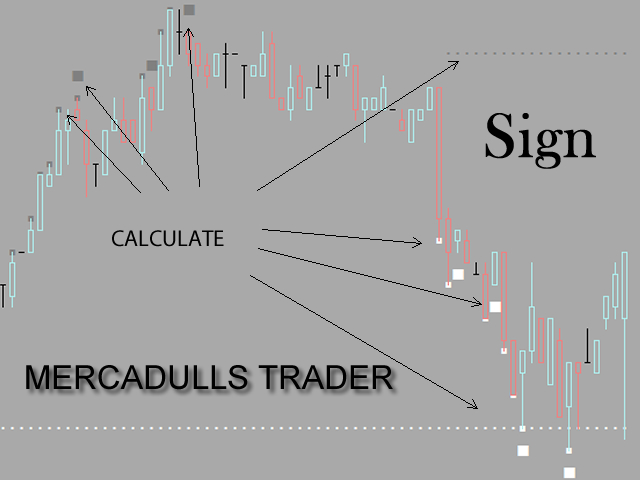
- Color Sign Sell Calculate – Sell calculation color signal. The default value is Gray.
- Color Sign Buy Calculate – Buy calculation color signal. The default value is White.
Visualize Sign
- Visualize Sign Trend – Display the trend signal from the indicator. The default value is true .
- Visualize Sign Scalper AT – V Display the scalper AT signal from the indicator. The default value is true .
- Visualize Sign Scalper OT – Display the scalper OT signal from the indicator. The default value is true.
- Visualize Sign Calculate – Display the calculate signal from the indicator. The default value is true .
Alert Message
- Alert Sign Trend – Alert Message to the indicator trend signal. The default value is false.
- Alert Sign Scalper AT – Alert Message to the indicator scalper AT signal. The default value is false.
- Alert Sign Scalper OT – Alert Message to the indicator scalper OT signal. The default value is false.
Manage your risks, this indicator is only a tool to help you with technical analysis.