Previous Day Fibonacci Retracement
- インディケータ
- バージョン: 2.4
- アップデート済み: 23 5月 2020
- アクティベーション: 5

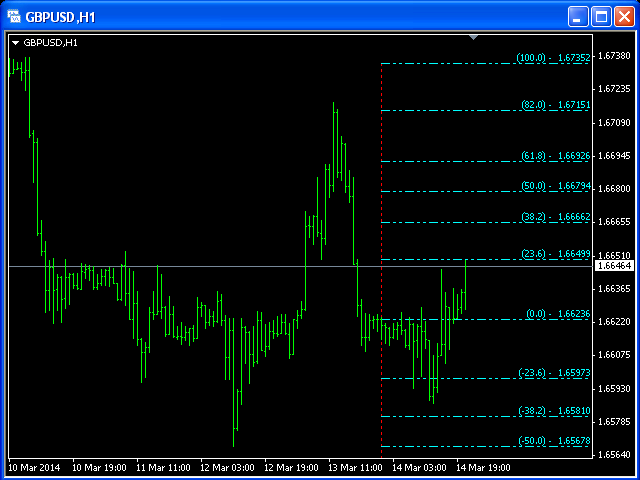
フィボナッチ・レベルは、サポートとレジスタンス・レベルを識別してトレードオフするために金融市場取引で一般的に使用されています。
大幅な価格変動の後で、新しいサポートとレジスタンスレベルは、多くの場合、これらのトレンドラインまたはその近くにあります
フィボナッチラインは、前日の高値/安値を基に構築されています。
参照ポイント-前日の終値。
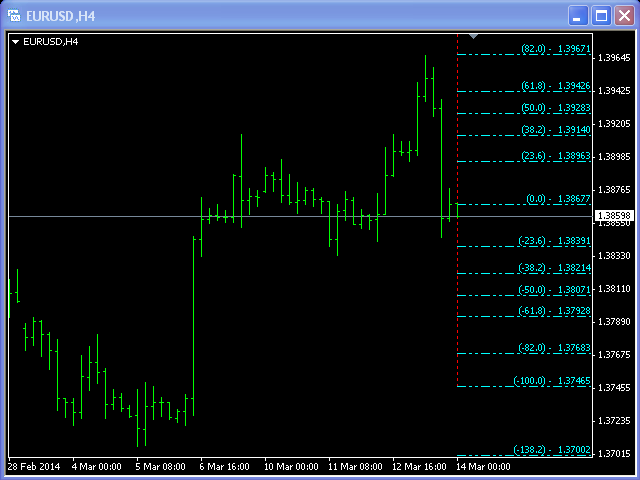
フィボナッチ・レベルは、サポートとレジスタンス・レベルを識別してトレードオフするために金融市場取引で一般的に使用されています。
大幅な価格変動の後で、新しいサポートとレジスタンスレベルは、多くの場合、これらのトレンドラインまたはその近くにあります
フィボナッチラインは、前日の高値/安値を基に構築されています。
参照ポイント-前日の終値。
ユーザーは評価に対して何もコメントを残しませんでした