• 概要
  • レビュー
  • コメント

Absolute Strength Indicator

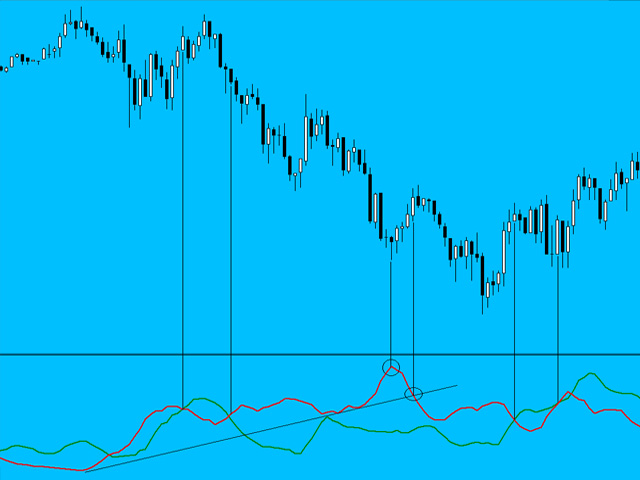
The Absolute Strength (AS) is intended to chart the current and historical gain or loss of an underlying based on the closing prices of a recent trading period. It is based on mathematical  decorrelation. It shows absolute strength momentum.

This indicator is not measured on a scale like Relative Strength (RSI). Shorter or longer timeframes are used for alternately shorter or longer outlooks. Extreme high and low percentage values occur less frequently but indicate stronger momentum of the underlying.


The Indicator can be used for following purposes:

  • Support indicator for technical analysis as combination with Relative Stenght (RSI)
  • information indicator to realize which underlyings are being demanded, this is ideal indicator for trend follow traders
  • help for scalpers looking for strength trend
  • Trader can see both absolute and relative strength
  • Crosspoints can be used for trend continuation or other signals
おすすめのプロダクト
MT4版  |  FAQ Owl Smart Levels Indicator は、 Bill Williams の高度なフラクタル、市場の正しい波構造を構築する Valable ZigZag、エントリの正確なレベルをマークする Fibonacci レベルなどの一般的な市場分析ツールを含む 1 つのインジケーター内の完全な取引システムです。 利益を得るために市場と場所に。 戦略の詳細な説明 インジケータを操作するための指示 顧問-取引助手 プライベートユーザーチャット ->購入後に私に書いて、私はプライベートチャットにあなたを追加し、あなたはそこにすべてのボーナスをダウンロードすることができます 力はシンプルさにあります! Owl Smart Levels 取引システムは非常に使いやすいので、専門家にも、市場を勉強し始めて自分で取引戦略を選択し始めたばかりの人にも適しています。 戦略と指標に秘密の数式や計算方法が隠されているわけではなく、すべての戦略指標は公開されています。 Owl Smart Levels を使用すると、取引を開始するためのシグナルをすばやく確認し、注文を出すため
Note : i only sell this EA on MQL5, any other sellers is fake. Orbit Rage Final, a cutting-edge trading strategy meticulously designed around the bull/bear candle approach and divergence analysis. This powerful tool is engineered to empower you to shape the life you desire. To embark on this transformative journey, simply download and seamlessly integrate it into your MetaTrader 4 platform by placing it in the experts advisors folder. Orbit Rage Final revolutionizes trading by offering a risk-f
Noize Absorption Index - is the manual trading system that measures the difference of pressure between bears forces and bulls forces. Green line - is a noize free index that showing curent situation. Zero value of index shows totally choppy/flat market.Values above zero level shows how powerfull bullish wave is and values below zero measures bearish forces.Up arrow appears on bearish market when it's ready to reverse, dn arrow appears on weak bullish market, as a result of reverse expectation.
プレミアムレベルは、正しい予測の精度が80%を超える独自の指標です。 この指標は、最高のトレーディングスペシャリストによって2か月以上テストされています。 あなたが他のどこにも見つけられない作者の指標! スクリーンショットから、このツールの正確さを自分で確認できます。 1は、1キャンドルの有効期限を持つバイナリーオプションの取引に最適です。 2はすべての通貨ペア、株式、商品、暗号通貨で機能します 手順: 赤い矢印が表示されたらすぐにダウントレードを開き、青い矢印が表示されたら閉じます。青い矢印の後に開くこともできます。 試してテストしてください!推奨設定はデフォルトです! 日足チャートで最高の精度を示します! インディケータは、2600 Pipsの収益性に対して、約10Pipsという非常に小さなマージンを使用します。
このインジケーターは、チャート上のすべての注文 (トランザクション/注文ラインにクローズ) に対して既に設定した TP および SL 値 (その通貨で) を表示し、すべての注文の利益と損失を見積もるのに大いに役立ちます。また、PIP 値も表示されます。表示されている形式は、「利益または損失の通貨値 / PIP 値」です。 TP 値は緑色で表示され、SL 値は赤色で表示されます。 ご質問や詳細については、fxlife.asia@hotmail.com で販売者にお気軽にお問い合わせください。 (そして、近日中にインジケータに追加される次の機能は、「自動または半自動の TP および SL 設定」であり、お客様は無料で更新バージョンを入手できます。よろしくお願いします。) (または、表示に何か機能を追加すべきだと思われる場合は、お気軽にお申し付けください)
How to use Pair Trading Station Pair Trading Station is recommended for H1 time frame and you can use it for any currency pairs. To generate buy and sell signal, follow few steps below to apply Pair Trading Station to your MetaTrader terminal. When you load Pair Trading Station on your chart, Pair Trading station will assess available historical data in your MetaTrader platforms for each currency pair. On your chart, the amount of historical data available will be displayed for each currency pai
Tool for Identifying Potential Reversal Points and Trend Direction This tool is excellent for identifying potential reversal points and trend direction in the market. It works well with confirming indicators such as MACD, Stochastic, RSI - standard indicators available on all MT5 platforms. Together with them, it forms a reliable strategy. In the settings, you can adjust the channel distance and period. It is recommended to enter a trade when the signal line crosses the upper channel bounda
まず第一に、この取引インジケーターは再描画されず、再描画されず、遅延しないことを強調する価値があります。これにより、手動取引とロボット取引の両方に理想的なものになります。 アトミックアナリストは、価格の強さとモメンタムを利用して市場でより良いエッジを見つけるためのPA価格アクションインジケーターです。ノイズや誤ったシグナルを除去し、取引ポテンシャルを高めるための高度なフィルターを備えています。複雑なインジケーターの複数のレイヤーを使用して、アトミックアナリストはチャートをスキャンし、複雑な数学的計算をシンプルなシグナルと色に変換します。これにより、どのような初心者トレーダーでも理解して使用し、一貫した取引の決定を行うことができます。 「アトミックアナリスト」は、新規および経験豊富なトレーダー向けにカスタマイズされた包括的な取引ソリューションです。プレミアムインジケーターとトップノッチの機能を1つの取引戦略に組み合わせ、すべてのタイプのトレーダーにとって汎用性のある選択肢にします。 デイリートレーディングとスキャルピング戦略:高速で正確なデイトレーディングおよび短期トレード
トレンドトレーディング は、タイミングのプルバックとブレイクアウトにより、市場で起こっているトレンドから可能な限り利益を得るように設計された指標です。確立されたトレンドの中で価格が何をしているかを分析することにより、取引の機会を見つけます。 [ インストールガイド | 更新ガイド | トラブルシューティング | よくある質問 | すべての製品 ] 自信を持って効率的に金融市場を取引する むち打ちにならずに確立されたトレンドから利益を得る 収益性の高いプルバック、ブレイクアウト、早期の逆転を認識する この指標は、独自の品質とパフォーマンスを分析します 複数時間枠のダッシュボードを実装します インジケーターは再描画されていません 電子メール/音声/視覚アラートを実装します 確立されたトレンドは多くの取引機会を提供しますが、ほとんどのトレンド指標はそれらを完全に無視しています。インジケーターの解釈はかなり簡単です: (1) トレンドの変化 (2) トレンドの方向への後退 (3) トレンドの方向へのブレイクアウト 赤いダッシュ は下降トレンド中の修正です 青いダッシュ は上昇ト
まず第一に、この取引ツールはノンリペイント、ノンリドロー、ノンラグの指標であり、プロの取引に理想的ですことを強調する価値があります。 スマートプライスアクションコンセプトインジケーターは、新米から経験豊富なトレーダーまで、非常 に強力なツールです。Inner Circle Trader AnalysisやSmart Money Concepts Trading Strategiesなど、20以上の有用な指標を1つに組み合わせています。このインジケーターはスマートマネーコンセプトに焦点を当て、大手機関の取引方法を提供し、彼らの動きを予測するのに役立ちます。 特に、流動性分析に優れており、機関がどのように取引しているかを理解しやすくしています。市場のトレンドを予測し、価格の動きを慎重に分析するのに優れています。機関の戦略とトレードを合わせることで、市場の動向についてより正確な予測ができます。このインジケーターは多目的であり、市場構造を分析し、重要な注文ブロックを特定し、さまざまなパターンを認識するのに優れています。 このインジケーターはBOSやCHoCHなどのパターンの識
インディケータは現在のクオートを作成し、これを過去のものと比較して、これに基づいて価格変動予測を行います。インジケータには、目的の日付にすばやく移動するためのテキスト フィールドがあります。 オプション: シンボル - インジケーターが表示するシンボルの選択; SymbolPeriod - 指標がデータを取る期間の選択; IndicatorColor - インジケータの色; HorisontalShift - 指定されたバー数だけインディケータによって描画されたクオートのシフト; Inverse - true は引用符を逆にします。false - 元のビュー。 ChartVerticalShiftStep - チャートを垂直方向にシフトします (キーボードの上下矢印)。 次は日付を入力できるテキストフィールドの設定で、「Enter」を押すとすぐにジャンプできます。
The Priority Argument indicator algorithm is based on standard indicators as well as its own mathematical calculations. The indicator will help users determine the direction of the trend. It will also become an irreplaceable advisor for entering the market or for closing a position. This indicator is recommended for everyone, both beginners and professionals. How to work: The implementation of the trend indicator is simple - in the form of lines of two colors. We buy when the indicator line
Follow The Line MT5
Oliver Gideon Amofa Appiah
4.42 (31)
This indicator obeys the popular maxim that: "THE TREND IS YOUR FRIEND" It paints a GREEN line for BUY and also paints a RED line for SELL. (you can change the colors). It gives alarms and alerts of all kinds. IT DOES NOT REPAINT and can be used for all currency pairs and timeframes. Yes, as easy and simple as that. Even a newbie can use it to make great and reliable trades. NB: For best results, get my other premium indicators for more powerful and reliable signals. Get them here: https://www.m
FREE
PipFinite Exit EDGE MT5
Karlo Wilson Vendiola
4.89 (35)
Did You Have A Profitable Trade But Suddenly Reversed? In a solid strategy, exiting a trade is equally important as entering. Exit EDGE helps maximize your current trade profit and avoid turning winning trades to losers. Never Miss An Exit Signal Again Monitor all pairs and timeframes in just 1 chart www.mql5.com/en/blogs/post/726558 How To Trade You can close your open trades as soon as you receive a signal Close your Buy orders if you receive an Exit Buy Signal. Close your Sell orde
Elevate Your Trading Experience with Wamek Trend Consult!   Unlock the power of precise market entry with our advanced trading tool designed to identify early and continuation trends. Wamek Trend Consult empowers traders to enter the market at the perfect moment, utilizing potent filters that reduce fake signals, enhancing trade accuracy, and ultimately increasing profitability.   Key Features: 1. Accurate Trend Identification: The Trend Consult indicator employs advanced algorithms and unparall
Promotion $66 lifetime for you. The principle of this indicator is very simple: detecting the trend with Moving Average, then monitoring the return point of graph by using the crossing of Stochastic Oscillator and finally predicting BUY and SELL signal with arrows, alerts and notifications. The parameters are fixed and automatically calculated on each time frame. Example: If you install indicator on EURUSD, timeframe M5: the indicator will detect the main trend with the Moving Average on this
The best time to trade Using this Indicator is when the time reach exactly hour,half,45 minutes,15 minutes and sometimes 5 minutes.. This indicators is helpful to those who trade boom and crash indecies.How to read this indicator first you'll see Blue allow and Red allow all these allows used to indicate or to detect the spike which will happen so the allow happens soon before the spike happen.This indicator works properly only in boom and crash trading thing which you have to consider when
Introducing "X Marks the Spot" – Your Ultimate MetaTrader 5 Indicator for Perfect Trades! Are you tired of the guesswork in trading? Ready to take your MetaTrader 5 experience to a whole new level? Look no further – "X Marks the Spot" is here to revolutionize your trading strategy! What is "X Marks the Spot"? "X Marks the Spot" is not just another indicator – it's your personal trading compass that works seamlessly on all timeframes . Whether you're a beginner or an experienced trader,
The indicator is a trading system for short-term trading. Scalper Assistant helps to determine the direction of the transaction, and also shows the entry and exit points. The indicator draws two lines (possible points for opening positions). At the moment of the breakdown of the upper line up (and when all trading conditions are met), an up arrow appears (a buy signal), as well as 2 goals. At the moment of the breakdown of the lower line down (and when all trading conditions are met), a do
Binary Options Assistant (BOA) Multi Currency Dashboard for Binary Options (MT5) . You can use any of the BOA Signals Indicators with the dashboard. Just change the BOA Signals Indicator Name in the dashboard settings to the indicator you want to get signals from. For example: CHILL. BLAZE:  BOA_BLAZE_Indicator_v1   Strategy :   BLW Online Trading Binary Options Strategy (3 Moving Average) LAVA:  BOA_LAVA_Indicator_v1   Strategy:   Lady Trader Binary Options Strategy (Bollinger Bands & Stoc
KT Renko Patterns scans the Renko chart brick by brick to find some famous chart patterns that are frequently used by traders across the various financial markets. Compared to the time-based charts, patterns based trading is easier and more evident on Renko charts due to their uncluttered appearance. KT Renko Patterns features multiple Renko patterns, and many of these patterns are extensively explained in the book titled Profitable Trading with Renko Charts by Prashant Shah. A 100% automate
DYJ TRADINGVIEWはマルチインジケーターレーティングシステムであり、レーティングシグナルカウントと分析ツールを使用して、グローバル市場への参入機会を見つけます DYJ TRADINGVIEWには、市場分析用の10の組み込みインジケーターがあります。 指標ベースの分析は、多くのトレーダーがどの取引を行うか、どこで取引を開始および終了するかを決定するのに役立つために使用されます。 互いに補完し合うことができるいくつかの異なるタイプを使用します。 あなたの市場をフォローするために私たちを使用してください、あなたはより正確な取引を見つけることができます。 格付けに参加しているトレンド指標には、DYJ POWERSIGNAL、ADX、SMA、ボリンジャーバンドが含まれます。 格付けに参加しているオシレーターには、MACD、RSI、ストキャスティクス、アリゲーターが含まれます。 シグナルの数が3以上のときにシグナルを売買する同じ方向を示す3つのインジケーターがある場合、市場取引を開始します。 Input [GENERAL] ViewName       
Magic Finger can help you identify trends and trading opportunities clearly. The finger points to the open position signal, and the discoloration line is confirmed by the trend. If you are a day trader, you can choose to trade during a period of active trading, referring to the discoloration line as the basis for the next order, finger signal as a filter. If you are a trend trader, you can choose a period above H1, wait for the appearance of the finger signal in the key price area, and enter
- This is the exact conversion from TradingView: "Support/Resistance" By "BarsStallone". - This indicator lets you read the buffers for R/S values. - This is a non-repaint and light processing load indicator. - This is not a multi time frame indicator If you want the multi time frame version you should create a personal order and I deliver two files that you need them both to have the multi time frame indicator running on your system. - The MT4 version of the indicator is not light load from pr
| Fully-automated Smart Money Concept (ICT) inspired trading solution with multi-strategy capabilities | Built by a grid trader >> for grid traders.  This is MT5 version, click  here  for  Blue CARA MT4  (settings and logics are same in both versions)     Real monitoring signal  -->  Cara Gold Intro Blue CARA EA   ('CARA') - short for  C omprehensive  A lgorithmic   R esponsive   A dvisor is a next-gen  multi-currency    multi-timeframe  EA base on the widely known (and perhaps the most popul
PULLBACK HUNTER What is every trader's cherished dream? To see without delay the places where the reversal will happen. This, of course, is from the category of magic, though... nothing is impossible. But for now I've prepared for you an indicator that marks in real time the end of corrections to the current movement or in short - catches pullbacks.What is the main point? Many people practice rebounds when the price moves in the direction of the open position. And they do them on the formation o
The new update makes this indicator a complete tool for studying, analyzing and operating probabilistic patterns. It includes: On-chart Multi-asset percentage monitor. Configurable martingales. Twenty-one pre-configured patterns, including Mhi patterns and C3. An advanced pattern editor to store up to 5 custom patterns. Backtest mode to test results with loss reports. Trend filter. Hit operational filter. Martingale Cycles option. Various types of strategies and alerts. Confluence between patter
To download MT4 version please click here . - This is the exact conversion from TradingView: "Trend Direction Force Index - TDFI [wm]" By "causecelebre". - This indicator uses multiple levels of averaging to detect trend strength. - You can optimize filter low and filter high levels to achieve best results. - You have access to buffers to use in EAs. - This is a light-load processing and non-repaint indicator. - You can message in private chat for further changes you need.
Indicator and Expert Adviser  EA Available in the comments section of this product. Download with Indicator must have indicator installed for EA to work. Mt5 indicator alerts for bollinger band and envelope extremes occurring at the same time. Buy signal alerts occur when A bullish candle has formed below both the lower bollinger band and the lower envelope  Bar must open and close below both these indicators. Sell signal occur when A bear bar is formed above the upper bollinger band and upp
This indicator uses a mathematical calculation algorithm . This algorithm calculates the remainder between the updated model and the actual values and produces the possible progress of the graph on the graph. It is not a super prophet in trading, but it is very good for the trader when entering the market and to analyze it before entering. Applicable for all currencies. Данный индикатор использует алгоритм математических вычислений . Данный алгоритм вычисляет остаток между обновленной моделью и
このプロダクトを購入した人は以下も購入しています
まず第一に、このトレーディングシステムがノンリペイント、ノンリドロー、ノンラグのインジケーターであることを強調する価値がある。これにより、手動取引とロボット取引の両方に理想的なものになっています。 「スマートトレンドトレーディングシステム MT5」は、新規および経験豊富なトレーダー向けにカスタマイズされた包括的なトレーディングソリューションです。10以上のプレミアムインジケーターを組み合わせ、7つ以上の堅実なトレーディング戦略を備えており、多様な市場状況に対応する多目的な選択肢となっています。 トレンドフォロー戦略:トレンドを効果的に乗り越えるための正確なエントリーとストップロス管理を提供します。 リバーサル戦略:潜在的なトレンドの反転を特定し、トレーダーがレンジ相場を活用できるようにします。 スキャルピング戦略:高速で正確なデイトレードおよび短期取引のために設計されています。 安定性:すべてのインジケーターはノンリペイント、ノンリドロー、ノンラグであり、信頼性の高いシグナルを保証します。 カスタマイズ:個々の取引の嗜好に合わせたカスタム戦略をサポートします。7つ以上の戦略と組み合わせ
ご紹介   クォンタム トレンド スナイパー インジケーターは 、トレンド反転を特定して取引する方法を変革する画期的な MQL5 インジケーターです。 13年以上の取引経験を持つ経験豊富なトレーダーのチームによって開発されました。     クォンタムトレンドスナイパーインジケーター   は、非常に高い精度でトレンドの反転を識別する革新的な方法で、あなたのトレーディングの旅を新たな高みに押し上げるように設計されています。 ***Quantum Trend Sniper Indicatorを購入すると、Quantum Breakout Indicatorを無料で入手できます!*** クォンタム ブレイクアウト インジケーターは、トレンドの反転を特定するとアラートを発し、矢印を示し、3 つのテイクプロフィットレベルを提案します。 初心者トレーダーにもプロのトレーダーにも適しています。 量子EAチャネル:       ここをクリック MT4のバージョン:       ここをクリック 推奨事項: 期間:すべての時間枠。最良の結果を得るには、M
FX Volume MT5
Daniel Stein
4.94 (17)
mql5と Telegramの モーニング・ブリーフィングで、詳細とスクリーンショットを含む毎日のマーケット・アップデートをご覧 ください! FX Volumeは、ブローカーの視点から市場のセンチメントをリアルに洞察する、最初で唯一の出来高インジケーターです。 ブローカーのような機関投資家が外国為替市場でどのようなポジションをとっているか、COTレポートよりもはるかに速く、素晴らしい洞察を提供します。 この情報をチャート上で直接見ることは、あなたの取引にとって真のゲームチェンジャーであり、画期的なソリューションです。 以下のようなユニークなマーケットデータ洞察から利益を得てください。 比率は 、通貨のロングポジションとショートポジションの比率をパーセントで表示します。 比率の変化は 、選択した期間内のロング比率とその変化率を表示します。 Volumes Totalは 、通貨の取引量(ロングとショート)の合計をロット単位で表示します。 Volumes Long :全通貨のロングポジションの取引量を表示します。 Volumes(ショート )は、全通貨のショートポジションの取引量を表示
トレンド スクリーナー インジケーターでトレンド取引の力を解き放ちます。ファジー ロジックと複数通貨システムを活用した究極のトレンド取引ソリューションです。 ファジー ロジックを活用した革新的なトレンド インジケーターである Trend Screener を使用して、トレンド取引を向上させます。 これは、13 を超えるプレミアム ツールと機能、および 3 つの取引戦略を組み合わせた強力なトレンド追跡インジケーターであり、Metatrader をトレンド アナライザーにする多用途の選択肢となります。 期間限定オファー : トレンド スクリーナー インジケーターは、わずか 50 ドルで生涯ご利用いただけます。 (元の価格 125$ ) (オファー延長) Trend Screener の 100% 非再描画精度の揺るぎない精度を体験して、取引の決定が過去の価格変動の影響を受けないようにしてください。 マルチタイムフレームおよびマルチ通貨機能の多用途性を解放し、比類のない自信を持って外国為替、商品、暗号通貨、インデックスの世界を取引できるようにします。 Trend Screener の包括的な
mql5と Telegramの モーニング・ブリーフィングで、詳細とスクリーンショットを含む毎日のマーケット・アップデートをご覧 ください! FX Power MT5 NGは 、長年の人気を誇る通貨強度計FX Powerの次世代モデルです。 この次世代ストレングスメーターは何を提供するのでしょうか?初代FXパワーの魅力すべて プラス GOLD/XAUの強さ分析 より正確な計算結果 個別に設定可能な分析期間 カスタマイズ可能な計算上限値により、さらに優れたパフォーマンスを実現 もっと見たい人のための特別なマルチインスタンス設定 すべてのチャートでお好みの色を無限に設定可能 数え切れないほどの通知オプションにより、重要なことを見逃すことはありません。 Windows 11とmacOSのスタイルで角を丸くした新しいデザイン 魔法のように動くインジケーターパネル FXパワーの主な機能 すべての主要通貨の強さの完全な履歴 すべての時間枠における通貨の強さの履歴 すべてのブローカーとチャートで同一の計算結果 100%信頼できるリアルタイム計算 -> リペイントなし ドロップダウン・リストから
現在33%オフ 初心者にもエキスパートトレーダーにも最適なソリューション このインジケーターは独自の機能と新しい公式を多数内蔵しており、ユニークで高品質かつ手頃な取引ツールです。このアップデートでは、2つの時間枠ゾーンを表示できるようになります。より長いTFだけでなく、チャートTFとより長いTF(ネストゾーンを表示)の両方を表示できます。すべてのSupply Demandトレーダーの皆さんのお気に召すはずです。:) 重要情報の公開 Advanced Supply Demandの可能性を最大化するには、 https://www.mql5.com/ja/blogs/post/720245 にアクセスしてください。   エントリーまたはターゲットの正確なトリガーポイントを正確に特定できれば取引がどのように改善されるか想像してみてください。新しい基盤となるアルゴリズムに基づいて構築されているため、買い手と売り手の間の潜在的な不均衡をさらに簡単に特定できます。これは、最も強い需要と供給のゾーンと、過去のパフォーマンス(古いゾーンを表示)がグラフィカルに表現されるためです。これらの機能は、最適
今、147ドル(いくつかの更新後に499ドルに増加します) - 無制限のアカウント(PCSまたはMac) RelicusRoad ユーザー マニュアル + トレーニング ビデオ + プライベート Discord グループへのアクセス + VIP ステータス 市場の新しい見方 RelicusRoad は、外国為替、先物、暗号通貨、株式、および指数の世界で最も強力な取引インジケーターであり、トレーダーに収益を維持するために必要なすべての情報とツールを提供します。初心者から上級者まで、すべてのトレーダーが成功するためのテクニカル分析と取引計画を提供します。これは、将来の市場を予測するのに十分な情報を提供する重要な取引指標です。意味をなさないチャート上のいくつかの異なる指標ではなく、完全な解決策を信じています.これは、信号、矢印 + 価格アクション情報を表示するオールインワンのインジケーターで、他に類を見ない非常に正確です。 強力な AI に基づいて、RelicusRoad は不足している情報とツールを提供して、あなたを教育し、トレーディングのプロ、成功したトレーダーにします。
Step into the realm of Forex trading with confidence and precision using XQ, a cutting-edge Forex indicator designed to elevate your trading game to unprecedented heights. Whether you're a seasoned trader or just stepping into the world of currency exchange, XQ Forex Indicator empowers you with the insights and signals needed to make informed trading decisions. The signal conditions are a combination of three indicators, and XQ Forex Indicator only display  medium and long-term trends . The ind
The Volume by Price Indicator for MetaTrader 5 features Volume Profile and Market Profile TPO (Time Price Opportunity). Get valuable insights out of currencies, equities and commodities data. Gain an edge trading financial markets. Volume and TPO histogram bar and line charts. Volume Footprint charts. TPO letter and block marker charts including split structures. Versatile segmentation and compositing methods. Static, dynamic and flexible ranges with relative and/or absolute visualizations. Lay
Auto Order Block with break of structure based on ICT and Smart Money Concepts Futures Break of Structure ( BoS )             Order block ( OB )            Higher time frame Order block / Point of Interest ( POI )    shown on current chart           Fair value Gap ( FVG ) / Imbalance   ,  MTF      ( Multi Time Frame )    Volume Imbalance     ,  MTF          vIMB Gap’s Equal High / Low’s     ,  MTF             EQH / EQL Liquidity               Current Day High / Low           HOD /
これはMT5のインジケーターで、再描画なしで取引に参入するための正確なシグナルを提供します。 外国為替、暗号通貨、金属、株式、インデックスなど、あらゆる金融資産に適用できます。かなり正確な見積もりを提供し、取引を開始して終了するのに最適な時期を教えてくれます。1つのシグナルを処理しただけでインジケーターの元が取れた例の 動画 (6:22)をご覧ください。Entry PointsPro インジケーターの助けを借りたほとんどのトレーダーの最初の1週間の結果が改善しています。 Telegramグループ に登録してください。Entry Points Proインジケーターのメリットは次の通りです。 再描画のないエントリーシグナル 再描画されるインジケーターでは一度表示されたシグナルが削除されて大きな金銭的損失につながることがありますが、これと異なり、表示されて確認されたシグナルは消えることがありません。 エラーなしの取引開始 インジケーターアルゴリズムによって取引を開始する(資産を売買する)理想的な瞬間を見つけることができます。それを使用するすべてのトレーダーの成功率が向上します。
ICT, SMC, SMART MONEY CONCEPTS, SMART MONEY, Smart Money Concept, Support and Resistance, Trend Analysis, Price Action, Market Structure, Order Blocks, BOS/CHoCH,   Breaker Blocks ,  Momentum Shift,   Supply&Demand Zone/Order Blocks , Strong Imbalance,   HH/LL/HL/LH,    Fair Value Gap, FVG,  Premium  &   Discount   Zones, Fibonacci Retracement, OTE, Buy Side Liquidity, Sell Side Liquidity, BSL/SSL Taken, Equal Highs & Lows, MTF Dashboard, Multiple Time Frame, BigBar, HTF OB, HTF Market Structure
ブレーカートレーダーになり、価格が反転すると市場構造からの利益が変化します。 注文ブロックブレーカーインジケーターは、トレンドまたは価格の動きが枯渇に近づいており、逆転の準備ができていることを識別します。通常、反転または大規模なプルバックが発生しようとしているときに発生する市場構造の変化について警告します。 この指標は、ブレイクアウトと価格の勢いを識別する独自の計算を使用します。使い果たされる可能性のあるポイントの近くで新しい高値が形成されるたびに、インディケーターはその高値の作成を担当する最後の注文ブロックを描きます。次に、移動する価格とともに注文ブロックを追跡します。その後、価格が反対方向にシフトし、その注文ブロックを突破すると、新しい市場構造を作成し、トレンドまたは大きな後退の可能性のある反転の開始を警告します。 注文ブロックは、高値/安値が作成される前の最後の反対色のろうそくであり、価格がこれらの重要な領域を下抜けすると、トレンドの短期的ま​​たは長期的な反転の兆候です。 特徴 重要な枯渇点での市場構造の変化を警告します 価格が使い果たされるレベルに近づくと、
Was: $299  Now: $99   Supply Demand uses previous price action to identify potential imbalances between buyers and sellers. The key is to identify the better odds zones, not just the untouched ones. Blahtech Supply Demand indicator delivers functionality previously unavailable on any trading platform. This 4-in-1 indicator not only highlights the higher probability zones using a multi-criteria strength engine, but also combines it with multi-timeframe trend analysis, previously confirmed swings
Gannスクエアインジケーターは、W.D. Gannによって執筆された「市場予測のための数学的な式」の記事に基づく強力な市場分析ツールです。このツールは、解析に数学的な概念を応用し、Gann理論に基づいています。それは、144、90、52のスクエアや9のスクエアなど、Gannの関連テクニックの要素を取り入れています。さらに、の方法を組み込んでおり、9のスクエアとその関連性についてのチャネルやスターパターンに焦点を当てています。 ユーザーマニュアルと使用方法: このインジケーターを使用する前に、ユーザーマニュアルを読んで疑問点を解決するためにお問い合わせいただくことをお勧めします。ユーザーマニュアルの完全版は、当社のウェブサイトで入手できます。 MT5の完全版は購入できますし、MT4の無料版も試すことができます。両方のバージョンへのリンクを提供していますので、ご利用ください。 主な機能と機能: Gannスクエアインジケーターは、市場分析のための完全なツールセットを提供し、幾何学的な概念とGann理論に基づいて的確な判断を行う手助けをします。以下に主な機能を示します。 9のスクエアの分析:
トレンドラインマップインジケーターは、トレンドスクリーナーインジケーターのアドオンです。トレンドスクリーナー(トレンドラインシグナル)によって生成されたすべてのシグナルのスキャナーとして機能します。 これは、トレンドスクリーナーインジケーターに基づくトレンドラインスキャナーです。 Trend Screener Pro インジケーターがない場合、Trend Line Map Proは機能しません。 It's a Trend Line Scanner based on Trend Screener Indicator. If you don't have Trend Screener Pro Indicator,     the Trend Line Map Pro will not work . ブログにアクセスすると、トレンドラインマップインジケーターの無料バージョンをダウンロードできます。 Metatrader Testerの制限なしで、購入する前に試してみてください。 :  ここをクリック 1.簡単になる利点 通貨と時間枠に基づいて売買シグナルを表示し
TrendLine PRO MT5
Evgenii Aksenov
4.78 (49)
The Trend Line PRO indicator is an independent trading strategy. It shows the trend change, the entry point to the transaction, as well as automatically calculates three levels of Take Profit and Stop Loss protection Trend Line PRO is perfect for all Meta Trader symbols: currencies, metals, cryptocurrencies, stocks and indices Advantages of Trend Line PRO Never redraws its signals The possibility of using it as an independent strategy It has three automatic levels Take Profit and Stop Loss lev
ご紹介     Quantum Breakout PRO は 、ブレイクアウト ゾーンの取引方法を変革する画期的な MQL5 インジケーターです。 13年以上の取引経験を持つ経験豊富なトレーダーのチームによって開発されました。     クォンタム ブレイクアウト プロ   は、革新的でダイナミックなブレイクアウト ゾーン戦略により、あなたのトレーディングの旅を新たな高みに押し上げるように設計されています。 クォンタム ブレイクアウト インジケーターは、5 つの利益ターゲット ゾーンを備えたブレイクアウト ゾーン上のシグナル矢印と、ブレイクアウト ボックスに基づいたストップロスの提案を提供します。 初心者トレーダーにもプロのトレーダーにも適しています。 量子EAチャネル:       ここをクリック 重要!購入後、インストールマニュアルを受け取るためにプライベートメッセージを送ってください。 推奨事項: 時間枠: M15 通貨ペア: GBPJPY、EURJPY、USDJPY、NZDUSD、XAUUSD アカウントの種類: ECN、Raw、またはス
AW Trend Predictor MT5
AW Trading Software Limited
4.76 (54)
1 つのシステムでのトレンド レベルとブレイクダウン レベルの組み合わせ。高度なインジケーター アルゴリズムは、市場のノイズをフィルター処理し、トレンド、エントリー ポイント、および可能なエグジット レベルを決定します。インジケーターシグナルは統計モジュールに記録されるため、最適なツールを選択してシグナル履歴の有効性を示すことができます。この指標は、テイクプロフィットとストップロスのマークを計算します。 マニュアルと説明書 ->   ここ / MT4 バージョン ->   ここ インジケーターで取引する方法: Trend Predictor での取引は、たった 3 つの簡単なステップです。 ステップ 1 - ポジションを開く 70% 以上の成功率で買いシグナルが受信されました ステップ 2 - ストップロスの決定 逆信号でトランクを選択 ステップ 3 - テイクプロフィット戦略の定義 戦略 1: TP1 に到達したらポジション全体をクローズする 戦略 2: TP1 に達した時点でポジションの 50% をクローズし、TP2 に達した時点で残りの 50% をクローズします。 戦略 3:
Gartley Hunter Multi - An indicator for searching for harmonic patterns simultaneously on dozens of trading instruments and on all classic timeframes: (m1, m5, m15, m30, H1, H4, D1, Wk, Mn). Manual (Be sure to read before purchasing) | Version for MT4 Advantages 1. Patterns: Gartley, Butterfly, Shark, Crab. Bat, Alternate Bat, Deep Crab, Cypher 2. Simultaneous search for patterns on dozens of trading instruments and on all classic timeframes 3. Search for patterns of all possible sizes. Fr
Was: $249  Now: $99   Market Profile defines a number of day types that can help the trader to determine market behaviour. A key feature is the Value Area, representing the range of price action where 70% of trading took place. Understanding the Value Area can give traders valuable insight into market direction and establish the higher odds trade. It is an excellent addition to any system you may be using. Inspired by Jim Dalton’s book “Mind Over Markets”, this indicator is designed to suit the
TPSpro TRENDPRO  - is a trend indicator that automatically analyzes the market and provides information about the trend and each of its changes, as well as giving signals for entering trades without redrawing! The indicator uses each candle, analyzing them separately. referring to different impulses - up or down impulse. Exact entry points into transactions for currencies, crypto, metals, stocks, indices!  -  Version MT4                  DETAILED DESCRIPTION        /       TRADING SETUPS       
Golden Spikes Detector This indicator is based on an advanced strategy primarily for trading spikes on Boom and Crash Indices. Complex algorithms were implemented to detect high probability entries only. It alerts on potential Buy and Sell entries. To trade spikes on the Deriv or Binary broker, only take Buy Boom and Sell Cash alerts. It was optimised to be loaded on 5-minute timeframe although multiple timeframe analysis is done in the background. Features ·             Desktop pop up and sound
Matrix Arrow Indicator MT5
Juvenille Emperor Limited
5 (14)
マトリックスアローインジケーターMT5は、すべてのシンボル/商品(外国為替、商品、暗号通貨、インデックス、株式)で使用できる100%再描画されていないマルチタイムフレームインジケーターに続くユニークな10in1トレンドです。マトリックスアローインジケーターMT5は、初期段階で現在のトレンドを判断し、最大10の標準インジケーターから情報とデータを収集します。 平均方向移動指数(ADX) 商品チャネルインデックス(CCI) クラシック平研アシキャンドル 移動平均 移動平均収束発散(MACD) 相対活力指数(RVI) 相対力指数(RSI) 放物線SAR ストキャスティクス ウィリアムズのパーセント範囲 すべてのインジケーターが有効な買いまたは売りシグナルを与えると、対応する矢印がチャートに印刷され、次のろうそく/バーの開始時に強い上昇トレンド/下降トレンドを示します。ユーザーは、使用するインジケーターを選択し、各インジケーターのパラメーターを個別に調整できます。マトリックスアローインジケーターMT5は選択されたインディケーターからのみ情報を収集し、それらのデータのみに基づいてアローを印
IX Powerは 、FX Powerの無敵の精度をついにFX以外のシンボルにも提供します。 お気に入りの指数、株式、コモディティ、ETF、さらには暗号通貨の短期、中期、長期のトレンドの強さを正確に判断します。 お使いの端末が提供する すべてを分析する ことができます。ぜひお試しいただき、取引 タイミングが大幅に改善 されることをご体験ください。 IXパワーの主な特徴 100%正確で再描画されない計算結果 - ターミナルで利用可能なすべての取引シンボルに対して 予め設定され、さらに個別に設定可能な強度分析期間のドロップダウン選択 Eメール、メッセージ、モバイル通知による無数の通知オプション EAリクエストのためのアクセス可能なバッファ カスタマイズ可能な計算制限により、さらに優れたパフォーマンスを実現 もっと見たい人のための特別なマルチインスタンス設定 すべてのチャートでお好みの色を無限に設定可能 Windows 11とmacOSのスタイルで角を丸くした新しいパネルデザイン サブ・ウィンドウとメイン・チャートの間をシームレスに移動する、魔法のように動くイン
Account Graph MT5
Kyra Nickaline Watson-gordon
5 (1)
An indicator to draw a graph of account current and historical state such as Balance, Equity, Margin, Free Margin, Margin Level, Drawdown, Account Profit, Deposit and Withdrawals. Indicator Inputs : Draw Balance Graph Draw Equity Graph Draw Margin Graph Draw Free Margin Graph Draw Margin Level Graph Draw Drawdown Graph Draw Account Profit Graph Hide Data on Chart and Buffers Connect Gaps by Lines Sign of DDs on Profit Sign of DDs on Loss Tips : The Indicator will draw historical balance gra
** All Symbols x All Timeframes scan just by pressing scanner button ** ***Contact me after purchase to send you instructions and add you in "123 scanner group" for sharing or seeing experiences with other users. After 15 years of experience in the markets and 3 years of programming, Winner indicator is ready. I would like to share with you! Introduction The 123 Pattern Scanner indicator with a special enhanced algorithm is a very repetitive common pattern finder with a high success rate . Inte
これは上値と下値を判断するための明確な指標であり、変動する市場に適しています。 キャンペーン価格 49$ → 59$ 特徴 上下の判断がうまい 再描画なし、ドリフトなし 高速計算、ラグなし リッチ リマインダー モード 複数のパラメータと色を調整できます パラメータ 「========メイン========= HighLowPeriod1 = 9 HighLowPeriod2 = 60 HighLowPeriod3 = 34 HighLowEMAPeriod = 4 MASignalPeriod = 5 「========通知========= UseAlertNotify = true; UseMetaQuotesIDNotify = true; UseMailNotify = true; NotifySignalMode = 色を変更し、レベルを確認します。 ハイレベル = 80; 低レベル = 20; NofityPreMessage = "スマート ピーク ボトム"; EA コールの場合 0.ハイバッファー 1.低バッファ 2. 方向バッファ 1 アップ、0、
クリスマスセール!40% OFF!1月1日に価格が$250に値上がり! GoldenGate Entriesをご紹介します:最先端のトレーディングソリューション! GoldenGate Entries(GGE)を使用して取引する革新的なアプローチを発見しましょう。GGEは、取引体験を向上させるために設計された先進的なインジケーターで、ユーザーに正確性と自信を持たせるための包括的な機能を提供します。 通貨ペア:Any(FX - 商品 - 株式 - 株式 - クリプト) タイムフレーム:15分からH1 主な特徴: 買いと売りの矢印の指示:常に情報を受け取るために、買いと売りの矢印の指示をポップアップアラートとともに受け取ります。 GoldenGate_Algo:GoldenGate_Algoを使用して市場の状況を把握し、市場が「売り過ぎ」または「買い過ぎ」かどうかを評価する強力なツールです。 現在のトレンド分析:視聴中のタイムフレームで現在のトレンドにアクセスして、取引を市場の主流方向に合わせることができます。 組み込みのピボットポイント:組み込まれた
QM (Quasimodo) Pattern is based on Read The Market(RTM) concepts. The purpose of this model is to face the big players of the market (financial institutions and banks), As you know in financial markets, big traders try to fool small traders, but RTM prevent traders from getting trapped. This style is formed in terms of price candles and presented according to market supply and demand areas and no price oscillator is used in it. RTM concepts are very suitable for all kinds of investments, includi
作者のその他のプロダクト
VWAP = Volume Weighted Average Price The concept of VWAP is not equal to a normal Moving Average. The VWAP starts always with zero at the beginning of a new day and successively forms an average to the traded volume relative to price. Professional trading firms and institutions use VWAP for a measure of the real weighted trend of an underlying. With the addition of the standard deviation you can spot support and resist at the outer boundaries.
フィルタ:
レビューなし
レビューに返信