MACD Alert Series For MT5
- インディケータ
- バージョン: 206.19
- アクティベーション: 5

The Moving Average Convergence Divergence Indicator (MACD) is both a trend–seeking and momentum indicator which uses several exponential moving averages set to closing prices to generate trading signals.
Product Features
- Sound alert
- Push Notification (Alerts can be sent to your mobile phone)
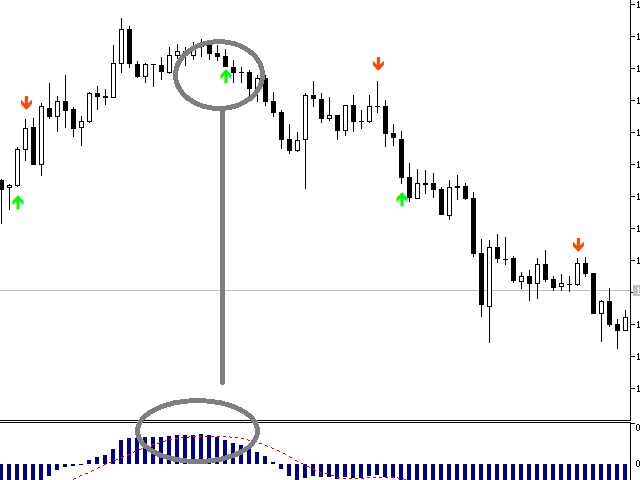
- Signs on chart
- Alert box
- Alert on zero histogram cross or line sign cross.
- DelayCrossFilter
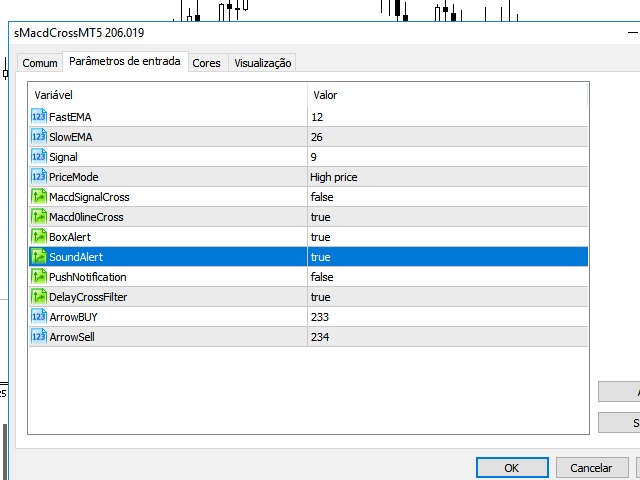
Indicator Parameters
- Fast/Slow/Signal - Sets up the MACD EMA configuration.
- PriceMode - Sets up the Price type to work with.
- MACDSignalCross - Enable alerts on MACD x Signal cross events.
- MACDLine0Cross - Enable alerts on MACD x 0line cross events.
- BoxAlert - Enable simple alert box on events.
- Sound Alert - Enable sound alert on cross or level mode.
- Push Notification - This option enables your MetaTrader 5 to send alerts to your smartphone (IOS or Android).
- DelayCrossFilter - Set the alerts on the next bar to avoid premature crosses. (False alerts filter).
- ArrowCodBuy - Set the MQL Arrow code to buy sign.
- ArrowCodSell - Set the MQL Arrow code to sell sign.