• 概要
  • レビュー (44)
  • コメント (45)
  • 最新情報

Day Bar Info

4.67

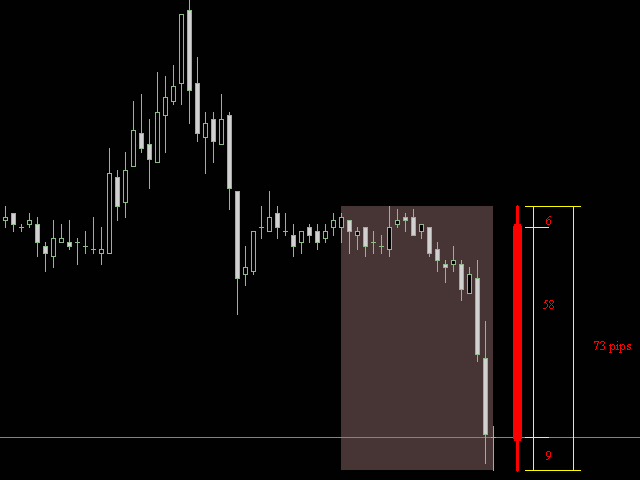
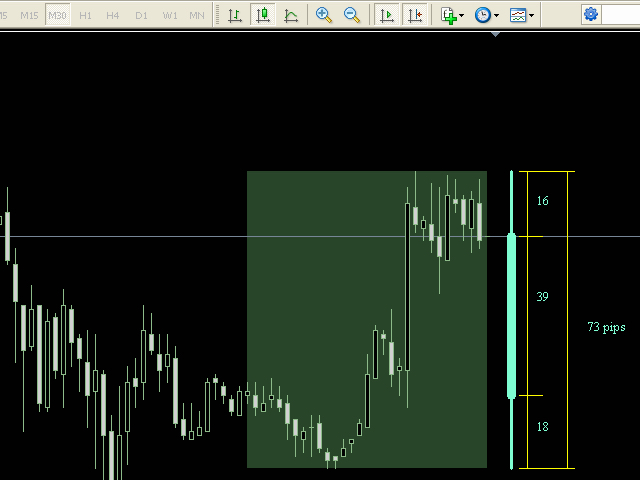
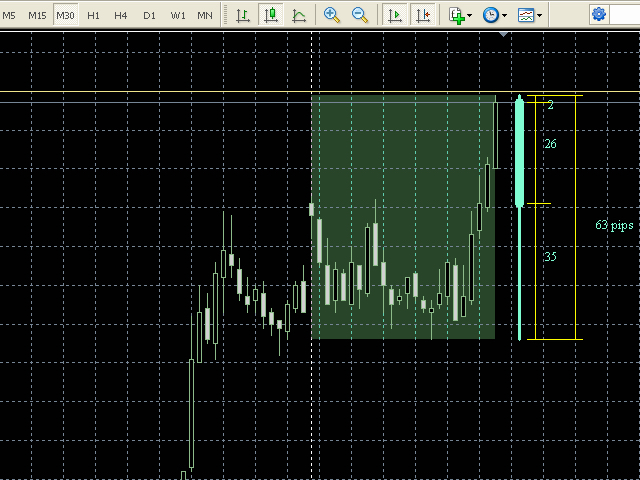
The indicator 'draws' a daily, weekly or monthly candlestick on the current chart.

Shows in points the sizes of the upper and lower shadows, the body and the entire candlestick.

Real time work. Works in the strategy tester.

Indicator parameters:

  • How_much_to_show - how many blocks to show.
  • Block_period - block period (day / week / month)
  • Shift - shift from the edge of the chart in bars.
  • language - language selection.
レビュー 20
Maremmano
36
Maremmano 2023.12.15 13:51 
 

A very helpful and clear tool. I have been using it for years. It would be nice if it were also available for MT5. If the source code were published, I would also be prepared to implement it in MQL5 myself.

33Cristo
15
33Cristo 2023.10.03 03:15 
 

Muy Bueno y Practico, Gracias

6889536
14
6889536 2023.04.11 19:49 
 

very very Good

おすすめのプロダクト
Power Trend Free - the indicator shows the trend strength in the selected period. Input Parameters The indicator has three input parameters: Period - a positive number greater than one, it shows the number of candlesticks used for calculations. If you enter one or zero, there will be no error, but the indicator will not be drawn. Applied Price - the standard "Apply to:" set meaning data used for the indicator calculation: Close - Close prices; Open - Open prices; High - High prices; Low - Low
FREE
Heiken Ashi Button Heiken-Ashi , often spelled Heikin-Ashi, is a Japanese word that means "Average Bar." The Heiken-Ashi approach can be used in conjunction with candlestick charts to spot market trends and forecast future prices. It's useful for making candlestick charts easier to read and analysing patterns. Traders can use Heiken-Ashi charts to determine when to stay in trades while the trend continues and close trades when the trend reverses. The majority of earnings are made when markets a
FREE
Peak Trough Analysis is the great tool to detect peaks and troughs in your chart. Peak Trough Analysis tool can use three different peaks and troughs detection algorithm. The three algorithm include the orignal Fractals Indicator by Bill Williams, the Modified Fractals indicator and ZigZag indicator. You can use this peak and trough analysis tool to detect the price pattern made up from Equilibrium Fractal-Wave process. For further usage, there are good guide line on how to use this peak trough
FREE
チャート上にフィボナッチレベルを手動で描画することにうんざりしていませんか?取引における主要なサポートとレジスタンスのレベルを特定する便利で効率的な方法をお探しですか?これ以上探さない! 自動フィボナッチ レベル を実行する究極の MetaTrader 4 インジケーターである DrawFib Pro の紹介   チャート上に描画し、これらのレベルを突破したときにタイムリーにアラートを提供します。 DrawFib Pro を使用すると、取引戦略を強化し、時間を節約し、より多くの情報に基づいた意思決定を行うことができます。 私のフィボナッチベースのインジケーター:   WH Advanced Gartley Pattern MT4   ||  WH Price Wave Pattern MT4 主な特徴: 自動化   フィボナッチ描画. カスタマイズ可能  パラメータ. 正確な  そして  信頼性のある. リアルタイム   アラート. ユーザー フレンドリー  インターフェース . DrawFib Pro は、チャート上でフィボナッチを自動描画するための効率的で信頼性が高く、使いやすい
FREE
Dual Onset
Dariel Iserne Carrera
4.33 (3)
It is an algorithm to detect trend changes early. You should try multiple values for the Multiplier parameter (1 <value <10 recommended). At first glance you can see effective entries. This is, in fact, one of the rows that Geleg Faktor initially had. But it was removed because it was no longer needed. The other rows were sufficient for G.Faktor's effectiveness, but I still wanted to share this one. Always test before using it on your live account so that you fully understand how it works and
FREE
Ppr PA
Yury Emeliyanov
4 (1)
"Ppr PA" is a unique technical indicator created to identify "PPR" patterns on the currency charts of the MT4 trading platform. These patterns can indicate possible reversals or continuation of the trend, providing traders with valuable signals to enter the market. Features: Automatic PPR Detection:   The indicator automatically identifies and marks PPR patterns with arrows on the chart. Visual Signals:   Green and red arrows indicate the optimal points for buying and selling, respectively. A
FREE
Investment Castle Engulfing MT4
Ahmed Alaaeldin Abdulrahman Ahmed Elherzawi
Whether you are a scalper or daily trader, you will always look for bullish / bearish engulfing candles. This can be a bit tricky and stressful when you try to visually identify the engulfing candles on the chart. Not only that, you might be trading on the M15 time frame but the engulfing candle is forming or has already formed in the H4 time frame. This indicator is made to do that on your behalf. You can trade on any time frame and see Engulfing candles of another time frame, this means that y
FREE
Trend arrow Indicator is an arrow Indicator used as an assistant tool for your trading strategy. The indicator analyzes the standard deviation of bar close for a given period and generates a buy or sell signals if the deviation increases. It good to combo with Martingale EA to follow Trend and Sellect Buy Only/Sell Only for EA work Semi-Automatic. You can use this  Indicator with any EAs in my Products.
FREE
Free automatic Fibonacci is an indicator that automatically plots a Fibonacci retracement based on the number of bars you select on the BarsToScan setting in the indicator. The Fibonacci is automatically updated in real time as new highest and lowest values appears amongst the selected bars. You can select which level values to be displayed in the indicator settings. You can also select the color of the levels thus enabling the trader to be able to attach the indicator several times with differe
FREE
This is a regression tree indicator for MT4/MT5. This indicator classificate nodes on the time period so that the deviation becomes smaller, and displays regression line and channel for each node. It's free! Attached CartDemo.ex4 and CartDemo.ex5 is a Demo version and has the following limitations: Method is RandomForest only Maximum number of bars is 200 Maximum number of trees is 2 Maximum tree depth is 2 Calculated waste lines are shown Not display correlation coefficients Fu
FREE
I make this indicator to help you for setting effective stoploss and getting more signals from following trends. This indicator helps to tell the trends and sideway, when 2 lines stand above of blue cloud, it means uptrend. When 2 lines stand above red cloud, it means down trend, the other else, it means sideway market. For taking order, you have to wait the arrows. You also need to see the cloud position, if the cloud's res, you have to wait the yellow arrow for selling order. If the cloud's bl
FREE
With this system you can spot high-probability trades in direction of strong trends. You can profit from stop hunt moves initiated by the smart money! Important Information How you can maximize the potential of the scanner, please read here: www.mql5.com/en/blogs/post/718109 Please read also the blog about the usage of the indicator: Professional Trading With Strong Momentum This FREE Version of the indicator works only on EURUSD and GBPUSD. The full version of the indicator can be found here:
FREE
PREVIOUS INDICATOR’S DATA MA CROSSOVER https://www.mql5.com/en/users/earobotkk/seller#products P/S: If you like this indicator, please rate it with 5 stars in the review section, this will increase its popularity so that other users will be benefited from using it. This indicator notifies and draws an arrow on the chart whenever    the MA line has crossed over its previous indicator’s data MA filtered by MA Trend.   It also displays total pips gained from all the entry set-ups. Setting ·   You
FREE
The indicator draws two simple moving averages using High and Low prices. The MA_High line is displayed when the moving average is directed downwards. It can be used for setting a stop order for a sell position. The MA_Low line is displayed when the moving average is directed upwards. It can be used for setting a stop order for a buy position. The indicator is used in the TrailingStop Expert Advisor. Parameters Period - period of calculation of the moving average. Deviation - rate of convergence
FREE
PZ Trendlines
PZ TRADING SLU
4.6 (10)
Tired of plotting trendlines? The PZ TrendLines indicator applies a mechanical approach to the construction of trend lines for you!  [ Installation Guide | Update Guide | Troubleshooting | FAQ | All Products ] It can draw up to 18 trendlines Trendlines can be optionally based on fractals Each line represents a breakout level Each trendline can be broken or rejected Configurable amount of lines Configurable colors Support I am happy to provide free products but given my limited time, they come
FREE
Macd Predictor   Macd's main chart indicator If you like this indicator , Dinapoli Levels Expansion and Retracement Demo is a helpful tool: https://www.mql5.com/en/market/product/35884 1. You can determine the price at which the MACD will change from buy to sell, and vice versa. It is the cousin of the oscillator predictor. If you know a position at the time, then the exact price, current and next (future) columns will need to reach the MACD crossover. You can also see how far the market has t
FREE
This indicator has been created for finding the probable reversal points of the symbol price. A small candlestick reversal pattern is used it its operation in conjunction with a filter of extremums. The indicator is not redrawn! If the extremum filter is disabled, the indicator shows all points that have a pattern. If the extremum filter is enabled, the condition works – if the history Previous bars 1 candles back contains higher candles and they are farther than the Previous bars 2 candle, such
FREE
APriceChannel is a modification of the standard Price_Channel indicator. The EA draws 2 levels - the upper level shows the price High for the specified period of time, the lower level shows the price Low for the same period. In addition to the period, you can set vertical offset in points to widen the channel up and down. This prevents false breakouts of current support/resistance levels. Inputs Period - time period in bars - the number of bars to calculate the price High/Low. Offset up and do
FREE
Do you like scalping? Th is indicator displays information about the latest price quotes received from the broker. [ Installation Guide | Update Guide | Troubleshooting | FAQ | All Products ] Identify tick trends easily A blue row means the price has increased A red row means the price has decreased Customizable colors and font sizes Display your desired amount of rows The indicator is non-repainting Parameters Rows: amount of rows with data to display in the chart Font size: font size of th
FREE
Welcome to the world of SMC (Smart Money Concepts) Trading, where we empower traders with the tools and knowledge to make smarter trading decisions. Our latest addition to our suite of trading tools is the SMC Trading Pro indicator, version 1.0. Key Features: Major Market Structure Identification with BODY break. Order Block must be in Major Swing ( not Small Swing ). Order Block with Fair Value Gap Detection. Order Block in Discount | Premium zone. Filter for only Bullish, Bearish or All Order
FREE
TrendPlus
Sivakumar Subbaiya
4.38 (13)
Trend Plus   Trendplus  Indicator   Time Frame: Suitable for any time frame.  Purpose: Trend Prediction. Blue and red candle indicate the buy and sell call respectively. Buy: When the blue candle is formed buy call is initiated. close the buy trades when the next red candle will formed.   Sell: When the Red candle is formed Sell call is initiated. close the Sell trades when the next blue candle will formed.   Happy trade!!
FREE
Opening positions in the direction of the trend is one of the most common trading tactics. This indicator determines the direction of the local movement and colors the candles on the chart in the appropriate color. Allows you to enter the transaction at the very beginning of the movement Thanks to the flexible settings you can use on any currency pairs, metals and cryptocurrency Can be used when working with binary options Distinctive features Does not redraw. Additional parameters for
FREE
Two Period RSI compares long-term and short-term RSI lines, and plots a fill between them for improved visualization. Fill is colored differently according to an uptrend (short period RSI above long period RSI) or a downtrend (short period RSI below long period RSI). Short-term RSI crossing long-term RSI adds a more robust trend confirmation signal than using single period RSI alone. This is a small tool to help visualize and confirm RSI trends. We hope you enjoy! Looking for RSI alerts? You can
FREE
AW Super Trend
AW Trading Software Limited
3 (2)
AW スーパー トレンド - これは、最も人気のある古典的なトレンド インジケーターの 1 つです。シンプルな設定で、トレンドだけでなく、このインジケーターによって計算されるストップ ロス レベルも表示できます。 利点: 楽器:     通貨ペア 、株、商品、指数、暗号通貨。 時間枠: М15 以上。 取引時間:24時間。 現在のトレンドの方向を示します。 ストップロスを計算します。 取引を行うときに使用できます。 3 種類の通知: プッシュ、メール、アラート。 MT5版→   こちら / お知らせ     ->   こちら 機能: - インジケーターは、現在のトレンド方向を対応する色で表示します。 - 青色は、現在の時間枠で使用されているシンボルの上昇トレンドを示します。 - 線の赤い色は、選択したシンボルで使用された時間枠の下降トレンドを示します。 インディケータはストップロスを設定するために使用できます。 指標線はバーの上ではなく、バーに対していくらかシフトして表示されます。トレンド ラインが表示されるこの場所は、トレーダーがストップ ロスを設定するために使用でき
FREE
The   Heikin Ashi indicator   is our version of the Heikin Ashi chart. Unlike competitor products, this indicator offers extensive options for calculating Heikin Ashi candles. In addition, it can be displayed as a classic or smoothed version. The indicator can calculate Heikin Ashi with moving average by four methods: SMA  - Simple Moving Average SMMA  - Smoothed Moving Average EMA  - Exponential Moving Average LWMA  - Linear Weighted Moving Average Main features The indicator shows Heikin
FREE
The Sextet
Naim El Hajj
4.13 (8)
The Sextet  is an MT4 indicator that displays 6 levels of Moving Averages, where the second is the moving average of the first, the third of the second, and so on. It gives a signal when all the moving average levels align in order. Get a Free Sextet EA, and read discussions about using The Sextet Indicator on Forex Factory: The Sextet EA @ Forex Factory Check out the  The Sextet Scalper Pro  for a more elaborate scalping strategy also with  Free EA . Key Features: Is a Moving Average of a Movi
FREE
移動平均は移動中に変化します。 インジケータは、移動平均を計算する期間を自動的に選択します。 動きの方向性が高いほど、平均化期間は長くなります。 トレンドが遅くなると、移動平均の期間が減少し、より速くなります。 これは傾向の変更により速く反応することを可能にする。  この指標は、トレンドまたはトレンド反転ポイントでうまく機能します。 横方向では、速い動きのあるものが遅いものを上に横切るときなど、インジケータは逆の方法で使用することができます-これは売りシグナルです。 または、チャネルを使用しておおよその購入ゾーンまたは販売ゾーンを決定することもできます。 チャンネル表示は、設定で有効にすることができます。  パラメータ: 自動計算のためのバー-このバー数について、インジケータは極端を検出し、最後の極端な時間に応じて移動平均の期間を計算します。 乗数-移動平均の差を設定します。 速度-ある期間から別の期間への移動平均の移行率を変更します。 channel-チャンネル表示を有効または無効にします。 インターフェイスの利便性のために他の設定もあります。 移動
FREE
A personal implementation of the famous Bollinger bands indicator as a trend following mechanism, which uses a moving average and the standard deviation to define what a trend is and when it changes. Bollinger bands are usually used as an oversold/overbought indicator only, but in my opinion, the trading approach is more complete using the trend variant as an exit strategy. [ Installation Guide | Update Guide | Troubleshooting | FAQ | All Products ] Easy to trade Customizable colors and sizes It
FREE
The indicator detects and displays М. Gartley's Butterfly pattern. The pattern is plotted by the extreme values of the ZigZag indicator (included in the resources, no need to install). After detecting the pattern, the indicator notifies of that by the pop-up window, a mobile notification and an email. The pattern and wave parameters are displayed on the screenshots. The default parameters are used for demonstration purposes only in order to increase the amount of detected patterns. Parameters
30 USD
UPD1 X00 Levels
Vitaliy Kuznetsov
4.92 (12)
インディケータはチャート上にラウンドレベルを示します。 それらは、心理的、銀行的、または主要なプレーヤーレベルとも呼ばれます。 これらのレベルでは、強気と弱気の間に真の戦いがあり、多くの注文が蓄積され、ボラティリティの増加につながります。 インジケーターは、任意の楽器と時間枠に自動的に調整されます。 レベル80を突破してテストすると、購入します。レベル20を突破してテストすると、販売されます。ターゲットは00です。 注意。強力なサポートとレジスタンスレベルのため、価格は00レベルをわずかに下回る可能性があります。 入力パラメータ   。 Bars Count - 線の長さ 。 Show 00 Levels - 00レベルを表示するかしないか   。 Show 10, 90 Levels   。 Show 20, 80 Levels   。 Show 30, 70 Levels   。 Show 40, 60 Levels   。 Show 50 Levels   。 N Lines - チャートのレベル数を制限するパラメーター   。 Distance 00 Levels -
FREE
このプロダクトを購入した人は以下も購入しています
Gann Made Easy は、ミスター・ギャンの理論を使用した取引の最良の原則に基づいた、プロフェッショナルで使いやすい外国為替取引システムです。 W・D・ガン。このインジケーターは、ストップロスとテイクプロフィットレベルを含む正確な買いと売りのシグナルを提供します。 PUSH通知を利用して外出先でも取引可能です。 購入後はご連絡ください!私の取引のヒントと素晴らしいボーナスインジケーターを無料で共有します! おそらく、ギャンの取引手法についてはすでに何度も聞いたことがあるでしょう。通常、ギャンの理論は初心者のトレーダーだけでなく、すでにある程度の取引経験がある人にとっても非常に複雑なものです。なぜなら、ギャンの取引手法は理論的にはそれほど簡単に適用できるものではないからです。私はその知識を磨き、最良の原則を私の外国為替インジケーターに組み込むために数年を費やしました。 このインジケーターは非常に簡単に適用できます。必要なのは、それをチャートに添付し、簡単な取引推奨事項に従うだけです。このインジケーターは常に市場分析の仕事を行い、取引の機会を探します。適切なエントリーポイントを検出
65 USD
TrendMaestro
Stefano Frisetti
5 (2)
note: this indicator is for METATRADER4, if you want the version for METATRADER5 this is the link: TRENDMAESTRO recognizes a new TREND in the bud, he never makes mistakes. The certainty of identifying a new TREND is priceless. DESCRIPTION TRENDMAESTRO identifies a new TREND in the bud, this indicator examines the volatility, volumes and momentum to identify the moment in which there is an explosion of one or more of these data and therefore the moment in which prices have strong probability of f
777 USD
現在26%オフ 初心者やエキスパートトレーダーに最適なソリューション! このインジケーターは、独自の機能と新しい計算式を取り入れた、ユニークで高品質、かつ手頃な価格のトレーディングツールです。たった1枚のチャートで28の為替ペアの通貨強度を読み取ることができます。新しいトレンドやスキャルピングチャンスの引き金となるポイントを正確に特定することができるので、あなたのトレードがどのように改善されるか想像してみてください。 ユーザーマニュアルはこちら  https://www.mql5.com/en/blogs/post/697384 これが最初の1本、オリジナルだ! 価値のないクローンを買わないでください。 特別な サブウィンドウの矢印で強い通貨の勢いを表示 GAPがあなたのトレードを導く! 基準通貨や気配値が売られすぎ・買われすぎのゾーン(外相フィボナッチレベル)にあるとき、個別チャートのメインウィンドウに警告表示。 通貨がレンジの外側から反落した場合、プルバック/リバーサルのアラート。 クロスパターンの特別なアラート 複数の時間枠を選択可能で、トレンドを素早く
148 USD
Reversal First Impulse levels (RFI) - are the maximum volume levels/areas that turn the market around, so they play a critical role in future trading decisions. The logic behind the movement of any chart is that the price moves from the first impulse level (RFI) to the first impulse level (RFI) of the past trend. The first impulse level (RFI) is the most powerful level during a trend reversal, which forms a reversal zone. The first impulse level from the reversal of the previous movement is also
145 USD
TPSpro TRENDPRO  - is a trend indicator that automatically analyzes the market and provides information about the trend and each of its changes, as well as giving signals for entering trades without redrawing! The indicator uses each candle, analyzing them separately. referring to different impulses - up or down impulse. Exact entry points into transactions for currencies, crypto, metals, stocks, indices!  - To maximize the potential and learn how to trade using this indicator, read the full des
135 USD
Gold Stuff
Vasiliy Strukov
4.89 (243)
Gold Stuff は、金専用に設計されたトレンド指標であり、あらゆる金融商品にも使用できます。 インジケーターは再描画せず、遅れません。 推奨時間枠 H1. それインディケータでフルオートExpert Advisor EA Gold Stuffが動作します。 あなたは私のプロフィールでそれを見つけることができます. 設定と個人的なボーナスを得るために、購入後すぐに私に連絡してください!   設定 矢印を描く - オンオフ。 チャートに矢印を描く。 アラート - 可聴アラートのオンオフ。 メール通知 - オンオフ。 電子メール通知。 プチ通知 - オンオフ。 プッシュ通知。 次に、色域を調整します。 Gold Stuff は、金専用に設計されたトレンド指標であり、あらゆる金融商品にも使用できます。 インジケーターは再描画せず、遅れません。 推奨時間枠 H1. それインディケータでフルオートExpert Advisor EA Gold Stuffが動作します。 あなたは私のプロフィールでそれを見つけることができます. 設定と個人的なボーナスを得るために、購入後
30 USD
Trend Screener
STE S.S.COMPANY
4.82 (83)
トレンドインジケーター、1つのツールに組み込まれたすべての重要なトレンド機能を備えたトレンドトレーディングとフィルタリングのための画期的なユニークなソリューション! これは、すべてのシンボル/商品(外国為替、商品、暗号通貨、インデックス、株式)で使用できる100%再描画されていないマルチタイムフレームおよびマルチ通貨インジケーターです。 トレンドスクリーナーは、チャート内のドットで矢印トレンドシグナルを提供するインジケーターに続く効率的なインジケーターです。 トレンド分析インジケーターで使用できる機能: 1.トレンドスキャナー。 2.最大利益分析を備えたトレンドライン。 3.トレンド通貨強度メーター。 4.アラート付きのトレンド反転ドット。 5.アラート付きの強いトレンドドット。 6.トレンド矢印 毎日の分析例、毎日のシグナルパフォーマンス...など、トレンドスクリーナーインジケーターを使用して、ここで見つけることができます: ここをクリックしてください 期間限定オファー:トレンドスクリーナーインジケーターは、50ドルと生涯でのみご利用いただけます。 (元の価格125 $) MQ
50 USD
現在20%OFF! 初心者やエキスパートトレーダーのためのベストソリューション! このダッシュボードソフトウェアは、28の通貨ペアで動作しています。それは私達の主要な指標(高度な通貨の強さ28と高度な通貨インパルス)の2に基づいています。それは全体の外国為替市場の大きい概観を与えます。それは、すべての(9)時間枠で28の外国為替ペアのための高度な通貨の強さの値、通貨の動きの速度と信号を示しています。チャート上で1つのインディケータを使用して市場全体を観察し、トレンドやスキャルピングの機会をピンポイントで見つけることができたら、あなたのトレードがどのように改善されるか想像してみてください。 このインディケータには、強い通貨と弱い通貨の識別、潜在的な取引の識別と確認がより簡単になるような機能が搭載されています。このインディケータは、通貨の強さや弱さが増加しているか減少しているか、また、すべての時間枠でどのように機能しているかをグラフィカルに表示します。 新機能として、現在の市場環境の変化に適応するダイナミックなマーケットフィボナッチレベルが追加され、すでに当社のAdvan
199 USD
up-down indicator is no repaint and works all pairs and lower than weekly time frames charts. it is suitable also 1 m charts for all pairs. and hold long way to signal. dont gives too many signals. when red histogram cross trigger line that is up signal.and price probably will down when blue histogram cross trigger line that is down signal.and price probably will go up. when the signals not seen press + button on terminal . too see weekly chart because of low data on chart ,it needs to lower pro
30 USD
Scalper Vault は、スキャルピングを成功させるために必要なすべてを提供するプロフェッショナルなスキャルピング システムです。このインジケーターは、外国為替およびバイナリー オプションのトレーダーが使用できる完全な取引システムです。推奨される時間枠は M5 です。 システムは、トレンドの方向に正確な矢印シグナルを提供します。また、トップとボトムのシグナルとギャン マーケット レベルも提供します。 インジケーターは、プッシュ通知を含むすべてのタイプのアラートを提供します。 インジケータの購入後にご連絡ください。私の個人的な取引の推奨事項と素晴らしいボーナス指標を無料で共有します! 幸せで有益な取引をお祈りします!
65 USD
ご紹介   クォンタム トレンド スナイパー インジケーターは 、トレンド反転を特定して取引する方法を変革する画期的な MQL5 インジケーターです。 13年以上の取引経験を持つ経験豊富なトレーダーのチームによって開発されました。     クォンタムトレンドスナイパーインジケーター   は、非常に高い精度でトレンドの反転を識別する革新的な方法で、あなたのトレーディングの旅を新たな高みに押し上げるように設計されています。 ***Quantum Trend Sniper Indicatorを購入すると、Quantum Breakout Indicatorを無料で入手できます!*** クォンタム ブレイクアウト インジケーターは、トレンドの反転を特定するとアラートを発し、矢印を示し、3 つのテイクプロフィットレベルを提案します。 初心者トレーダーにもプロのトレーダーにも適しています。 量子EAチャネル:       ここをクリック MT5のバージョン:       ここをクリック 推奨事項: 期間: すべての時間枠。最良の結果を得るには、
149.99 USD
Advanced Supply Demand
Bernhard Schweigert
4.92 (309)
現在33%オフ 初心者にもエキスパートトレーダーにも最適なソリューション このインジケーターは独自の機能と新しい公式を多数内蔵しており、ユニークで高品質かつ手頃な取引ツールです。このアップデートでは、2つの時間枠ゾーンを表示できるようになります。より長いTFだけでなく、チャートTFとより長いTF(ネストゾーンを表示)の両方を表示できます。すべてのSupply Demandトレーダーの皆さんのお気に召すはずです。:) 重要情報の公開 Advanced Supply Demandの可能性を最大化するには、 https://www.mql5.com/ja/blogs/post/720245 にアクセスしてください。   エントリーまたはターゲットの正確なトリガーポイントを正確に特定できれば取引がどのように改善されるか想像してみてください。新しい基盤となるアルゴリズムに基づいて構築されているため、買い手と売り手の間の潜在的な不均衡をさらに簡単に特定できます。これは、最も強い需要と供給のゾーンと、過去のパフォーマンス(古いゾーンを表示)がグラフィカルに表現されるためです。これらの機能は、最適
148 USD
ブレーカートレーダーになり、価格が反転すると市場構造からの利益が変化します。 注文ブロックブレーカーインジケーターは、トレンドまたは価格の動きが枯渇に近づいており、逆転の準備ができていることを識別します。通常、反転または大規模なプルバックが発生しようとしているときに発生する市場構造の変化について警告します。 この指標は、ブレイクアウトと価格の勢いを識別する独自の計算を使用します。使い果たされる可能性のあるポイントの近くで新しい高値が形成されるたびに、インディケーターはその高値の作成を担当する最後の注文ブロックを描きます。次に、移動する価格とともに注文ブロックを追跡します。その後、価格が反対方向にシフトし、その注文ブロックを突破すると、新しい市場構造を作成し、トレンドまたは大きな後退の可能性のある反転の開始を警告します。 注文ブロックは、高値/安値が作成される前の最後の反対色のろうそくであり、価格がこれらの重要な領域を下抜けすると、トレンドの短期的ま​​たは長期的な反転の兆候です。 特徴 重要な枯渇点での市場構造の変化を警告します 価格が使い果たされるレベルに近づくと、
49 USD
Description: First of all Its worth emphasizing here that this Trading Tool is Non-Repainting, Non-Redrawing and Non-Lagging Indicator, Which makes it ideal for professional trading and expert advisers. For limited time only 40% OFF, Now 60$  Next price 100$. Attention , the application might not work in the strategy tester,    Try Demo here before you buy:   here . Get a detailed blog, free online course and learn more about the Smart Price Action Concepts  here . Join our Free Group and
60 USD
This is a trend indicator that automatically analyzes the market and provides information about the trend and each of its changes. As well as giving signals for entering trades without redrawing after finished drawing previous candle! I use Rangebar candles in my stategies (important) I created several strategies based on this indicator. You will also create on your trading The indicator uses each candle, analyzing them separately. Referring to different impulses - up or down impulse.
99 USD
ご紹介     Quantum Breakout PRO は 、ブレイクアウト ゾーンの取引方法を変革する画期的な MQL5 インジケーターです。 13年以上の取引経験を持つ経験豊富なトレーダーのチームによって開発された Quantum Breakout PROは 、革新的でダイナミックなブレイクアウトゾーン戦略により、あなたの取引の旅を新たな高みに押し上げるように設計されています。 クォンタム ブレイクアウト インジケーターは、5 つの利益ターゲット ゾーンを備えたブレイクアウト ゾーン上のシグナル矢印と、ブレイクアウト ボックスに基づいたストップロスの提案を提供します。 初心者トレーダーにもプロのトレーダーにも適しています。 量子EAチャネル:       ここをクリック MT5バージョン:   ここをクリック 重要!購入後、インストールマニュアルを受け取るためにプライベートメッセージを送ってください。 推奨事項: 時間枠: M15 通貨ペア: GBPJPY、EURJPY、USDJPY、NZDUSD、XAUUSD アカウントの種類: ECN、Raw、また
149.99 USD
ADR反転インジケーターは、通常の1日の平均レンジに関連して価格が現在取引されている場所を一目で示します。価格が選択した平均範囲とレベルを超えると、ポップアップ、電子メール、またはプッシュを介して即座にアラートを受け取るため、プルバックと逆転にすばやくジャンプできます。インディケータは、チャート上に1日の平均レンジの極値で水平線を描画し、それらを超える価格の数学的確率が付加されているレベルを超える延長も描画します。詳細については、以下をご覧ください... インジケーターとモニターを補完するADRアラートダッシュボードここでも利用可能なすべてのペア:https:// www.mql5.com/en/market/product/62756 MT5バージョンはこちらからも入手できます:https:// www.mql5.com/en/market/product/64477/ 通常の1日平均レンジ(ADR)内で価格が取引され、これらのレベルを上回っている時間の約60%は、通常、その後の引き戻し(利益確定)の動きを伴う急激な価格の動きの指標です。毎日の範囲の上部または下部からの
49 USD
現在31%オフ! 初心者やエキスパートトレーダーに最適なソリューション! このインジケータは、独自の機能と秘密の数式を組み込んだ、ユニークで高品質かつ手頃な価格のトレーディングツールです。たった1枚のチャートで28の通貨ペアのアラートを表示します。新しいトレンドやスキャルピングチャンスの引き金となるポイントを正確に把握することができるので、あなたのトレードがどのように改善されるか想像してみてください! 新しい基本的なアルゴリズムに基づいて構築されているため、潜在的な取引の特定と確認がより簡単になります。これは、通貨の強さや弱さが加速しているかどうかをグラフィカルに表示し、その加速のスピードを測定するためです。加速すると物事は明らかに速く進みますが、これはFX市場でも同じです。つまり、反対方向に加速している通貨をペアにすれば、利益を生む可能性のある取引を特定することができるのです。 通貨の勢いを示す縦の線と矢印は、あなたの取引の指針となるでしょう。 ダイナミックマーケットフィボナッチ23レベルはアラートトリガーとして使用され、市場の動きに適応します。もしインパルスが黄色
88 USD
AW Trend Predictor
AW Trading Software Limited
4.74 (39)
1 つのシステムでのトレンド レベルとブレイクダウン レベルの組み合わせ。高度なインジケーター アルゴリズムは、市場のノイズをフィルター処理し、トレンド、エントリー ポイント、および可能なエグジット レベルを決定します。インジケーターシグナルは統計モジュールに記録されるため、最適なツールを選択してシグナル履歴の有効性を示すことができます。この指標は、テイクプロフィットとストップロスのマークを計算します。 マニュアル・説明書→   こちら / MT5版→   こちら インジケーターで取引する方法: Trend Predictor での取引は、たった 3 つの簡単なステップです。 ステップ 1 - ポジションを開く 70% 以上の成功率で買いシグナルが受信されました ステップ 2 - ストップロスの決定 逆信号でトランクを選択 ステップ 3 - テイクプロフィット戦略の定義 戦略 1: TP1 に到達したらポジション全体をクローズする 戦略 2: TP1 に達した時点でポジションの 50% をクローズし、TP2 に達した時点で残りの 50% をクローズします。 戦略 3: トレンドの反転で
55 USD
TrendLine PRO MT4
Evgenii Aksenov
4.88 (248)
The Trend Line PRO indicator is an independent trading strategy. It shows the trend change, the entry point to the transaction, as well as automatically calculates three levels of Take Profit and Stop Loss protection Trend Line PRO is perfect for all Meta Trader symbols: currencies, metals, cryptocurrencies, stocks and indices Advantages of Trend Line PRO Never redraws its signals The possibility of using it as an independent strategy It has three automatic levels Take Profit and Stop Loss leve
49 USD
このインディケータは、当社の2つの製品 Advanced Currency IMPULSE with ALERT  +   Currency Strength Exotics . のスーパーコンビネーションです。 このインジケーターは全ての時間枠で作動し、8つの主要通貨と1つのシンボルの強弱のインパルスをグラフで表示します。 このインジケータは、金、エキゾチックペア、商品、インデックス、先物など、あらゆるシンボルの通貨強度の加速度を表示することに特化されています。金、銀、原油、DAX、US30、MXN、TRY、CNHなどの通貨強度の加速度(インパルスまたは速度)を表示するために、任意のシンボルを9行目に追加できる、この種の最初のものです。 新しいアルゴリズムに基づいて構築され、潜在的な取引の特定と確認がさらに容易になりました。これは、通貨の強さや弱さが加速しているかどうかをグラフィカルに表示し、その加速の速度を測定するためです。加速すると物事は明らかに速く進みますが、これはFX市場でも同じです。つまり、反対方向に加速している通貨をペアリングすれば、潜在的に利益を生む取
149 USD
indicator is no repaint trend indicator. when red stars up to line that is probably end of long trades. when blue stars up to line that is probably end of down trades. indicator can use all pairs and lower than weekly charts, to use weekly chart need to at least 500 bars data on back.and lowering processing value 500. it is also suitable for 1m charts. indicator hold long way to go. there is not too many signals.
50 USD
Owl smart levels
Sergey Ermolov
4.62 (53)
MT5版  |   FAQ Owl Smart Levels Indicator   は、 Bill Williams   の高度なフラクタル、市場の正しい波構造を構築する Valable ZigZag、エントリの正確なレベルをマークする Fibonacci レベルなどの一般的な市場分析ツールを含む 1 つのインジケーター内の完全な取引システムです。 利益を得るために市場と場所に。 戦略の詳細な説明 インジケータを操作するための指示 顧問-取引助手 プライベートユーザーチャット ->購入後に私に書いて、私はプライベートチャットにあなたを追加し、あなたはそこにすべてのボーナスをダウンロードすることができます 力はシンプルさにあります! Owl Smart Levels   取引システムは非常に使いやすいので、専門家にも、市場を勉強し始めて自分で取引戦略を選択し始めたばかりの人にも適しています。 戦略と指標に秘密の数式や計算方法が隠されているわけではなく、すべての戦略指標は公開されています。 Owl Smart Levels を使用すると、取引を開始するためのシグナルをすばやく確認し、
97 USD
市場の2つの基本原則に基づく日中戦略。 このアルゴリズムは、追加のフィルターを使用したボリュームと価格の波の分析に基づいています。インディケータのインテリジェントアルゴリズムは、2つの市場要因が1つに結合した場合にのみシグナルを出します。インディケータは、より高い時間枠のデータを使用して、M1チャート上の特定の範囲の波を計算します。そして波を確認するために、インジケーターはボリュームによる分析を使用します。 このインディケータはレディトレーディングシステムです。トレーダーが必要とするのは、信号に従うことだけです。また、インジケーターはあなた自身の取引システムの基礎になることができます。取引はミニッツチャートでのみ行われます。 インジケーターがMTFの原則を使用しているという事実にもかかわらず、インジケーターのアルゴリズムは可能な限り安定しています。 購入後、必ず私に書いてください!私の取引設定と推奨事項をあなたと共有します!
65 USD
スイングトレーディング は、トレンドの方向のスイングと可能な反転スイングを検出するように設計された最初のインジケーターです。トレーディングの文献で広く説明されているベースラインスイングトレーディングアプローチを使用します。インディケータは、いくつかの価格と時間のベクトルを調査して、全体的なトレンドの方向を追跡し、市場が売られ過ぎまたは買われ過ぎて修正の準備ができている状況を検出します。 [ インストールガイド | 更新ガイド | トラブルシューティング | よくある質問 | すべての製品 ] むち打ちを起こさずに市場スイングの利益 インジケーターは常にトレンドの方向を表示します 色付きの価格帯は機会のベースラインを表します 色付きのダッシュは、可能な反転スイングを表します この指標は、独自の品質とパフォーマンスを分析します 複数時間枠のダッシュボードを実装します カスタマイズ可能なトレンドおよびスイング期間 電子メール/サウンド/プッシュアラートを実装します インジケータは再描画またはバックペインティングではありません Swing Tradingとは Swing Tradi
249 USD
GET 10% OFF NOW! An exclusive indicator that utilizes an innovative algorithm to swiftly and accurately determine the market trend. The indicator automatically calculates opening, closing, and profit levels, providing detailed trading statistics. With these features, you can choose the most appropriate trading instrument for the current market conditions. Additionally, you can easily integrate your own arrow indicators into Scalper Inside Pro to quickly evaluate their statistics and profitabilit
119 USD
通貨強さウィザードは、取引を成功させるためのオールインワン ソリューションを提供する非常に強力な指標です。このインジケーターは、複数の時間枠のすべての通貨のデータを使用して、このまたはその外国為替ペアのパワーを計算します。このデータは、使いやすい通貨インデックスと通貨パワーラインの形式で表され、特定の通貨のパワーを確認するために使用できます。 必要なのは、取引したいチャートにインジケーターを接続することだけです。インジケーターは、取引する通貨の実際の強さを示します。このインジケーターは、トレンドに合わせて取引するときに有利に利用できる売買高の圧力の極値も示します。このインジケーターには、フィボナッチに基づく可能なターゲットも表示されます。 このインジケーターは、PUSH 通知を含むあらゆるタイプのアラートを提供します。 購入後ご連絡下さい。私の取引のヒントをあなたと共有し、素晴らしいボーナスインジケーターを無料で提供します! 幸せで有益な取引をお祈りします。
65 USD
支持線と抵抗線、そしてローソク足のギャップをチャート上に自動的に表示するため、価格が次に向かう可能性のある場所や反転する可能性のある場所を確認することができます。 このインジケーターは、私のウェブサイト(The Market Structure Trader)で教えているポジショントレード手法の一部として使用するように設計されており、ターゲットとエントリーの可能性のための重要な情報を表示します。 このインジケーターには、2つのコア機能と4つの追加機能があります: コア機能1 - 日足、週足、月足のサポートラインとレジスタンスラインの自動表示 このインジケーターは、直近2日間、最大6週間前、数ヶ月前のサポートレベルとレジスタンスレベルを自動的に引き込みます。これらのレベルの見た目は完全にカスタマイズすることができ、いくつ表示されるかを表示することもできます。これらの重要な水準は、しばしば主要な支持線と抵抗線として機能し、価格が転換して引き戻されたり反転したりする場所です。また、価格が向かうターゲットでもあるため、価格が転換する前に、取引に利用できる潜在的な距離を素早く確認するこ
49 USD
BUY INDICATOR AND GET EA FOR FREE AS A BONUS + SOME OTHER GIFTS! ITALO LEVELS INDICATOR  is the best levels indicator ever created, and why is that? Using high volume zones on the market and Fibonacci the Indicator works on all time-frames and assets, indicator built after 7 years of experience on forex and many other markets. You know many levels indicators around the internet are not complete, does not help, and it's difficult to trade, but the   Italo Levels Indicator is different , the Ital
65 USD
mql5と Telegramの モーニング・ブリーフィングで、詳細とスクリーンショットを含む毎日のマーケット・アップデートをご覧 ください! FX Power MT4 NGは 、長年の人気を誇る通貨強度計FX Powerの次世代モデルです。 この次世代ストレングスメーターは何を提供するのでしょうか?初代FXパワーの魅力すべて プラス GOLD/XAUの強さ分析 より正確な計算結果 個別に設定可能な分析期間 カスタマイズ可能な計算上限値により、さらに優れたパフォーマンスを実現 もっと見たい人のための特別なマルチインスタンス設定 すべてのチャートでお好みの色を無限に設定可能 数え切れないほどの通知オプションにより、重要なことを見逃すことはありません。 Windows 11とmacOSのスタイルで角を丸くした新しいデザイン 魔法のように動くインジケーターパネル FXパワーの主な機能 すべての主要通貨の強さの完全な履歴 すべての時間枠における通貨の強さの履歴 すべてのブローカーとチャートで同一の計算結果 100%信頼できるリアルタイム計算 -> リペイントなし ドロップダウン・リストから
149 USD
フィルタ:
proffesionaled
14
proffesionaled 2024.02.23 11:37 
 

Thanks

Frika
131
Frika 2024.02.14 20:17 
 

Hi, I was using the daily bar with a TradingPanel EA which was flickering permanently because of the geen or red backround rectangle. I don´t know what the dailyBar is doing? Maybe too much refresh screen...? Greets

Maremmano
36
Maremmano 2023.12.15 13:51 
 

A very helpful and clear tool. I have been using it for years. It would be nice if it were also available for MT5. If the source code were published, I would also be prepared to implement it in MQL5 myself.

33Cristo
15
33Cristo 2023.10.03 03:15 
 

Muy Bueno y Practico, Gracias

6889536
14
6889536 2023.04.11 19:49 
 

very very Good

mjb_javad
24
mjb_javad 2022.11.20 12:30 
 

awesome and very useful. could you please make it for mt5 too? or at least sharing the source code or mq4 file so we can convert it to mq5 for mt5 usage? thank you.

Lemilian
17
Lemilian 2022.08.24 16:29 
 

Tem pra MT5?

John Winsome Munar
3471
John Winsome Munar 2022.06.16 00:57 
 

SImple but it works

HECTOR300 Rojas
40
HECTOR300 Rojas 2022.06.10 23:42 
 

es util

VL0815
34
VL0815 2022.04.29 07:22 
 

nice work!!!

5500814
14
5500814 2022.03.26 12:26 
 

Buen indicador, lo recomiendo.

rowin05082011
14
rowin05082011 2022.01.13 03:45 
 

Doesn't load with me. Do you have steps to insert in the chart.

Yud4c3nt3r
14
Yud4c3nt3r 2022.01.12 13:52 
 

i want to MT5.please

Andreas Finger
18
Andreas Finger 2021.10.28 19:41 
 

2021.10.28 19:39:41.493 Day Bar Info USDCAD,H1: global initialization failed Doesn't work

Ivan Cabrera
98
Ivan Cabrera 2021.10.23 01:47 
 

EXCELENTE INDICADOR , EVITAS ESTAR CAMBIANDO A TEMPORALIDAD DIARIA

RainerFoerster
14
RainerFoerster 2021.09.10 18:31 
 

Ein sehr guter Indikator, der auf allen Zeitebenen eingesetzt werden kann. Er zeigt mit genau die Richtung, in die hier handeln kann. Danke darfür

ltyub
27
ltyub 2021.08.30 02:41 
 

ЭТО ОЧЕНЬ МОШНЫЙ ИНДИКАТОР СПАСИБО

Sarizan Bin Ismail
63
Sarizan Bin Ismail 2021.07.02 02:07 
 

Still trying to figure out! Try an error at this point, but overall its a good tool to have. Its give you an idea of what is a pip flow for that day. I'm still in a midst of making adjustment. :) Thank you!

Wolf1979
195
Wolf1979 2021.06.02 16:50 
 

Very Good

RK99
2737
RK99 2021.01.28 07:37 
 

It's one of the best tool in MQL and it's free. thank you !!!

123
レビューに返信
バージョン 1.7 2020.12.24
Стало возможным менять период "свечи" с дневного на недельный и месячный.
バージョン 1.3 2014.10.30
Added ability to choose custom color scheme.