Sessions PRO MT5
- インディケータ
- バージョン: 1.8
- アップデート済み: 31 7月 2020
- アクティベーション: 5

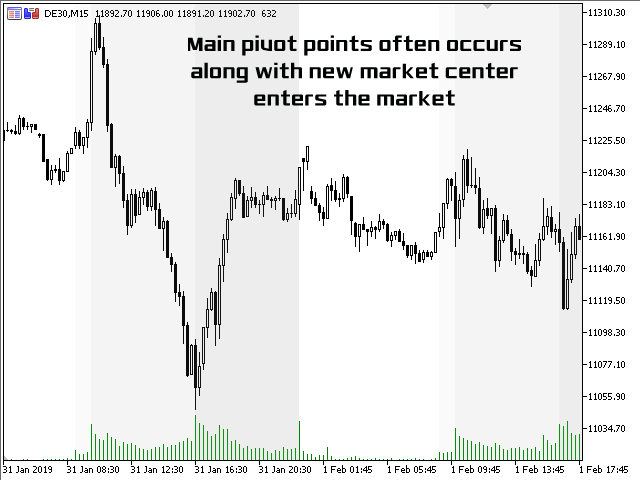
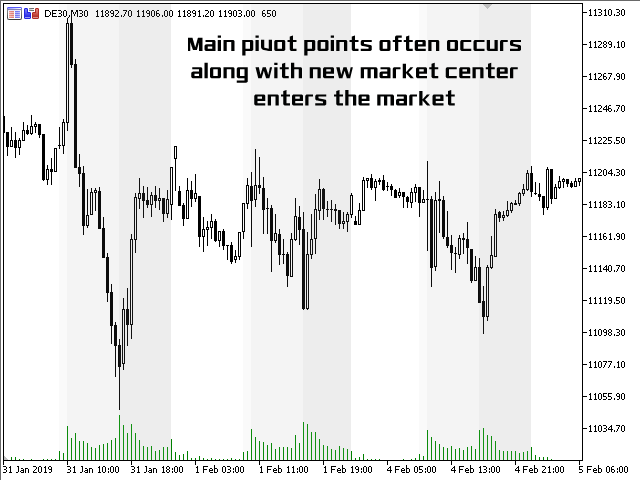
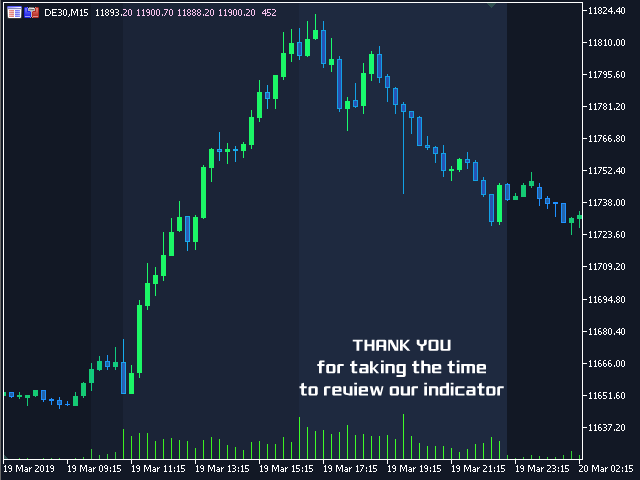
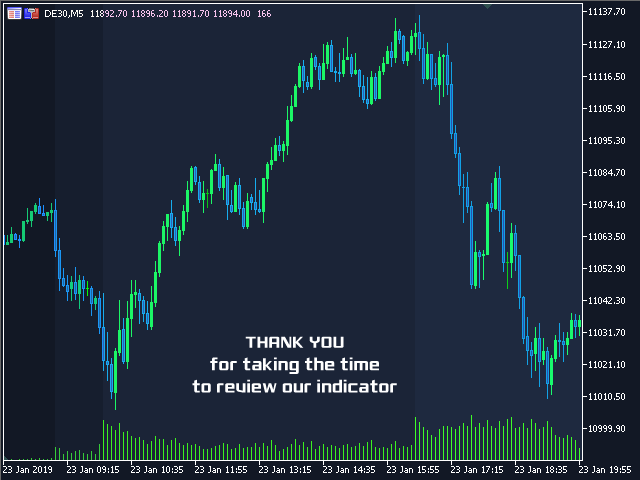
Sessions PRO is a perfect tool which divide your chart screen by 3 main market sessions:
1> asian
2> european (with division for Frankfurt and London start)
3> american
Sessions PRO is perfect especially for trading indices, where main pivot points often occurs along with new market center enters the market.
With Sessions PRO you see what events happened at their exact corresponding time - European and American moves and pivot points are much more important than asian. Stop analyzing your charts blindly and equip yourself with the right tool.
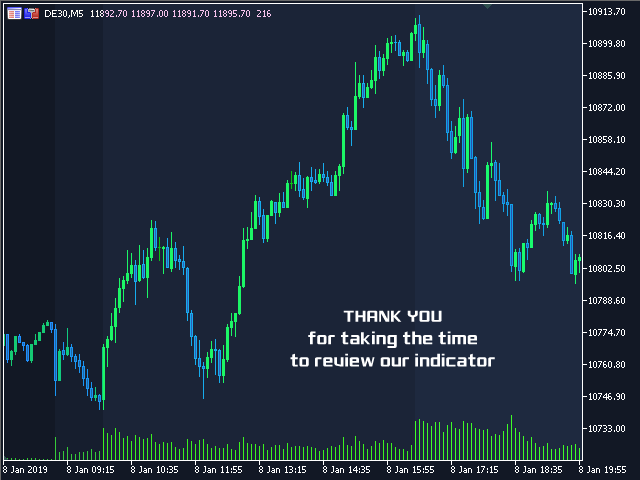
With Sessions PRO you are instantly made aware of the timeframe you are at, as well as the entire picture of the market.
After using Sessions PRO you will be wondering how you were ever able to work without it. *Sessions PRO will positively impact your analysis and trades.*
Just try it, you’ll love it!
SESSIONS PRO can be initialized only during live market session.
Only after proper init you will be able to use it during closed market as well.
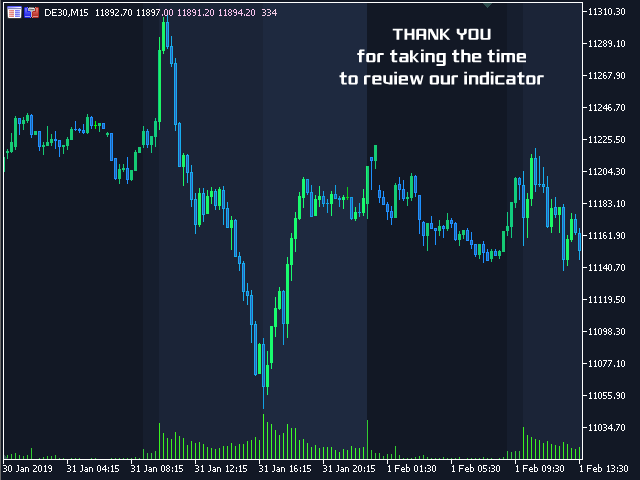
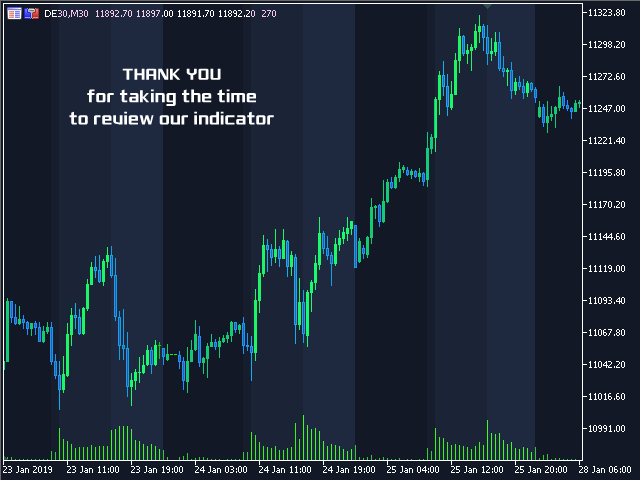
THANK YOU for taking the time to review our indicator
Advantages
- High accuracy of signals.
- Enormous analysis improvements.
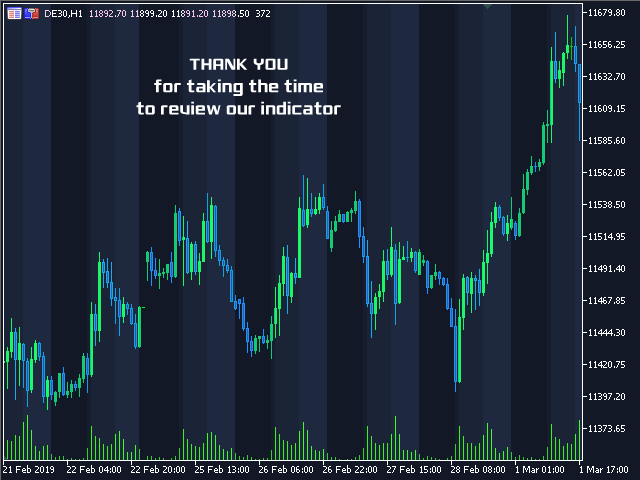
- Perfect for scalping and intraday trading.
- Perfect for backtesting.
- Simple indicator setup, minimum parameters.
- Works on any financial instruments and markets.
Parameters
- coloring - AUTOMATIC - colors of sessions are calculated based on your chart background color | USER_DEFINED - session colors can be chosen by the user
- frankfurt_session_color - user defined Frankfurt session color
- london_session_color - user defined London session color
- newyork_session_color - user defined New York session color
THANK YOU for taking the time to review our indicator
CHECK ALSO OUR PINBAR SCANNER INDICATOR
IT IS AT LIMITED TIME FREE PROMO OFFER RIGHT NOW
FOLLOW US ON TWITTER (we often give away our pro tools for free).
https://twitter.com/_MT_KING_


Perfect Indicator, this one had a small problem but the developer fixed it with a high level of professionalism Thank you