Kisselyovs Stochastic

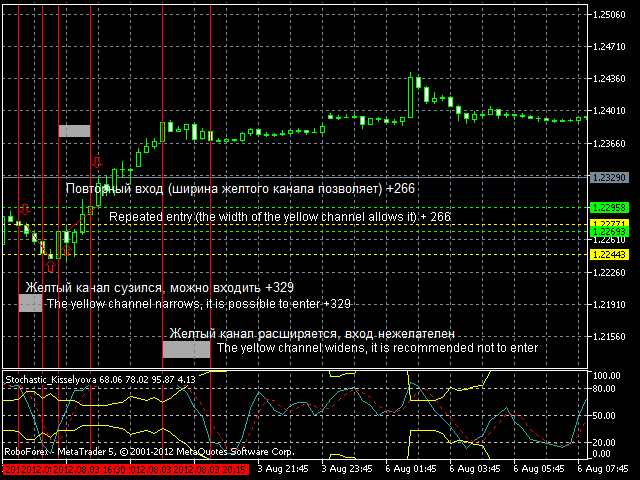
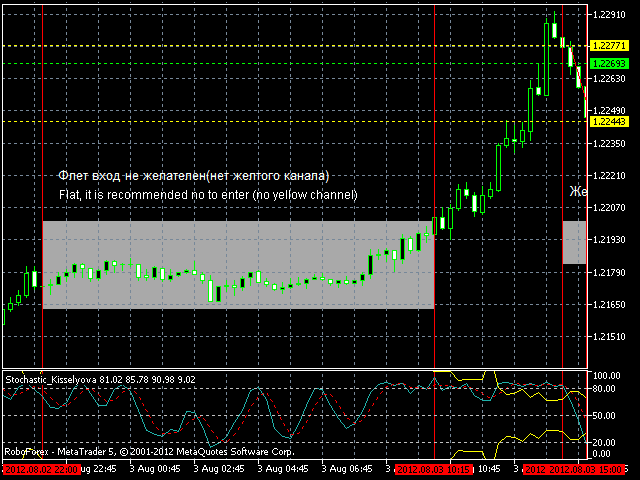
This version of Stochastic evaluates the probability of taking the specified profit in points. The appropriate value is set in the parameters, and the product automatically shows possible options for the market it is currently applied to. There are much more options and the information is more extensive compared to conventional Stochastic (see the screenshots).

Signals:

  1. The yellow channel is absent (flat movement, market entry is not recommended).
  2. The yellow channel is narrowing (trend is forming).
  3. The yellow channel is widening (the market is slowing down, volatility is dropping).

You can enter the market at several conditions, for example:

  1. The yellow channel is narrowing, the main line is crossing the channel to the outside (the market volatility is growing).
  2. The yellow channel remains unchanged, the main line is crossing it inwardly.
  3. The yellow channel is narrower than 20-80 lines, the main line is crossing the level 80 (20) inwardly.

The market entry based either on the main line or on the crossing of the main line and the yellow channel is performed at trader's discretion.

Indicator settings in order of their appearance:

  • K period - period in bars to calculate the indicator values for each bar.
  • D period - period of signal line smoothing, in bars.
  • Slowing - period of main line smoothing, in bars.
  • Profit - target profit in points.
おすすめのプロダクト
Strength Candles
Luis Paulo Rodrigues Pastor
Indicator in histogram format, which is calculated using data on financial volume, tick volume and the body of the bar. It is possible to visualize moments where there was a large entry of volume, both financial and in ticks, and that the market managed to progress and advance in one direction (up or down) due to the size of the bar body, which is where there really was a victory for one side of the negotiation (buyers and sellers). By default, all bars in the indicator's histogram are colore
!! FLASH SALE !!   Over 80% off !!     For ONE week only. Now only $47 - normally $297! >>>      Ends on 30 June 2023 - Don't miss it! Buy And Sell Signal Arrows On The Chart When The Price Is About To Reverse. Also Sends Alerts –On MT5 To Your Phone To Your Email. Does not repaint. Works on any pair, any timeframe.   (Just ajust the settings for your pair and timeframe.) 10 Activations allowed so you are free from limitations MT4 version here .   Spreads from 0.1pip RAW/ECN Accounts,   c
The Market Heart indicator scans market entries after high volatility is noticed. Most big moves occur a short time after market volatility.  Most big moves occur a short time after market volatility. The idea is to look for entries after the rectangles form and not necessarily as trade entry signals. . For example, you could use the  Retracement Feeder   indicator that generates arrow signals. Market Heart MT4  Version How to use:  1.    Primary use The White Box is the first to be formed an
RSI Dashboard PRO is a multi-symbol, multi-timeframe RSI monitoring indicator designed to help traders analyze Relative Strength Index values efficiently within a single panel. The indicator displays real-time RSI readings for selected symbols and timeframes, using a clear color scheme to highlight overbought, oversold, and neutral conditions. This allows users to quickly compare market states and identify areas of interest without switching charts. RSI Dashboard PRO includes interactive contro
!! FLASH SALE !!   Over 80% off !!     For ONE week only. Now only $47 - normally $297! >>>      Ends on 30 June 2023 - Don't miss it! Buy and Sell Arrows On The Chart According To Price Action Sends Alerts On MT5 To Your Phone To You Email Does NOT repaint. Works on any pair, any timeframe.     10 Activations allowed so you are free from limitations. MT4 Version here . For spreads from a tiny 0.1 pips RAW/ECN Accounts,  click here . Check out my Waka Esque EA signal here: >>   High Risk Se
Индикатор для отображения свеч размером меньше одной минуты, вплоть до размера в одну секунду, для детализированного просмотра графика . Имеется ряд необходимых настроек для удобной визуализации. Настройка размера хранения истории ценовых данных транслируемых инструментов. Размер видимых свеч. Настройка отображения неподвижности на курсах графика. Возможность отображения на различных торговых инструментах.  Удачной всем торговли.
Why the RSI Alert Indicator is Essential for Your Trading Toolkit In the fast-paced world of trading, timely and accurate information is crucial. The RSI Alert Indicator is a powerful tool designed to help you stay ahead of the market by providing real-time alerts when the Relative Strength Index (RSI) reaches critical levels. Whether you're a novice trader or a seasoned professional, this indicator can significantly enhance your trading strategy by pinpointing potential market reversals with
Symbol Changer Indicator This is a simple yet intuitive indicator.  The indicator provide easy navigation across various symbols and across different time frames all in a chart. The buttons are displayed on the main chart. It is flexible and easy to use with fast response speed. FEATURES         Use Custom Pairs : If set to true, load all the available symbols in the Market Watch. No means it loads the pairs selected below.     Pairs (Separated by Comma) : This enables selected pairs
The professional browser of News and Trading Sessions is now available in MetaTrader 5. Now all the most important market information is collected on one dial! News located on the Time scale. Planning your working time has never been so easy and convenient ... The news scale can be switched a day, two, a week, a month forward or backward (see the details in the short video). All news updates in real time. Thanks to the built-in filters, you can configure the display of news by importance, cou
This indicator shows external bars ("Aussenstäbe") in the chart in candle form. The colors of the candles can be set individually. Also different colors for bearish and bullish bars are possible. In addition, the color of the wicks or outlines is also adjustable. Outside bars are mentioned e.g. by Michael Voigt in the book "Das große Buch der Markttechnik". All other candles are inner bars.
Gann Box MT5
Frederic Jacques Collomb
Gann Box インジケーターは、トレーダーが市場の重要なレベルを特定し、活用するのを支援するために設計された強力で多機能なツールです。このインジケーターを使用すると、チャート上に長方形を描くことができ、それが自動的に 0, 0.25, 0.50, 0.75, 1 の戦略的レベルを持つ複数のゾーンに分割されます。価格がこれらのレベルのいずれかに達すると、アラートがトリガーされ、トレーディングの意思決定に貴重な支援を提供します。描いたゾーンに対する市場の動きを即座に把握できます。ゾーンをトレースするには、単純な長方形を描いて名前を GannBox に変更するだけです。 このインジケーターは、 サポートとレジスタンス の概念を使用するトレーダー、 サプライとデマンド 、 ICTテクニック 、または**公正価値ギャップ(FVG)**の専門家など、すべてのタイプのトレーダー向けに設計されています。 デイトレーダー、スイングトレーダー、またはポジショントレーダーであろうと、 Gann Box は市場の動きをより良く理解し予測する手助けをし、反応性とパフォーマンスを向上させます。 MT4バージョ
トレンドキャンドル — 瞬時にトレンドを読み取れるインジケーター トレンドキャンドルインジケーターは、チャート上のローソク足の色を自動的に表示し、複雑な分析を視覚的に分かりやすく表示します。市場の強さと方向性を瞬時に判断できます。上昇トレンドは緑、下降トレンドは赤、中立局面は灰色で表示されます。このツールは2つの適応型フィルターを同期させることで、不要なノイズを排除し、明確なシグナルを提供します。 主なメリット 瞬時にトレンドを可視化:市場の方向性を一目で把握できます。 非再描画アルゴリズム:シグナルはローソク足の終値で固定され、その後は変更されません。これにより、過去のデータに基づいた正確な分析と信頼性の高い取引が可能になります。 デュアルシグナルフィルタリング:高速フィルターと低速フィルターが連携し、誤った動きをフィルタリングし、質の高いトレンド状況を浮き彫りにします。 充実したアラート:トレンド反転の通知は、ポップアップウィンドウ、モバイル端末へのプッシュ通知、メール、またはサウンドアラートで受信できます。 汎用性:このインジケーターは、あらゆる金融商品と時間枠で
An indicator of patterns #45 and #46 (Three Falling Peaks and Three Rising Valleys) from Encyclopedia of Chart Patterns by Thomas N. Bulkowski. Parameters: Alerts - show alert when an arrow appears   Push - send a push notification when an arrow appears (requires configuration in the terminal) PeriodBars - indicator period K - an additional parameter that influences the accuracy of pattern shape recognition. The smaller the value is, the smoother the row of peaks/valleys should be, so fewer patt
Hello This EA for send Orders Signals when you open or close order and send statics to your channel in Telegram with sum of profit or Loss Pips you can share your orders with your clients in your telegram please watch our video  to see how it is fast. https://www.youtube.com/watch?v=u_7twtYZhyI you must have Telegram channel then make bot and give it Permission and get token (watch this video to know how do it) https://www.youtube.com/watch?v=x1bKWFOjSBE and you must download this files https
This easy to setup indicator shows you the market volumes in a different way, with support and resistance as showed. You can setup: - Backdays volume to show - Heiken Ashi candle view It works for every kind of graph and every kind of period. The program shows the volumes based on the number of candles displayed in the chart: the more candles the more volumes. Enjoy this very useful indicator. Please feel free to message me to report any kind of improvements! :D
DRAGON SCALE User Guide Indicator Visualization The DRAGON SCALE indicator displays several visual elements on the chart: Scale Zone – Displayed as purple areas (accumulation zones) and red areas (distribution zones) surrounding the pivot level. Lifebeat Signal – Appears as an arrow below the candle when the price enters a critical zone. The color of the arrow indicates the direction (green for bullish, red for bearish, yellow for neutral). Entry Countdown – Appears as an arrow above the cand
LEVEL 3 POWER INDICATOR   The Professional’s Timing Masterpiece Stop guessing market turns. Start seeing them before they happen. ---   Are You Missing Out on Big Moves? Entering trades just before the market reverses? Unsure whether a trend is truly over—or simply pausing? Struggling with confidence when holding trades? You’re not alone. Most traders wrestle with these exact challenges… until they discover the Level 3 Power Indicator. ---   The Game-Changing “Traffic Light” Syst
FREE
AstroCycles: Advanced Financial Astronomy Indicator Overview AstroCycles   is a sophisticated technical analysis tool developed for the MetaTrader 5 (MQL5) platform. It bridges the gap between orbital mechanics and financial market analysis by calculating precise astronomical cycles and visualizing them directly on your trading chart. Unlike standard indicators that rely on past price data, AstroMaster utilizes high-precision astronomical algorithms (Keplerian Elements and Brown’s Lunar Theory)
FREE
Timeless Charts
Samuel Manoel De Souza
5 (4)
Timeless Charts is an advanced charting solution designed for professional traders seeking for custom charts / custom timeframes , including seconds charts / seconds timeframe, renko charts / renko bars, cluster charts / footprint charts and advanced tools present in most of the popular platforms. Unlike traditional offline charts or simplistic custom indicators, this solution constructs fully custom bars with true timestamp accuracy , down to miliseconds, allowing for a powerful and precise tr
In the fast-paced world of cryptocurrency trading, understanding market dynamics is crucial for making informed decisions. One of the key indicators that traders use to analyze market behavior is Volume Delta, which offers insights into the balance between buying and selling pressure. This article explores the concept of Volume Delta, its significance in order flow analysis, and how it can be used effectively in trading strategies. By providing a clear understanding of this indicator, traders ca
Connix MT5
Garry James Goodchild
5 (1)
Connix Dashboard — Multi-currency market structure scanner Connix Dashboard is a chart indicator for MetaTrader 5. It shows a table of symbols and timeframes with market structure, order blocks, fair value gaps, VWAP position, and range information in one panel. What it shows The table can monitor up to 28 symbols on the timeframes you choose. For each symbol and timeframe, the indicator evaluates and displays: Structure events (break of structure and change of character) Order block state (for
# Wave Trend Oscillator (WTO) User Guide ## Overview Wave Trend Oscillator is a powerful technical analysis tool used to analyze price momentum and trend direction. It visualizes market conditions using two main lines (WT1 and WT2) and a histogram. ## Components 1. **WT1 (Green Line)**: Main trend indicator 2. **WT2 (Red Line)**: Signal line 3. **Histogram (Blue)**: Shows the difference between WT1 and WT2 4. **Arrows**: Mark crossover points    - Green Arrow: WT1 crosses above WT2 (Buy signa
Rejection Block
Usiola Oluwadamilol Olagundoye
5 (1)
The "Rejection Block" MetaTrader 5 Indicator offers traders a comprehensive tool for identifying and visualizing rejection candlestick patterns, commonly known as rejection blocks. These patterns are pivotal in discerning potential market reversals or continuations, making them invaluable for traders seeking to enhance their analysis. Key Features: Rejection Block Detection: The indicator diligently scans price data, pinpointing instances of rejection candlestick patterns. These patterns typical
FREE
Introduction This indicator detects volume spread patterns for buy and sell opportunity. The patterns include demand and supply patterns. You might use each pattern for trading. However, these patterns are best used to detect the demand zone (=accumulation area) and supply zone (=distribution area). Demand pattern indicates generally potential buying opportunity. Supply pattern indicates generally potential selling opportunity. These are the underlying patterns rather than direct price action. T
CISD Levels Pro automatically draws CISD Buy and Sell levels directly on your chart. It highlights pending levels while they are forming, then marks confirmed levels after the confirmation candle closes. Optional confirmation arrows help you spot the signal quickly. This tool is designed for traders who want clean, simple CISD level visualization without extra indicators or clutter. Key Features Draws Bullish (BUY) CISD levels and Bearish (SELL) CISD levels Shows Pending levels (dashed) and
The Previous High Low Levels indicator displays the high and low of the previous candle from a selected higher timeframe. This helps traders identify key support and resistance zones while trading on lower timeframes. Features: Plots the previous high and low from a higher timeframe Works on all timeframes and instruments Helps identify strong support and resistance levels Lightweight and does not repaint How to Use: Select a higher timeframe (e.g., H1, H4, D1) in the settings. T
FREE
The Round Number Drawer is an indicator that automatically draw lines or zones at the psychological levels (00 or 50) as the market moves.  New lines are drawn as the market moves while the old lines are deleted. This ensures that your chart is clutter-free. The user specifies the number of lines preferred on the chat, and the indicator keeps the number of lines constant. The indicator plots two types of levels, the Main Level (00 levels e.g. USDCAD 1.33000, 1.34000) and the Sub Level (50 levels
Market Strike SignalBox Market Strike SignalBox is a clean visual indicator that draws structured trade zones directly on the chart: Entry , Stop Loss , TP1 , and TP2 . It is designed for traders who want a fast, “at-a-glance” view of potential setups without complicated dashboards. This product is NOT an Expert Advisor and does not open/close trades . It provides visual signals only . What You Get on the Chart When a valid signal is detected, the indicator will display: Entry level Stop Loss (S
FREE
Vol 2 DPOC volume vol 2 DOC-dynamic horizontal volume indicator for any time periods Main settings of the indicator: Volume Source -selecting data for volumes (tick or real) DPOCOn -enabling / disabling the indicator DPOCFrom -calculation start date DPOCTo -settlement end date The indicator allows you to manually select areas on the chart to analyze changes in the maximum volume over time. You can do this by using vertical lines and moving them along the chart. Or by setting specific dates in
The "Dagangduit Spread Indicator" is a versatile tool designed to provide traders with essential information about the current spread in the chart window. This indicator offers customizable features, including font parameters, display location on the chart, spread normalization, and alerts to enhance your trading experience. Key Features: Real-time Spread Display : The indicator displays the current spread in real-time on your trading chart, allowing you to stay informed about the cost of execut
このプロダクトを購入した人は以下も購入しています
SuperScalp Pro
Van Minh Nguyen
4.57 (21)
SuperScalp Pro – 高度なマルチフィルタースキャルピングインジケーターシステム SuperScalp Pro は、クラシックな Supertrend と複数のインテリジェント確認フィルターを組み合わせた高度なスキャルピングインジケーターです。M1 から H4 まで複数の時間足で効率的に動作し、XAUUSD、BTCUSD、主要 Forex 通貨ペア向けに最適化されています。 このインジケーターは明確な Buy / Sell シグナルを提供し、ATR に基づいてエントリー価格、Stop Loss、Take Profit を自動計算します。Fibonacci Take Profit 機能により、重要な価格帯で早期決済し、到達時に通知を送信します。 初期設定では Fibonacci Take Profit が有効化されており、より安定した取引体験を重視しています。チャートに適用するだけですぐ利用可能です。上級者向けに、すべてのパラメータは自由にカスタマイズできます。 EMA、RSI、ADX、Volume、VWAP、Bollinger Bands、MACD Divergence な
このインジケーターを購入された方には、以下の特典を 無料 で提供しています: 各トレードを自動で管理し、ストップロスとテイクプロフィットを設定し、戦略ルールに基づいてポジションを決済する補助ツール 「Bomber Utility」 様々な銘柄に合わせたインジケーターの設定ファイル(セットファイル) 「最小リスク」、「バランスリスク」、「待機戦略」 の3つのモードで使用できる Bomber Utility 用の設定ファイル このトレーディング戦略をすぐに導入・設定・開始できる ステップバイステップのビデオマニュアル ご注意: 上記の特典を受け取るには、MQL5のプライベートメッセージシステムを通じて販売者にご連絡ください。 オリジナルのカスタムインジケーター 「Divergence Bomber(ダイバージェンス・ボンバー)」 をご紹介します。これは、MACDのダイバージェンス(乖離)戦略に基づいた 「オールインワン」型のトレーディングシステム です。 このテクニカルインジケーターの主な目的は、価格とMACDインジケーターの間に発生するダイバージェンスを検出 し、将来の価格の動きを示す
Entry In The Zone and SMC Multi Timeframe is a real-time 2-in-1 market analysis tool that combines market structure analysis and a No Repaint BUY / SELL signal system into a single indicator, built on Smart Money Concepts (SMC) — a widely adopted framework used by professional traders to understand market structure. This indicator helps you see the market more clearly, make decisions based on structure rather than guesswork, and focus on high-probability zones where price is more likely to react
優れたテクニカルインジケーター「Grabber」をご紹介します。これは、すぐに使える「オールインワン」トレーディング戦略として機能します。 ひとつのコードに、市場のテクニカル分析ツール、取引シグナル(矢印)、アラート機能、プッシュ通知が強力に統合されています。 このインジケーターを購入された方には、以下の特典を無料で提供します: Grabberユーティリティ:オープンポジションを自動で管理するツール ステップバイステップのビデオマニュアル:インジケーターのインストール、設定、取引方法を解説 カスタムセットファイル:インジケーターをすばやく自動設定し、最大限の成果を出すための設定ファイル 他の戦略はもう忘れてください!Grabberだけが、あなたを新たなトレードの高みへと導いてくれるのです。 Grabber戦略の主な特徴: 推奨タイムフレーム:M5〜H4 対応通貨ペア・資産:どれでも使用可能ですが、私が実際に検証した以下を推奨します(GBPUSD、GBPCAD、GBPCHF、AUDCAD、AUDUSD、AUDSGD、AUDCHF、NZDUSD、NZDCAD、EURCAD、EURUSD、E
Power Candles V3 - 初の自己最適化ストレングス・インジケーター Power Candles V3 は、ストレングス分析をそのままトレード可能なシステムへと変えます。チャートを市場の強さで色分けするだけでなく、バックグラウンドでリアルタイムの自動最適化を実行し、あなたの銘柄に最適な Stop Loss、Take Profit、シグナル閾値を提示します。ワンクリックでライブトレードに適用できます。 このツールは Stein Investments エコシステムの一部です。  18 種のツール一覧、AI によるセットアップ提案、  そしてコミュニティ参加はこちら: https://stein.investments Version 3 の新機能 - AUTO-OPTIMIZER チャート読み込み時、そして各バーの確定ごとに、Power Candles V3 は該当銘柄の過去データ上で 3,000 を超えるトレードの組み合わせ をシミュレーションします: 2 つの戦略 を並列でテスト: Momentum (MOM) と Reversal (REV) 3 段階のシグナル閾値
このインジケーターを購入すると、プロ仕様のトレードマネージャーを無料で差し上げます。 まず第一に、このトレーディングシステムがノンリペイント、ノンリドロー、ノンラグのインジケーターであることを強調する価値がある。これにより、手動取引とロボット取引の両方に理想的なものになっています。 オンラインコース、マニュアル、プリセットのダウンロード。 「スマートトレンドトレーディングシステム MT5」は、新規および経験豊富なトレーダー向けにカスタマイズされた包括的なトレーディングソリューションです。10以上のプレミアムインジケーターを組み合わせ、7つ以上の堅実なトレーディング戦略を備えており、多様な市場状況に対応する多目的な選択肢となっています。 トレンドフォロー戦略:トレンドを効果的に乗り越えるための正確なエントリーとストップロス管理を提供します。 リバーサル戦略:潜在的なトレンドの反転を特定し、トレーダーがレンジ相場を活用できるようにします。 スキャルピング戦略:高速で正確なデイトレードおよび短期取引のために設計されています。 安定性:すべてのインジケーターはノンリペイント、ノンリドロー、ノ
SignalTech MT5 is a trading system for EURUSD, USDCHF, USDJPY, AUDUSD, NZDUSD, EURJPY, AUDJPY, NZDJPY, CADJPY H2 and H3 Timeframe.  It can generate signals with Buy/Sell Arrows and Pop-Up/Sound Alerts. Each signal has clear Entry and Stop Loss levels, which should be automatically flagged on the chart, as well as potential Targets 1, 2, and 3. The Entry and TP levels are fixed after the trade is taken. The exit level is dynamic. If there are signs of a potential short-term trend reversal, the
Quantum TrendPulse を ご紹介します。これは、   SuperTrend   、   RSI   、および Stochastic のパワーを 1 つの包括的なインジケーターに組み合わせて、取引の可能性を最大限に引き出す究極の取引ツールです。精度と効率を求めるトレーダー向けに設計されたこのインジケーターは、市場のトレンド、勢いの変化、最適なエントリー ポイントとエグジット ポイントを自信を持って特定するのに役立ちます。 主な特徴: SuperTrend 統合: 現在の市場動向に簡単に追従し、収益性の波に乗ることができます。 RSI精度: 買われすぎと売られすぎのレベルを検出し、市場の反転のタイミングに最適で、SuperTrendのフィルターとして使用されます。 確率的精度: 確率的振動を活用して、変動の激しい市場で隠れたチャンスを見つけます。SuperTrend のフィルターとして使用されます。 マルチタイムフレーム分析:   M5 から H1 または H4 まで、さまざまなタイムフレームで市場を常に把握します。 カスタマイズ可能なアラート: カスタム取引条件が満たされ
Gann Made Easy   は、ミスター・ギャンの理論を使用した取引の最良の原則に基づいた、プロフェッショナルで使いやすい外国為替取引システムです。 W・D・ガン。このインジケーターは、ストップロスとテイクプロフィットレベルを含む正確な買いと売りのシグナルを提供します。 PUSH通知を利用して外出先でも取引可能です。 ご購入後、取引方法の説明と優れた追加インジケーターを無料で入手するには、私にご連絡ください! おそらく、ギャンの取引手法についてはすでに何度も聞いたことがあるでしょう。通常、ギャンの理論は初心者のトレーダーだけでなく、すでにある程度の取引経験がある人にとっても非常に複雑なものです。なぜなら、ギャンの取引手法は理論的にはそれほど簡単に適用できるものではないからです。私はその知識を磨き、最良の原則を私の外国為替インジケーターに組み込むために数年を費やしました。 このインジケーターは非常に簡単に適用できます。必要なのは、それをチャートに添付し、簡単な取引推奨事項に従うだけです。このインジケーターは常に市場分析の仕事を行い、取引の機会を探します。適切なエントリーポイントを検
トレンド スクリーナー インジケーターでトレンド取引の力を解き放ちます。ファジー ロジックと複数通貨システムを活用した究極のトレンド取引ソリューションです。 ファジー ロジックを活用した革新的なトレンド インジケーターである Trend Screener を使用して、トレンド取引を向上させます。 これは、13 を超えるプレミアム ツールと機能、および 3 つの取引戦略を組み合わせた強力なトレンド追跡インジケーターであり、Metatrader をトレンド アナライザーにする多用途の選択肢となります。 期間限定オファー : トレンド スクリーナー インジケーターは、わずか 100 ドルで生涯ご利用いただけます。 (元の価格 50$ ) (オファー延長) Trend Screener の 100% 非再描画精度の揺るぎない精度を体験して、取引の決定が過去の価格変動の影響を受けないようにしてください。 マルチタイムフレームおよびマルチ通貨機能の多用途性を解放し、比類のない自信を持って外国為替、商品、暗号通貨、インデックスの世界を取引できるようにします。 Trend Screener の包括的な
ご紹介     Quantum Breakout PRO は 、ブレイクアウト ゾーンの取引方法を変革する画期的な MQL5 インジケーターです。 13年以上の取引経験を持つ経験豊富なトレーダーのチームによって開発されました。     クォンタム ブレイクアウト プロ   は、革新的でダイナミックなブレイクアウト ゾーン戦略により、あなたのトレーディングの旅を新たな高みに押し上げるように設計されています。 クォンタム ブレイクアウト インジケーターは、5 つの利益ターゲット ゾーンを備えたブレイクアウト ゾーン上のシグナル矢印と、ブレイクアウト ボックスに基づいたストップロスの提案を提供します。 初心者トレーダーにもプロのトレーダーにも適しています。 量子EAチャネル:       ここをクリック 重要!購入後、インストールマニュアルを受け取るためにプライベートメッセージを送ってください。 推奨事項: 時間枠: M15 通貨ペア: GBPJPY、EURJPY、USDJPY、NZDUSD、XAUUSD アカウントの種類: ECN、Raw、またはスプレッドが非常に低い R
これはMT5のインジケーターで、再描画なしで取引に参入するための正確なシグナルを提供します。 外国為替、暗号通貨、金属、株式、インデックスなど、あらゆる金融資産に適用できます。かなり正確な見積もりを提供し、取引を開始して終了するのに最適な時期を教えてくれます。1つのシグナルを処理しただけでインジケーターの元が取れた例の 動画 (6:22)をご覧ください。Entry PointsPro インジケーターの助けを借りたほとんどのトレーダーの最初の1週間の結果が改善しています。 Telegramグループ に登録してください。Entry Points Proインジケーターのメリットは次の通りです。 再描画のないエントリーシグナル 再描画されるインジケーターでは一度表示されたシグナルが削除されて大きな金銭的損失につながることがありますが、これと異なり、表示されて確認されたシグナルは消えることがありません。 エラーなしの取引開始 インジケーターアルゴリズムによって取引を開始する(資産を売買する)理想的な瞬間を見つけることができます。それを使用するすべてのトレーダーの成功率が向上します。 あら
Azimuth Pro
Ottaviano De Cicco
5 (7)
Azimuth Pro V2:MT5向けシンセティック・フラクタル構造分析と確認済みエントリー 概要 Azimuth Pro は Merkava Labs によるマルチレベルスイング構造インジケーターです。4つのネストされたスイングレイヤー、スイングアンカーVWAP、ABCパターン検出、3タイムフレーム構造フィルタリング、そして確定バーでの確認済みエントリー — 1つのチャートで、ミクロスイングからマクロサイクルまでを網羅するワークフロー。 これはブラインドシグナル製品ではありません。ロケーション、コンテキスト、タイミングを重視するトレーダーのための構造ファーストワークフローです。 V2発売記念オファー — Azimuth Pro V2をUSD 399で(次の100本)。最終価格:USD 499。 1. V2での変更点 シンセティック・マルチタイムフレームエンジン 上位タイムフレーム分析をMeridian Proと同じ独自のシンセティックアーキテクチャで一から再構築。よりクリーンなHTFコンテキスト、安定したライブ動作、従来のMTF同期問題なし。シンセティックエンジンは 固定比率タ
マーケットメーカーのためのツール。 Meravith は次の機能を提供します: すべての時間足を分析し、現在有効なトレンドを表示します。 強気と弱気の出来高が等しくなる流動性ゾーン(出来高均衡)を強調表示します。 異なる時間足のすべての流動性レベルをチャート上に直接表示します。 テキスト形式の市場分析を生成し、参考情報として表示します。 現在のトレンドに基づいて目標値、サポートレベル、ストップロスを計算します。 取引のリスクリワード比を算出します。 口座残高に基づいてポジションサイズを計算し、潜在的な利益を推定します。 また、市場に大きな変化があった場合には警告を表示します。 インジケーターの主要ライン: 強気/弱気の出来高エグゾーストライン ― 目標値として機能します。 市場のトレンドを示すライン。市場が強気か弱気かによって色が変わり、トレンドのサポートとして機能します。主にその色が市場センチメントを示します。 出来高均衡ライン(Eq)。Eq(Volume Equilibrium)ラインはシステムの中核です。これは買い手と売り手の出来高のバランスポイントを表します。市場の流動性を示し
BTMM State Engine Pro is a MetaTrader 5 indicator for traders who use the Beat The Market Maker approach: Asian session context, kill zone timing, level progression, peak formation detection, and a multi-pair scanner from a single chart. It combines cycle state logic with a built-in scanner dashboard so you do not need the same tool on many charts at once. What it does Draws the Asian session range; session times can follow broker server offset or be set in inputs. Tracks level progression (L
FX Trend NG:次世代マルチマーケット・トレンドインテリジェンス 概要 FX Trend NG は、複数の時間足に対応したプロフェッショナル向けトレンド分析およびマーケット監視ツールです。 市場全体の構造を数秒で把握することができます。 複数のチャートを切り替える必要はありません。どの銘柄がトレンド中なのか、どこでモメンタムが弱まっているのか、そしてどの時間足で強い整合性があるのかを瞬時に確認できます。 ローンチ特別オファー – FX Trend NG を $30(6ヶ月) または $80 永久ライセンス でご利用いただけます。 すでに Stein Investments のユーザーですか? -> メッセージを送信 して、プライベートグループへアクセスしてください。 セットアップや詳細情報が必要ですか? -> Stein Investments 公式ページ をご覧ください。 1. FX Trend NG が他と異なる理由 3ステート・トレンドロジック ― Buy と Sell だけではない • 多くのインジケーターは Buy または Sell の2状態のみを表示します。
まず第一に、この取引インジケーターは再描画されず、再描画されず、遅延しないことを強調する価値があります。これにより、手動取引とロボット取引の両方に理想的なものになります。 ユーザーマニュアル:設定、入力、戦略。 アトミックアナリストは、価格の強さとモメンタムを利用して市場でより良いエッジを見つけるためのPA価格アクションインジケーターです。ノイズや誤ったシグナルを除去し、取引ポテンシャルを高めるための高度なフィルターを備えています。複雑なインジケーターの複数のレイヤーを使用して、アトミックアナリストはチャートをスキャンし、複雑な数学的計算をシンプルなシグナルと色に変換します。これにより、どのような初心者トレーダーでも理解して使用し、一貫した取引の決定を行うことができます。 「アトミックアナリスト」は、新規および経験豊富なトレーダー向けにカスタマイズされた包括的な取引ソリューションです。プレミアムインジケーターとトップノッチの機能を1つの取引戦略に組み合わせ、すべてのタイプのトレーダーにとって汎用性のある選択肢にします。 デイリートレーディングとスキャルピング戦略:高速で正確なデイ
OmniSync Projection
Antonio-alin Teculescu
5 (1)
Chronos Fractal Engine is an innovative price projection indicator for MetaTrader 5, designed to transform your technical analysis by intelligently identifying and projecting historical price patterns. Built upon an advanced correlation algorithm and the fractal principles of the market, this powerful tool visualizes potential future price movements, giving you a unique edge in your trading decisions. What is Chronos Fractal Engine? At its core, the Chronos Fractal Engine employs a sophisticat
まず正直に言いましょう。 どんなインジケーターも、それ単体であなたを利益化させることはできません。もしそう言う人がいるなら、それは夢を売っているだけです。完璧な売買シグナル(矢印)を表示するインジケーターは、いくらでも“完璧に見せる”ことができます。正しい過去の区間を拡大して、勝ちトレードだけを切り取ればいいだけです。私たちはそれをしません。 SMC Intraday Formula はツールです。 市場構造を読み取り、最も高い確率の価格ゾーンを特定し、今この瞬間のスマートマネーの痕跡をシンプルな言葉で正確に示します。最終判断はあなたが行います。トレードを実行するのもあなたです。しかし今は「希望」ではなく「精度」でエントリーできます。 私たちはこのインジケーターを、ゴールド(XAUUSD)および主要FX通貨ペアで約3年間、日々のスキャルピングに使用してきました。M1、M5、M15、M30の主要ツールです。これは未来を予測しようとするのではなく、今まさに形成されている高確率セットアップを示し、その理由を説明します。 他のすべてのインジケーターと何が違うのか? ほとんどのトレーディングイ
RelicusRoad Pro: 定量的市場オペレーティングシステム 【期間限定】無制限アクセス 70% OFF - 2,000人超のトレーダーと共に なぜ多くのトレーダーは「完璧な」インジケーターを使っても失敗するのでしょうか? それは、文脈を無視して 単一の概念 だけでトレードしているからです。文脈のないシグナルは単なるギャンブルです。勝ち続けるには、 根拠の重なり(コンフルエンス) が必要です。 RelicusRoad Proは単なる矢印インジケーターではありません。完全な 定量的市場エコシステム です。独自のボラティリティモデリングを用いて、価格が推移する「適正価値の道(Fair Value Road)」をマッピングし、ノイズと真の構造的ブレイクを判別します。 推測はやめましょう。機関投資家レベルの「ロード・ロジック」でトレードを。 コアエンジン:「Road」アルゴリズム システムの中心となる Road Algo は、市場環境にリアルタイムで適応するダイナミックなボラティリティチャネルです。 安全ライン(平衡点) と、価格が数学的に反転しやすい 拡張レベル を投影します。 Si
Crystal Heikin Ashi Signals - Professional Trend & Signal Detection Indicator Advanced Heikin Ashi Visualization with Intelligent Signal System for Manual & Automated Trading Final Price: $149 ---------> Price goes up $10 after every 10 sales . Limited slots available — act fast . Overview Crystal Heikin Ashi Signals is a professional-grade MetaTrader 5 indicator that combines pure Heikin Ashi candle visualization with an advanced momentum-shift detection system. Designed for both manual traders
Trend Ai indicatorは、トレンドの識別と実用的なエントリポイントと反転アラートを組み合わせることで、トレーダーの市場分析を強化する優れたツールです。 この指標は、ユーザーが自信と正確さで外国為替市場の複雑さをナビゲートすることを可能にします トレンドAiインジケーターは、主要なシグナル以外にも、プルバックやリトレースメント中に発生するセカンダリエントリポイントを識別し、トレーダーが確立されたトレンド内の価格修正を活用できるようにします。 重要な利点: *MT4およびMT5の仕事 *明確な買いまたは売りシグナル *再描画しません ·すべての資産で動作します 私はeaやセットをtelegram it詐欺で販売しないように注意してください。 すべての設定はここでブログで無料です。  重要! 指示とボーナスを得るために購入後すぐに私に連絡してください! 私の他のプロダクトと同様、実質操作の監視はここに見つけることができます: https://www.mql5.com/en/users/mechanic/seller&nbsp ; 設定および入力: すべての
Market Structure Order Block Dashboard MT5 は、市場構造と主要な価格反応ゾーンをチャート上で直接読み取りたいトレーダー向けに設計された MT5 インジケーターです。BOS、ChoCH、オーダーブロック、Fair Value Gap (FVG)、流動性、Kill Zones、Volume Profile、そして素早い分析のためのコンパクトなダッシュボードを組み合わせています。 本インジケーターは、市場構造、ICT、Smart Money の概念を意思決定の枠組みとして使用するトレーダーを対象としています。トレンド継続、反転の可能性、価格の不均衡、流動性ターゲット、注目ゾーンをより構造的に特定する助けとなります。 購入者向けの付属リソース 購入後、MQL5 のプライベートメッセージにてご依頼いただくと、完全な PDF ユーザーガイドとパラメータ設定のヒントを提供いたします。MQL5 のプライベートメッセージによる直接的な技術サポート。 バージョン 1.20 では 2 つの重要な追加機能があります: Pending BOS / Pending Cho
FX Levels: あらゆる市場における非常に高精度なサポート&レジスタンス 概要 通貨ペア、株式指数、個別銘柄やコモディティなど、どのような市場でも信頼できるサポートとレジスタンスを特定したいですか? FX Levels は伝統的な “Lighthouse” メソッドと先進的な動的アプローチを融合し、ほぼ汎用的な精度を実現します。ブローカーの実務経験を活かし、自動化されたデイリー更新とリアルタイム更新を組み合わせることで、 FX Levels は反転ポイントを見つけ、利益目標を設定し、自信をもってトレードを管理するための手助けをします。今すぐ試してみて、サポート/レジスタンス分析の正確性がどれほどトレードを向上させるかを実感してください! 1. FX Levels がトレーダーにとって非常に有用な理由 非常に正確なサポート&レジスタンスゾーン • FX Levels は異なるブローカー環境でもほぼ同一のゾーンを生成するよう設計されており、データフィードの差異や時刻設定のずれによる不一致を解消します。 • つまり、どのブローカーを利用していても一貫したレベルが得られるため、戦
Bill Williams Advanced is designed for automatic chart analysis using Bill Williams' "Profitunity" system. The indicator analyzes four timeframes at once. Manual (Be sure to read before purchasing) Advantages 1. Analyzes the chart using Bill Williams' "Profitunity" system. Signals are displayed in a table in the corner of the screen and on the price chart. 2. Finds all known AO and AC signals, as well as zone signals. Equipped with a trend filter based on the Alligator. 3. Finds "Divergence Bar
このダッシュボードは、選択されたシンボルの最新の利用可能なハーモニックパターンを表示するので、時間を節約し、より効率的に /   MT4バージョン 。 無料インジケーター:   Basic Harmonic Pattern インジケーター列 Symbol : 選択したシンボルが表示されます。 Trend :   強気または弱気 Pattern : パターンの種類(ガートレー、バタフライ、バット、カニ、サメ、サイファー、ABCD) Entry : エントリー価格 SL: ストップロス価格 TP1: 1回目の利食い価格 TP2: 2回目の利食い価格 TP3:   3回目の利食い価格 Current price :   現在値 Age (in bars):    最後に描画されたパターンの年齢 主な入力項目 Symbols:   "28 Major Currency Pairs "または "Selected Symbols "から選択。 Selected Symbols:   カンマで区切られた監視したいシンボル("EURUSD,GBPUSD,XAUUSD")。ブローカーがペアに接
ARICoin is a powerful trading companion designed to generate high-probability entry signals with dynamic TP/SL/DP levels based on volatility. Built-in performance tracking shows win/loss stats, PP1/PP2 hits, and success rates all updated live. Key Features: Buy/Sell signals with adaptive volatility bands Real-time TP/SL/DP levels based on ATR Built-in MA Filter with optional ATR/StdDev volatility Performance stats panel (Success, Profit/Loss, PP1/PP2) Alerts via popup, sound, push, or email Cust
IX Power MT5
Daniel Stein
4.92 (13)
IX Power: 指数、商品、暗号資産、外国為替市場の洞察を発見 概要 IX Power は、指数、商品、暗号資産、外国為替市場の強弱を分析するための多用途ツールです。 FX Power が全ての利用可能な通貨ペアデータを活用して外為ペアで最高の精度を提供する一方、 IX Power は基礎資産の市場データにのみ焦点を当てています。この特性により、 IX Power は非外為市場に最適であり、単純な外為分析にも信頼性の高いツールです。どのチャートでもスムーズに機能し、取引判断を向上させるための明確で実行可能な洞察を提供します。 1. IX Power がトレーダーにとって価値がある理由 複数市場での強弱分析 • IX Power は指数、商品、暗号資産、外為シンボルの強弱を計算し、それぞれの市場に合わせた洞察を提供します。 • US30、WTI、ゴールド、ビットコイン、または通貨ペアなどの資産を監視して取引機会を発見できます。 幅広い市場に適応 • 外為取引では、 FX Power が関連する全ての通貨ペアを分析することで比類のない精度を提供します。 • IX Power
FX Power: 通貨の強弱を分析して、より賢い取引を実現 概要 FX Power は主要通貨と金の実際の強弱をあらゆる市場状況で理解するための必須ツールです。強い通貨を買い、弱い通貨を売ることで、 FX Power は取引の意思決定を簡素化し、高い確率の取引機会を見出します。トレンドを追従する場合でも、極端なデルタ値を使用して反転を予測する場合でも、このツールはあなたの取引スタイルに完全に適応します。ただ取引するだけではなく、 FX Power で賢く取引をしましょう。 1. なぜ FX Power がトレーダーにとって非常に有益なのか 通貨と金のリアルタイム強弱分析 • FX Power は主要通貨と金の相対的な強弱を計算し、マーケットダイナミクスに関する明確な洞察を提供します。 • どの資産がリードしているか、または後れを取っているかを監視して、取引するペアを賢く選びましょう。 マルチタイムフレームの包括的なビュー • 短期、中期、長期のタイムフレームで通貨と金の強弱を追跡し、マーケットトレンドに基づいて取引戦略を調整できます。 • スキャルピングからスイングトレード
あなたのシンボルでどの戦略が実際に機能するか確認しましょう - リアルマネーをリスクにさらす前に。 Power Barは、あらゆるシンボルとあらゆるタイムフレームで 極端な価格バー を検出し、3つの異なるトレード戦略を即座にバックテストします。勝率、プロフィットファクター、損益を並べて比較できます。すべてが1つのインタラクティブなパネルに集約されています。 推測なし。カーブフィッティングなし。データだけです。 Power Barが特別な理由 ほとんどのインジケーターはシグナルを出すだけで、それが機能するかどうかは推測に任されます。Power Barはさらに先を行きます - すべてのシグナルを 3つの戦略 に対してテストし、統計を表示します。FlipFlop、Momentum、Reversalをワンクリックで切り替え、数値が即座に変化するのを確認できます。 FlipFlop - 常にポジションを保有。シグナルでエントリーし、反対シグナルでイグジット。当社のリサーチでは、US30、US500、DAXなどのトレンドのあるインデックスで最も効果的です。 Momentum - シグナルの方向に
作者のその他のプロダクト
Good day, ladies and gentlemen. What I offer is a pane that allows trading in any direction with a single mouse click, as well as setting stop loss and take profit automatically without your interference according to predefined values (this function can be disabled). The pane is implemented as an Expert Advisor, the buttons are located on the right part of the chart. The pane will be useful for scalpers that trade with different risk level and for intraday traders. The pane has been tested on li
As the name suggests, the utility collects ticks and uploads them to a file. Each symbol receives its own folder. A directory in the symbol folder is created for each date so that you can find ticks of a necessary symbol and date quickly and easily. The collector is made as fast as possible within MQL. One collector is sufficient for each symbol. Timeframe does not matter. The utility features the function for displaying ticks collected in a file on a chart. You can also navigate ticks using a k
フィルタ:
レビューなし
レビューに返信