SFT Full OsMA overbought and oversold
- インディケータ
-
Artem Kuzmin
 ALL PRODUCTS ▶️ https://www.mql5.com/ru/users/zombiezorrofx/seller
🔥 Maximum commission discounts:
💠 Binance 35% (trading bypassing sanctions) - バージョン: 1.0
- アクティベーション: 5
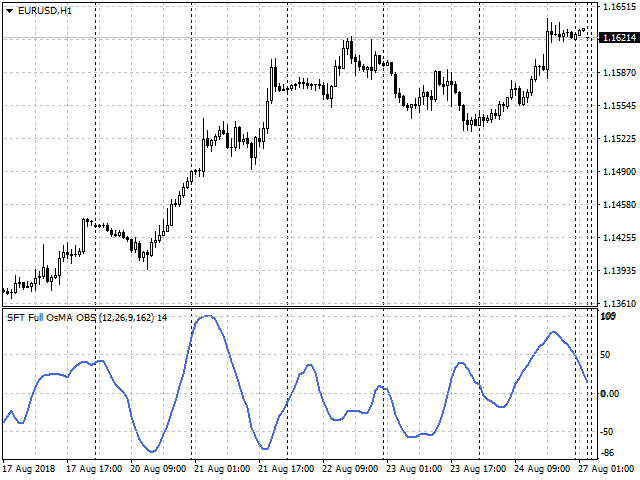
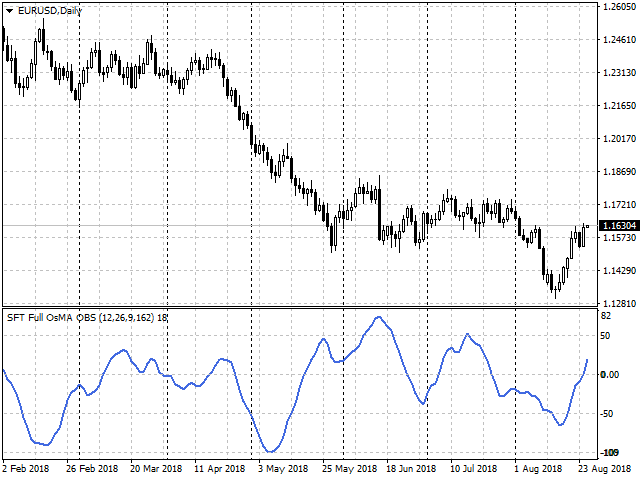
This highly informative indicator applies overbought/oversold levels for more accurate representation of the market situation.
All moving average settings are available, including average type and price it is based on.
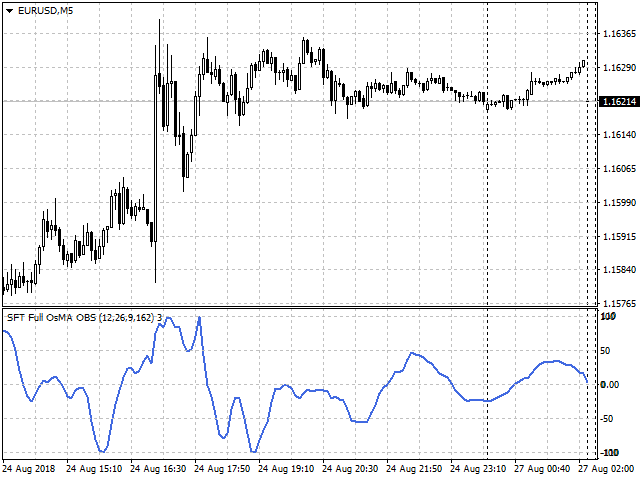
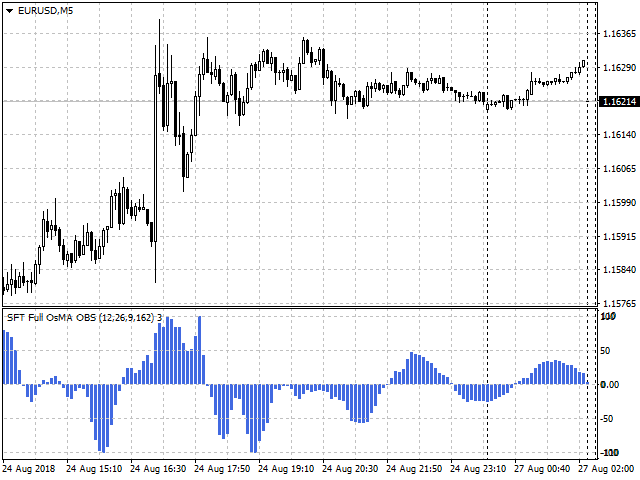
It is also possible to change the appearance of the indicator - line or histogram.
Additional parameters enable more fine-tuning, while trading can be inside the channel and along a trend.
Distinctive features
- Oversold/overbought levels;
- Does not redraw.
- Additional parameters for fine-tuning;
- Displayed as a line or a histogram;
- Works on all timeframes and symbols.
- Suitable for manual trading and development of Expert Advisors.
For more accurate entries and additional confirmation of signals, it can be used in conjunction with other indicators.
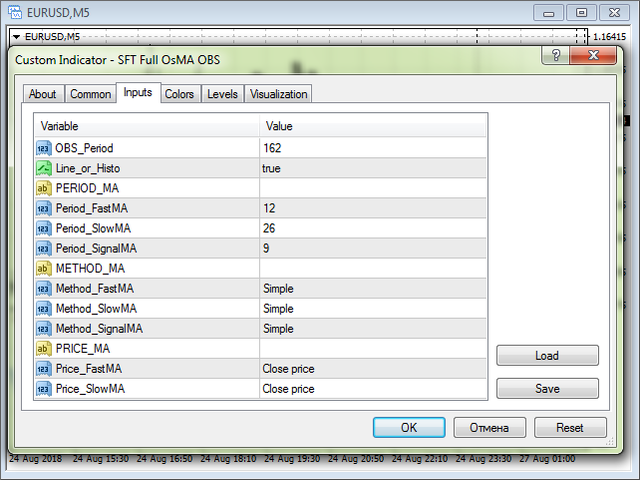
Options
- OBS_Period - period to calculate oversold and overbought levels.
- Line_or_Histo - display the indicator as a line (true) or a histogram (false).
- Period_FastMA - fast moving average period;
- Period_SlowMA - slow moving average period;
- Period_SignalMA - signal moving average period period;
- Method_FastMA - fast moving average type;
- Method_SlowMA - slow moving average type;
- Method_SignalMA - signal moving average type;
- Price_FastMA - prices used to build fast moving average;
- Price_SlowMA - prices used to build slow moving average.
Trading recommendations
- If the histogram (line) is near 100 or -100, the price reversal probability is high.
- If the histogram (line) crosses 50 or -50, the price will most likely continue moving in the same direction.
- If the histogram (line) exceeds 0 and the Highs increase, there is an uptrend.
- If the histogram (line) is below 0 and the Lows decrease, there is a downtrend.
- Local Highs and Lows on the histogram show that the price may reverse or start correction.
- If the histogram (line) crosses the zero line downwards, it is a sell signal. If it crosses the zero line upwards, it is a buy signal.
- Classic divergence signals between the indicator and the price chart - additional confirmation signals.
- The direction of the deal should correspond to the direction of the trend on the higher timeframes.
- Close the deal by an opposite signal or by the defined SL and TP levels.
- When using SL and TP, it is recommended to set SL beyond the nearest extremum, TP = 1..2 SL
Other options are also possible. You can develop the most convenient tactics for you in the process of trading.
Additional information and a more detailed overview of trading methods can be seen here:
We wish you a stable and profitable trading.
Thank you for using our software.
If you like it, share a link with your friends.
In order not to miss the release of new useful trading programs, add SURE FOREX TRADING to the friends list.