SFT Alligator Oscillator
- インディケータ
-
Artem Kuzmin
 ALL PRODUCTS ▶️ https://www.mql5.com/ru/users/zombiezorrofx/seller
🔥 Maximum commission discounts:
💠 Binance 35% (trading bypassing sanctions) - バージョン: 1.0
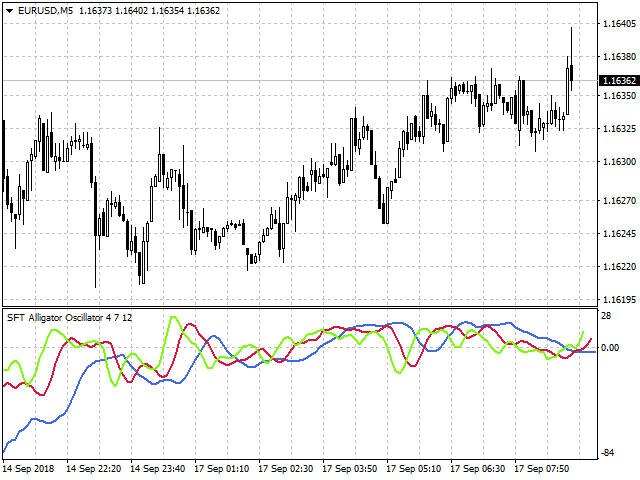
A new interpretation of the classical indicator in the form of an oscillator for a more accurate representation of the situation on the market.
Less lagging than the standard Alligator.
All settings are fully accessible, such as the type and prices for which it is built.
Thanks to the additional parameters, it became possible to fine tune.
Distinctive features
- Does not redraw.
- Additional parameters for fine tuning.
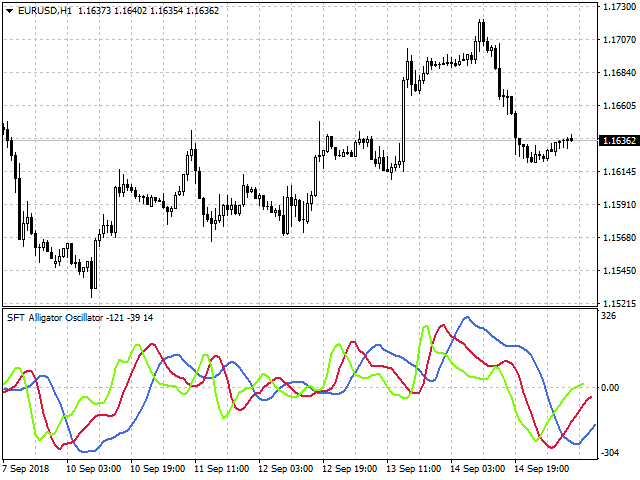
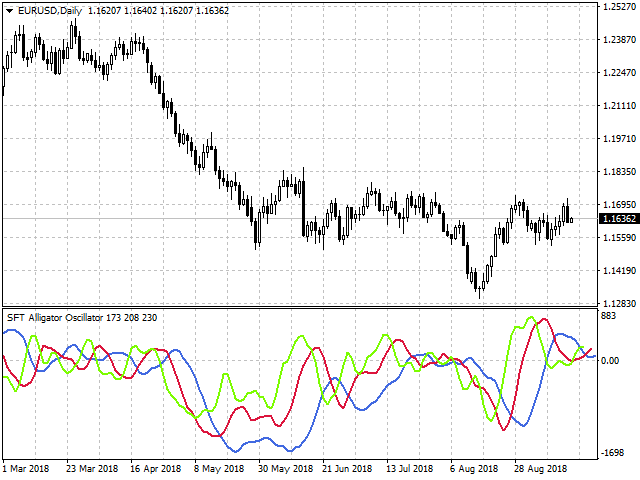
- Works on all timeframes and symbols.
- Suitable for manual trading and development of Expert Advisors.
For more accurate entries and additional confirmation of signals, it can be used in conjunction with other indicators.
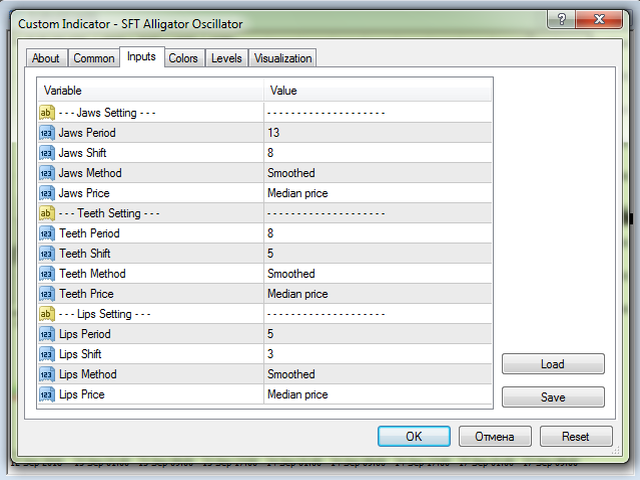
Setting up the indicator
- JawsPeriod - - the period of the "Jaws" (blue line);
- JawsShift - shift of the "Jaws";
- JawsMethod - the method by which "Jaws" are built;
- JawsPrice - the price at which the "Jaws" are built;
- TeethPeriod - the period of "Teeth" (the red line);
- TeethShift - shift of the "Teeth";
- TeethMethod- the method by which "Teeth" are built;
- TeethPrice - the price at which the "Teeth" are built;
- LipsPeriod - period "Lips" (green line);
- LipsShift - shift of the "Lips";
- LipsMethod - the method by which "Lips" are built;
- LipsPrice - the price at which the "Lips" are built;
Trading Recommendations
- If the lines are close to each other or intertwined with each other, then the market is flat.
- If the lines are above zero and the highs are rising, then there is an uptrend in the market.
- If the lines are below zero and the lows fall, then there is a downtrend in the market.
- The farther away the lines are, the trend is stronger.
- A sell signal is formed when the lines crosses the zero level downwards, and upwards for a buy signal.
- The trade direction should correspond to the direction of the trend on a higher timeframe.
- Exit the trades at a reverse signal or at the defined SL and TP levels.
- When using SL and TP, set SL beyond the nearest extremum, TP = 1..2 SL.
Other trading options are also possible, you can develop the most convenient tactics for you in the process of trading.
Additional information and a more detailed overview of trading methods can be seen here:
We wish you a stable and profitable trading.
Thank you for using our software.
If you like it, share a link with your friends.
In order not to miss the release of new useful trading programs, add SURE FOREX TRADING to the friends list