Quasimodo MT4
- インディケータ
- バージョン: 1.21
- アップデート済み: 5 10月 2022

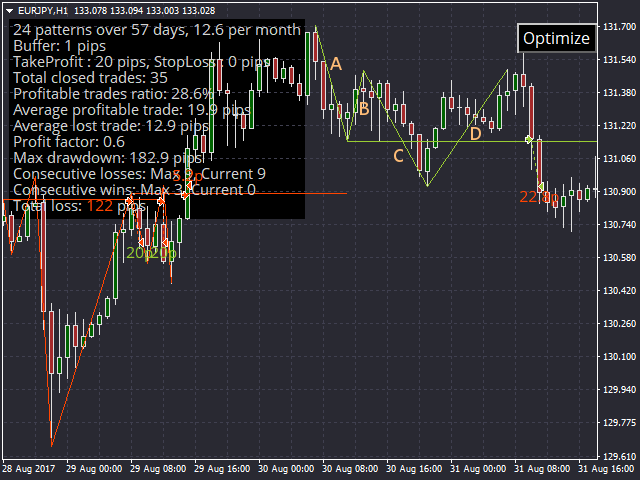
This is an indicator for Quasimodo or Over and Under pattern. It automatically finds the swing points and can even place virtual trades with stop loss and take profit. Press the "Optimize" button to automatically find the most effective settings. The pattern consists of four legs A,B,C,D as shown in the pictures. Open and close prices of the virtual trades are Bid price but the statistics in Display Panel take current spread into account. Its parameters are explained below.
- Buffer - Pips distance from SR (support or resistance) line where a trade is triggered.
- AllowLegABreak - Pattern is valid even if price breaks the start point of leg A.
- OnlyOnePattern - Only one pattern can be valid, a long and a short patterns can't be simultaneously valid.
- CancelPatternCandles - Maximum number of candles a pattern can last. The count starts from the end of leg D.
- TakeProfit - Take profit in pips.
- StopLoss - Stop loss in pips.
- SwingTakeProfit - The take profit level is set at a recent swing point. If TakeProfit value is greater than zero then it is added to SwingTakeProfit level.
- SwingStopLoss - The stop loss level is at the highest/lowest swing point.
- MaxTradesPerPattern - The number of times that SR is touched and a trade is triggered for each pattern. The pattern is valid until the maximum number of trades are opened.
- LongTrades - Long virtual trades are allowed.
- ShortTrades - Short virtual trades are allowed.
- ProfitableTradesPercentage - The minimum allowed percentage of profitable trades during optimization.
- OptimizeBuffer - Minimum and maximum buffer values used for optimization. The values should be separated by a "-" symbol.
- OptimizeTakeProfit - Minimum and maximum TakeProfit values used for optimization. The values should be separated by a "-" symbol.
- OptimizeStopLoss - Minimum and maximum StopLoss values used for optimization. The values should be separated by a "-" symbol.
- UniqueID - When optimization is finished, a file with optimized settings is automatically saved in "Files" folder. UniqueID is the name of this file and should be different for each indicator instance. Load this file to retrieve optimized settings.
- Alerts - An alert pops up. All the alerts options consist of two digits. For the first one, 0 disables alerts, 1 alerts when a trade is opened, 2 when a trade is closed, 3 in both cases. For the second digit, 0 disables alerts, 1 alerts when a pattern is formed.
- AlertSound - Sound of the alert, a custom sound placed in the "Sounds" folder can be used.
- Email - Sends an email.
- Notifications - Sends a push notification to a mobile phone.
- ScreenShots - Takes a screenshot and saves it to the "Files" folder.
- MinHeightA - Leg A should have at least this height.
- MinHeightAType - The MinHeightA value can be pips or a multiplier of the height of another leg.
- MaxHeightA - Leg A should not exceed this height in pips. 0 disables this option.
- MaxHeightAType - The MaxHeightA value can be pips or a multiplier of the height of another leg.
- MinCandlesA - Leg A should have at least this number of candles.
- MaxCandlesA - Leg A should not exceed this number of candles. 0 disables this option. The explanations above apply to the rest legs as well.
- PastBars - The number of past bars used by the indicator.


Interesting, fun to use. With commitment and some personal knowledge you can make good profits.