Big Trend MACD

The Big Trend MACD indicator is an advanced model of the standard MACD indicator. It is very easy and simple to use. The main purpose of the indicator is to find great trends. With this indicator you can easily detect in small trends.

This indicator can be used as two different trend finding tools for big trends and small trends. Try to use the big trends suggested, or with other suitable chart-appropriate indications.


Features and Trends

  • This indicator has period, signal, period color, signal color properties.
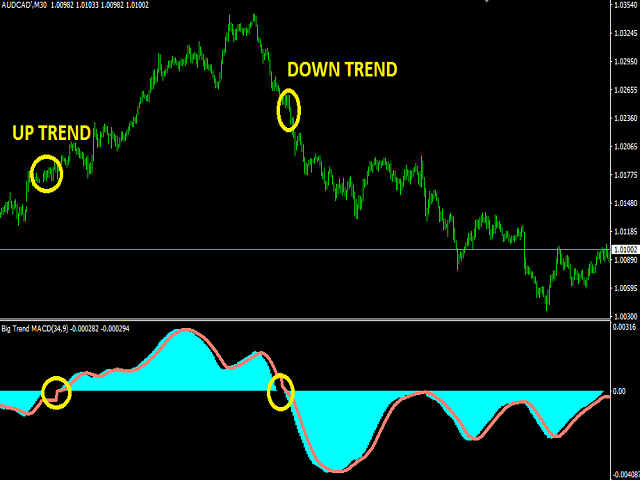
  • Big trend finding:
  • It is quite simple to find great trends.
  • Big down trend: the last bar of the indicator should close below zero.
  • The signal line is below zero and not above the indicator bar.
  • Big up trend:the last bar of the indicator should close above zero.
  • The signal line should be above zero and below the indicator bar.
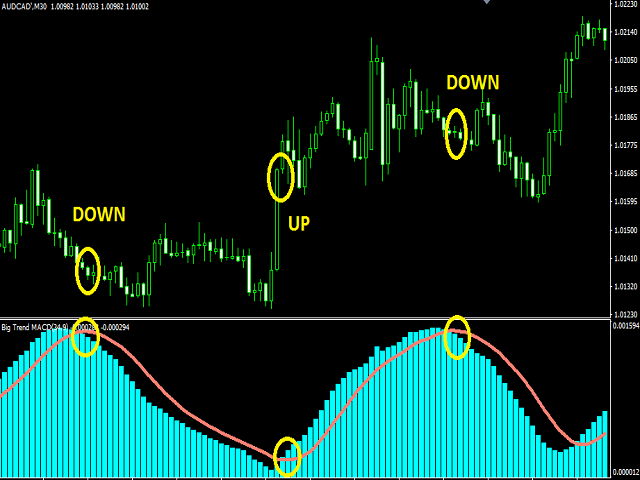
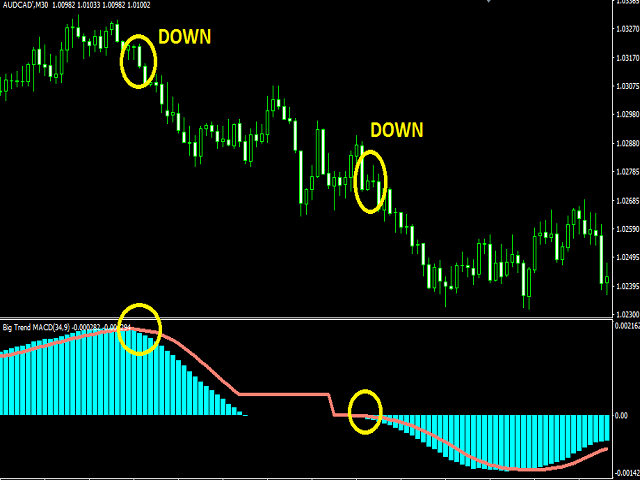
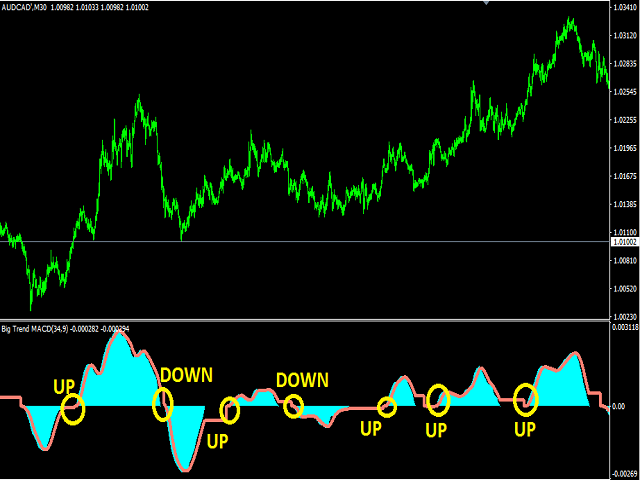
  • Small trend finding:
  • Small down trend: the indicator bar should close below the signal line.
  • Small up-trend: the indicator bar should close above the signal line.
  • Move with the first indicator bar that closes below or above the signal line.


Parameters

  • Period - period setting
  • Signal - signal line setting
  • Period_color - period color setting
  • Signal_color - signal line color setting
おすすめのプロダクト
Trend PA
Mikhail Nazarenko
5 (3)
The Trend PA indicator uses   Price Action   and its own filtering algorithm to determine the trend. This approach helps to accurately determine entry points and the current trend on any timeframe. The indicator uses its own algorithm for analyzing price changes and Price Action. Which gives you the advantage of recognizing, without delay, a new nascent trend with fewer false positives. Trend filtering conditions can be selected in the settings individually for your trading style. The indicator
Alpha Trend signは私たちの取引システムを検証し、取引信号を明確に提示し、信号がドリフトすることはありません。 主な機能: •市場が活況を示している地域に応じて、指標に基づいて現在の相場がトレンド相場に属しているか、それとも揺れ相場に属しているかを直感的に判断することができる。 そして、指標の指示矢印に基づいて市場に切り込み、緑の矢印は購入を提示し、赤の矢印は販売を提示する。 •小周期変動による頻繁な取引信号の発生を回避するために、5分以上の時間周期で取引を行うことを推奨します。 •最適な取引タイミングを逃さないために、シグナルプロンプトをオンにすることもできます。 •本指標はトレンド相場をよく予測するだけでなく、幅広振動相場でも利益を得ることができる。 •本指標は大道至簡の原則に基づいており、異なる段階のトレーダーが使用するのに適している。 注意事項: •Alpha Trend signには明確な入退場信号があり、損失を与えないように逆位相操作を提案しない。 •Alpha Trend signは特に成熟した指標であり、デルのチー
「Auto FIBO Pro」Crypto_Forex インジケーターは、取引の補助ツールとして最適です。 - インジケーターは、フィボナッチ レベルとローカル トレンド ライン (赤色) を自動的に計算してチャート上に配置します。 - フィボナッチ レベルは、価格が反転する可能性のある重要な領域を示します。 - 最も重要なレベルは、23.6%、38.2%、50%、61.8% です。 - リバーサル スキャルピングやゾーン グリッド取引に使用できます。 - Auto FIBO Pro インジケーターを使用して、現在のシステムを改善する機会も多数あります。 - Info Spread Swap Display があり、接続されている外国為替ペアの現在のスプレッドとスワップを表示します。 - ディスプレイには、アカウントの残高、エクイティ、マージンも表示されます。 - Info Spread Swap Display は、チャートのどのコーナーにも配置できます。 0 - 左上コーナー、1 - 右上、2 - 左下、3 - 右下。 高品質のトレーディングロボットとインジケーターをご覧にな
VR Cub
Vladimir Pastushak
VR Cub は、質の高いエントリーポイントを獲得するためのインジケーターです。このインジケーターは、数学的計算を容易にし、ポジションへのエントリーポイントの検索を簡素化するために開発されました。このインジケーターが作成されたトレーディング戦略は、長年にわたってその有効性が証明されてきました。取引戦略のシンプルさはその大きな利点であり、初心者のトレーダーでもうまく取引することができます。 VR Cub はポジション開始ポイントとテイクプロフィットとストップロスのターゲットレベルを計算し、効率と使いやすさを大幅に向上させます。取引の簡単なルールを理解するには、以下の戦略を使用した取引のスクリーンショットを見てください。 設定、設定ファイル、デモ版、説明書、問題解決方法は、以下から入手できます。 [ブログ] レビューを読んだり書いたりすることができます。 [リンク] のバージョン [MetaTrader 5] エントリーポイントの計算ルール ポジションをオープンする エントリーポイントを計算するには、VR Cub ツールを最後の高値から最後の安値までストレッチする必要があります。 最初
フィボナッチリトレースと拡張ラインツール DiNapoliポイント取引方法とゴールデンセクション取引を使用するトレーダーにとって理想的なMT4プラットフォームのフィボナッチリトレースと拡張ラインツール 主な特長: あなたはフィボナッチリトレースメントの複数のセットを直接描くことができ、重要なリターンポイント間の関係は一目瞭然です。 2.フィボナッチ拡張を描画することができます。 3.フィボナッチフォールドバックとラインの延長は、簡単な観察と数値表示のために左右に動かすことができます。 4.チャートは非常に爽やかな 5.数字キーでサイクルを切り替えることができます。 ファンクションキー: 1。 [戻るを押す、要求に応じて描画する、最大8つのグループにする 2。拡張]を描くには[押す] 3。 \を押すと、現在のサイクルの下にあるすべての拡張機能と折り畳みが削除されます 4。フォールドバックを移動して削除して展開する (1)最初のフォールドバックセットのF5行をクリックします。 一度クリックすると(黄色に変わります)、キーボードのDeleteキーを押すと、フォーカ
これは、従来のMACDよりも正確で使いやすいユニークなMACD指標です。 それはあらゆるチャートサイクルに適しており、あらゆる市場の種類に適しています。 赤い列は(Buy)バンドの信号、青い列は(Sell)バンドの信号です。 黄色と緑色の線は傾向線で、2本の線は交差しません。 購入する:青い列で、真ん中の0軸を通る緑色の線を見てください。 売り:赤い列で、真ん中の0軸の下の黄色い線を見てください。 MACDの形態信号からの偏差は99%正確です。 購入フォームからの逸脱:バンドの価格がバンドより低く、インディケータのインデックスがますます高くなっていますこの場合、すぐに買い注文をすることができます。 売りからの逸脱:バンドの価格がバンドより高く、インディケータのインデックスが小さくなってきているこの場合、売りシングルはすぐに実行できます。 注:指標の五芒星は、価格の変動により変化します。
Gvs Undefeated Trend   indicator is designed for trend and signal trading. This indicator generates trend signals.  It uses many algorithms and indicators to generate this signal. It tries to generate a signal from the points with the highest trend potential. This indicator is a complete trading product. This indicator does not need any additional indicators.  You can only trade with this indicator. The generated signals are displayed on the graphical screen.  Thanks to the alert features you ca
Crypto_Forex MT4 用インジケーター「モーニング スター パターン」 - インジケーター「モーニング スター パターン」は、プライス アクション トレーディングに非常に強力なインジケーターです。再描画なし、遅延なし。 - インジケーターは、チャート上で強気のモーニング スター パターンを検出します。チャート上の青い矢印信号 (画像を参照)。 - PC、モバイル、および電子メール アラート付き。 - また、その兄弟である弱気の「イブニング スター パターン」インジケーターも利用できます (以下のリンクに従ってください)。 - インジケーター「モーニング スター パターン」は、サポート/レジスタンス レベルと組み合わせるのに最適です。 高品質のトレーディングロボットとインジケーターをご覧になるにはここをクリックしてください! これは、この MQL5 Web サイトでのみ提供されるオリジナル製品です。
The Th3Eng PipFinite indicator is based on a very excellent analysis of the right trend direction with perfect custom algorithms. It show the true direction and the best point to start trading. With StopLoss point and Three Take Profit points. Also it show the right pivot of the price and small points to order to replace the dynamic support and resistance channel, Which surrounds the price. And Finally it draws a very helpful Box on the left side on the chart includes (take profits and Stop loss
The   True Magic Oscillator   indicator is designed for signal trading. This indicator generates trend signals. It uses many algorithms and indicators to generate this signal. It tries to generate signals from the points with the highest trend potential. This indicator is a complete trading product. This indicator does not need any additional indicators. The indicator is never repainted. The point at which the signal is given does not change.         Features and Recommendations Works wit
Price Magnet — Price Density and Attraction Levels Indicator Price Magnet is a professional analytical tool designed to identify key support and resistance levels based on statistical Price Density. The indicator analyzes a specified historical period and detects price levels where the market spent the most time. These zones act as “magnets,” attracting price action or forming a structural base for potential reversals. Unlike traditional Volume Profile tools, Price Magnet focuses on price-time d
[ZhiBiCCI]インディケータは全てのサイクル使用に適しており、そして全ての市場品種にも適しています。 [ZhiBiCCI]緑色の実線は強気の発散の逆転です。緑色の点線は古典的な強気の発散です。 [ZhiBiCCI]赤への実線は逆弱気の発散である。赤い点線は古典的な弱気の発散です。 [ZhiBiCCI]はパラメータ(アラート、メール送信、通知送信)で設定でき、(true)に設定するとインスタント信号をアラームウィンドウに送信し、Eメール、インスタントメッセージを送信できます。 パラメータ設定の説明 [displayAlert]:これはアラームスイッチで、trueに設定され、矢印が表示されればプロンプトに自動的に警告され、falseに設定されれば警告されません。 [sendmail_NO_OFF]:これはメールを送信するためのスイッチで、trueに設定します。矢印が表示されていればMT4で設定したメールボックスにメールを送信し、falseに設定されていればメールを送信しません。 [sendnotification_NO_OFF]:これはインスタントメッセージを送信するた
SMC Venom Model BPR インジケーターは、スマート マネー (SMC) コンセプトで取引するトレーダー向けのプロフェッショナル ツールです。価格チャート上の 2 つの主要なパターンを自動的に識別します。 FVG   (フェアバリューギャップ) は、3 本のローソク足の組み合わせで、最初のローソク足と 3 番目のローソク足の間にギャップがあります。ボリュームサポートのないレベル間のゾーンを形成し、価格修正につながることがよくあります。 BPR   (バランス価格範囲) は、2 つの FVG パターンの組み合わせで、「ブリッジ」を形成します。これは、価格がボリュームアクティビティの少ない動きで動くときに、ブレイクアウトしてレベルに戻るゾーンで、ローソク足の間にギャップを作成します。 これらのパターンは、大規模な市場プレーヤーと一般参加者の相互作用が発生するチャート上のボリュームと価格動向の分析に基づいて、トレーダーが主要なサポート/レジスタンス レベル、ブレイクアウト ゾーン、エントリ ポイントを識別するのに役立ちます。 インジケーターは、長方形と矢印の形でパターンを視
Real Pro Signal   indicator is designed for signal trading. This indicator generates trend signals. It uses many algorithms and indicators to generate this signal. It tries to generate a signal from the points with the highest trend potential. This indicator is a complete trading product. This indicator does not need any additional indicators. The indicator certainly does not repaint. The point at which the signal is given does not change.     Features and Suggestions Time Frame: H1 Works
これは、キャンドルの終値を予測する指標です。 このインジケータは、主にD1チャートでの使用を目的としていますが. この指標は、従来の外国為替取引とバイナリオプション取引の両方に適しています。 インジケーターは、スタンドアロンのトレーディングシステムとして使用することも、既存のトレーディングシステムへの追加として機能させることもできます。 このインジケーターは、現在のキャンドルを分析し、キャンドル自体の内部の特定の強度係数と、前のキャンドルのパラメーターを計算します。 したがって、この指標は、市場の動きのさらなる方向性と現在のキャンドルの終値を予測します。 この方法のおかげで、この指標は、短期の日中取引だけでなく、中期および長期の取引にも適しています。 インジケーターを使用すると、市場の状況の分析中にインジケーターが生成する潜在的な信号の数を設定できます。 インジケーターの設定には、このための特別なパラメーターがあります。 また、インジケーターは、チャート上のメッセージの形式で、電子メールで、およびPUSH通知の形式で、新しい信号について通知することができます。 購入後は必ず私に書いて
The   Trend Duration Forecast MT4   indicator is designed to estimate the probable lifespan of a bullish or bearish trend. Using a Hull Moving Average (HMA) to detect directional shifts, it tracks the duration of each historical trend and calculates an average to forecast how long the current trend is statistically likely to continue. This allows traders to visualize both real-time trend strength and potential exhaustion zones with exceptional clarity. KEY FEATURES Dynamic Trend Detection:   Uti
This unique multi-currency strategy simultaneously determines the strength of trends and market entry points, visualizing this using histograms on the chart. The indicator is optimally adapted for trading on the timeframes М5, М15, М30, Н1. For the convenience of users, the indicator renders the entry point (in the form of an arrow), recommended take profit levels (TP1, TP2 with text labels) and the recommended Stop Loss level. The take profit levels (TP1, TP2) are automatically calculated for
Super Reversal Pattern Indicator Unlock the power of advanced pattern recognition with our Super Reversal Pattern Indicator. Designed for traders seeking precision and reliability, this indicator identifies one of the most effective reversal patterns in technical analysis, offering a significant edge in your trading strategy. Key Features: Non-Repainting Accuracy: Enjoy the confidence of non-repainting technology. Once a Super Reversal Pattern is detected, it remains static, providing consiste
Indicator Description GOLD TITAN KING SIGNAL INDICATOR High-Precision Gold Scalping Buy/Sell Signals – Manual Trading Assistant Overview The Gold Titan King Signal Indicator is a manual trading assistant tool designed for high-frequency scalping on Gold (XAUUSD) and other major pairs. It generates clear BUY/SELL signals with precise entry levels, along with adjustable Stop Loss and Take Profit levels displayed directly on the chart. ️ This tool is NOT an EA. It does not execute trades
This is a trend indicator without redrawing Developed instead of the binary options strategy (by the color of the Martingale candlestick) Also works well in forex trading When to open trades (binary options) A signal will appear in the place with a candle signaling the current candle It is recommended to open a deal for one candle of the current timeframe M1 and M5 When a blue dot appears, open a deal up When a red dot appears, open a trade down. How to open trades on Forex. When a signal is rec
Pro Trend Tracking   indicator is designed for trend and signal trading. This indicator generates trend signals.  It uses many algorithms and indicators to generate this signal. It tries to generate a signal from the points with the highest trend potential. This indicator is a complete trading product. This indicator does not need any additional indicators.  You can only trade with this indicator. The generated signals are displayed on the graphical screen.  Thanks to the alert features you can
Signal Tower   indicator is designed for signal trading. This indicator generates trend signals. It uses many algorithms and indicators to generate this signal. It tries to generate a signal from the points with the highest trend potential. This indicator is a complete trading product. This indicator does not need any additional indicators. The indicator certainly does not repaint. The point at which the signal is given does not change. The indicator has a pips counter. You can see how many
トレンドオシレーターは、高度なカスタム Crypto_Forex インジケーター、効率的な取引ツールです! - 高度な新しい計算方法を使用 - パラメーター「計算価格」のオプションは 20 種類。 - これまで開発された中で最もスムーズなオシレーター。 - 上昇トレンドの場合は緑色、下降トレンドの場合は赤色。 - 売られすぎの値: 5 未満、買われすぎの値: 95 以上。 - このインジケーターを使用すると、標準戦略をアップグレードする機会が十分にあります。 - PC およびモバイルアラート付き。 高品質のトレーディングロボットとインジケーターをご覧になるにはここをクリックしてください! これは、この MQL5 Web サイトでのみ提供されるオリジナル製品です。
Fx Perfect Signal indicator is designed for signal trading. This indicator generates trend signals.  It uses many algorithms and indicators to generate this signal. It tries to generate a signal from the points with the highest trend potential. This indicator is a complete trading product. This indicator does not need any additional indicators.  The indicator certainly does not repaint. The point at which the signal is given does not change.  Thanks to the alert features you can get the signals
The   Fibonacci Confluence Toolkit   is a technical analysis tool designed to help traders identify potential price reversal zones by combining key market signals and patterns. It highlights areas of interest where significant price action or reactions are anticipated, automatically applies Fibonacci retracement levels to outline potential pullback zones, and detects engulfing candle patterns. Its unique strength lies in its reliance solely on price patterns, eliminating the need for user-define
Pro Magic Signal   indicator is designed for signal trading. This indicator generates trend signals.  It uses many algorithms and indicators to generate this signal. It tries to generate a signal from the points with the highest trend potential. This indicator is a complete trading product. This indicator does not need any additional indicators.  The indicator certainly does not repaint. The point at which the signal is given does not change.  Thanks to the alert features you can get the signals
これはほぼ間違いなく、MetaTraderプラットフォームで見つけることができる最も完全な調和価格形成自動認識インジケーターです。 19種類のパターンを検出し、フィボナッチプロジェクションをあなたと同じように真剣に受け止め、潜在的逆転ゾーン(PRZ)を表示し、適切なストップロスとテイクプロフィットレベルを見つけます。 [ インストールガイド | 更新ガイド | トラブルシューティング | よくある質問 | すべての製品 ] 19の異なる調和価格形成を検出します プライマリ、派生および補完フィボナッチ投影(PRZ)をプロットします 過去の価格行動を評価し、過去のすべてのパターンを表示します この指標は、独自の品質とパフォーマンスを分析します 適切なストップロスとテイクプロフィットのレベルを表示します ブレイクアウトを使用して適切な取引を通知します すべてのパターン比をグラフにプロットします 電子メール/音声/視覚アラートを実装します スコット・M・カーニーの本に着想を得て、この指標は最も純粋で急を要するトレーダーのニーズを満たすように設計されています。ただし、トレードを容易にする
Crypto_Forex MT4用インジケーター「 RSI SPEED 」は、優れた予測ツールで、リペイント機能はありません。 - このインジケーターの計算は物理学の方程式に基づいています。RSI SPEEDはRSI自体の1次導関数です。 - RSI SPEEDは、主要トレンドの方向にスキャルピングエントリーするのに適しています。 - 適切なトレンドインジケーター(例えばHTF MA(画像参照)など)と組み合わせて使用​​してください。 - RSI SPEEDインジケーターは、R​​SI自体がどれだけ速く方向転換するかを示します。非常に敏感です。 - モメンタムトレード戦略にはRSI SPEEDインジケーターの使用をお勧めします。RSI SPEEDインジケーターの値が0未満の場合は価格モメンタムが下降し、RSI SPEEDインジケーターの値が0を超える場合は価格モメンタムが上昇します。 - インジケーターにはモバイルとPCのアラートが組み込まれています。 高品質のトレーディングロボットとインジケーターをご覧になるにはここをクリックしてください! これは、このMQL5ウェブサイトで
EZZ Elite Zig Zag is an indicator for the MetaTrader 4 terminal. This indicator traces the peak of the trend based on the market reversal, thus showing various opportunities in the financial market. EZZ Elite Zig Zag is a visual tool, intuitive, and easy to understand and use.  Test it Yourself by Downloading it for Free. Author Paulo Rocha all rights reserved
The ”Trend Guess” is a complex software that does not involve the MACD, RSI or moving averages. It adapts itself to current market conditions using complicated algorithms based on price action and out custom indicators. The indicator will gives you trading signals Buy or Sell stop loss levels indicated in the popup alert window and graphically. You have to do is to press buy or sell button whenever you get a signal Important Rules Identify a current long term trend. Example – if you trade on a
このプロダクトを購入した人は以下も購入しています
Gann Made Easy は、ミスター・ギャンの理論を使用した取引の最良の原則に基づいた、プロフェッショナルで使いやすい外国為替取引システムです。 W・D・ガン。このインジケーターは、ストップロスとテイクプロフィットレベルを含む正確な買いと売りのシグナルを提供します。 PUSH通知を利用して外出先でも取引可能です。 ご購入後、取引方法の説明と優れた追加インジケーターを無料で入手するには、私にご連絡ください! おそらく、ギャンの取引手法についてはすでに何度も聞いたことがあるでしょう。通常、ギャンの理論は初心者のトレーダーだけでなく、すでにある程度の取引経験がある人にとっても非常に複雑なものです。なぜなら、ギャンの取引手法は理論的にはそれほど簡単に適用できるものではないからです。私はその知識を磨き、最良の原則を私の外国為替インジケーターに組み込むために数年を費やしました。 このインジケーターは非常に簡単に適用できます。必要なのは、それをチャートに添付し、簡単な取引推奨事項に従うだけです。このインジケーターは常に市場分析の仕事を行い、取引の機会を探します。適切なエントリーポイントを検出す
An exclusive indicator that utilizes an innovative algorithm to swiftly and accurately determine the market trend. The indicator automatically calculates opening, closing, and profit levels, providing detailed trading statistics. With these features, you can choose the most appropriate trading instrument for the current market conditions. Additionally, you can easily integrate your own arrow indicators into Scalper Inside Pro to quickly evaluate their statistics and profitability. Scalper Inside
「 Dynamic Scalper System 」インジケーターは、トレンド波の中でスキャルピング取引を行う手法のために設計されています。 主要通貨ペアと金でテスト済みで、他の取引商品との互換性があります。 トレンドに沿った短期的なポジションオープンのシグナルを提供し、追加の価格変動サポートも提供します。 インジケーターの原理 大きな矢印はトレンドの方向を決定します。 トレンド波の中では、小さな矢印の形でスキャルピングシグナルを生成するアルゴリズムが機能します。 赤い矢印は強気方向、青い矢印は弱気方向です。 トレンドの方向には敏感な価格変動ラインが描かれ、小さな矢印のシグナルと連動します。 シグナルは次のように機能します。適切なタイミングでラインが現れるとエントリーシグナルが形成され、ラインが開いている間はポジションが保持され、完了すると取引が終了します。 推奨される動作時間枠はM1~H4です。 矢印は現在のローソク足に形成され、次のローソク足が開いている場合は、前のローソク足の矢印は再描画されません。 入力パラメータ Trend Wave Period - トレンド方向
M1 SNIPER は使いやすいトレーディングインジケーターシステムです。M1時間足向けに設計された矢印インジケーターです。M1時間足でのスキャルピングのためのスタンドアロンシステムとして、また既存のトレーディングシステムの一部としても使用できます。このトレーディングシステムはM1時間足での取引に特化して設計されていますが、他の時間足でも使用できます。元々、この手法はXAUUSDとBTCUSDの取引用に設計しましたが、他の市場においても役立つと考えています。 インジケーターのシグナルは、トレンドの方向と逆方向に取引できます。インジケーターのシグナルを利用して両方向に取引するのに役立つ特別な取引テクニックをご紹介します。この手法は、特別な動的なサポートとレジスタンスの価格帯を利用することに基づいています。 ご購入後、M1 SNIPER矢印インジケーターをすぐにダウンロードできます。さらに、M1 SNIPERツールのすべてのユーザーに、以下のスクリーンショットに表示されているApollo Dynamic SRインジケーターを無料で提供しています。この2つのインジケーターを組み合わせることで
まず第一に、この取引インジケーターは再描画されず、再描画されず、遅延しないことを強調する価値があります。これにより、手動取引とロボット取引の両方に理想的なものになります。 ユーザーマニュアル:設定、入力、戦略。 アトミックアナリストは、価格の強さとモメンタムを利用して市場でより良いエッジを見つけるためのPA価格アクションインジケーターです。ノイズや誤ったシグナルを除去し、取引ポテンシャルを高めるための高度なフィルターを備えています。複雑なインジケーターの複数のレイヤーを使用して、アトミックアナリストはチャートをスキャンし、複雑な数学的計算をシンプルなシグナルと色に変換します。これにより、どのような初心者トレーダーでも理解して使用し、一貫した取引の決定を行うことができます。 「アトミックアナリスト」は、新規および経験豊富なトレーダー向けにカスタマイズされた包括的な取引ソリューションです。プレミアムインジケーターとトップノッチの機能を1つの取引戦略に組み合わせ、すべてのタイプのトレーダーにとって汎用性のある選択肢にします。 デイリートレーディングとスキャルピング戦略:高速で正確な
トレンドラインプロ   市場の真の方向転換点を理解するのに役立ちます。この指標は、真のトレンド反転と主要プレーヤーが再び参入するポイントを示します。 分かりますか     BOSライン   複雑な設定や不要なノイズなしに、より長い時間足でのトレンドの変化と重要なレベルを把握できます。シグナルは再描画されず、バーが閉じた後もチャート上に残ります。 VERSION MT 5     -     RFI LEVELS PRO インジケーター と組み合わせることで、その潜在能力を最大限に発揮します。 インジケーターが示す内容: 本当の変化   トレンド(BOSライン) 一度シグナルが現れたら、それは有効です!これは、リペイント機能を持つインジケーターとの重要な違いです。リペイント機能を持つインジケーターは、シグナルを発した後、それを変更し、資金の損失につながる可能性があります。これにより、より高い確率と精度で市場に参入できます。また、矢印が現れた後、目標値(利益確定)に達するか、反転シグナルが現れるまで、ローソク足の色を変更する機能もあります。 繰り返しエントリ       主要プレーヤーの
Volatility Trend System - a trading system that gives signals for entries. The volatility system gives linear and point signals in the direction of the trend, as well as signals to exit it, without redrawing and delays. The trend indicator monitors the direction of the medium-term trend, shows the direction and its change. The signal indicator is based on changes in volatility and shows market entries. The indicator is equipped with several types of alerts. Can be applied to various trading ins
Trend indicator AI
Ramil Minniakhmetov
4.49 (84)
Trend Ai indicatorは、トレンドの識別と実用的なエントリポイントと反転アラートを組み合わせることで、トレーダーの市場分析を強化する優れたツールです。 この指標は、ユーザーが自信と正確さで外国為替市場の複雑さをナビゲートすることを可能にします トレンドAiインジケーターは、主要なシグナル以外にも、プルバックやリトレースメント中に発生するセカンダリエントリポイントを識別し、トレーダーが確立されたトレンド内の価格修正を活用できるようにします。 重要な利点: *MT4およびMT5の仕事 *明確な買いまたは売りシグナル *再描画しません ·すべての資産で動作します 私はeaやセットをtelegram it詐欺で販売しないように注意してください。 すべての設定はここでブログで無料です。  重要! 指示とボーナスを得るために購入後すぐに私に連絡してください! 私の他のプロダクトと同様、実質操作の監視はここに見つけることができます: https://www.mql5.com/en/users/mechanic/seller&nbsp ; 設定および入力: すべての
まず第一に、この取引ツールはノンリペイント、ノンリドロー、ノンラグの指標であり、プロの取引に理想的ですことを強調する価値があります。 オンラインコース、ユーザーマニュアル、デモ。 スマートプライスアクションコンセプトインジケーターは、新米から経験豊富なトレーダーまで、非常 に強力なツールです。Inner Circle Trader AnalysisやSmart Money Concepts Trading Strategiesなど、20以上の有用な指標を1つに組み合わせています。このインジケーターはスマートマネーコンセプトに焦点を当て、大手機関の取引方法を提供し、彼らの動きを予測するのに役立ちます。 特に、流動性分析に優れており、機関がどのように取引しているかを理解しやすくしています。市場のトレンドを予測し、価格の動きを慎重に分析するのに優れています。機関の戦略とトレードを合わせることで、市場の動向についてより正確な予測ができます。このインジケーターは多目的であり、市場構造を分析し、重要な注文ブロックを特定し、さまざまなパターンを認識するのに優れています。 このインジケーターは
チャートを構成し、周期的な価格変動を識別するテクニカル指標。 どのチャートでも動作します。 いくつかの種類の通知。 グラフ自体に追加の矢印があります。 履歴を再描画せずに、キャンドルのクローズに取り組みます。 M5以上のTFを推奨します。 パラメータの使用と設定が簡単です。 異なるパラメータを持つ 2 つのインジケーターを使用する場合、他のインジケーターなしで使用できます。 入力パラメータは2つあります 周期性と信号持続時間 これら 2 つのパラメータは、チャート構造の処理を扱います。 Cyclicity - 反転サイクルが変化する頻度を調整し、サイクルを滑らかにします。 Signal duration - 最小数では価格変動の衝動を検出し、最大数では長期的なトレンドの動きを検出します。
Auto Optimized Parabolic RSI: 高度な3Dモメンタムエンジン ほとんどのリテール向けインジケーターは、市場のボラティリティが変化した瞬間に破綻する静的な入力値に依存しているため、失敗に終わります。Auto Optimized Parabolic RSIは、自らの数学的優位性を継続的に再計算することで「インジケーターの陳腐化」問題を解決し、機関投資家レベルの定量的適応力をMT5ターミナルに直接もたらします。 最大の強み: カスタムインメモリ3D最適化   標準的な自動最適化ツールは、インジケーターの呼び出しで端末に過負荷をかけるため、頻繁にMT5プラットフォームをフリーズさせます。本ツールは、このボトルネックを完全に回避しています。RAMベースのカスタムネイティブ計算機を内蔵した内部エンジンは、チャートを読み込んだりタイムフレームを変更したりするたびに、超高速の3Dグリッド探索を実行します。RSI期間(頻度)、SARステップ(加速度)、SAR最大値(制限速度)を同時にスイープし、プラットフォームを遅延させることなく、数万通りものパラメーターの組み合わせを絶対的
Scalper Vault は、スキャルピングを成功させるために必要なすべてを提供するプロフェッショナルなスキャルピング システムです。このインジケーターは、外国為替およびバイナリー オプションのトレーダーが使用できる完全な取引システムです。推奨される時間枠は M5 です。 システムは、トレンドの方向に正確な矢印シグナルを提供します。また、トップとボトムのシグナルとギャン マーケット レベルも提供します。 インジケーターは、プッシュ通知を含むすべてのタイプのアラートを提供します。 インジケータの購入後にご連絡ください。私の個人的な取引の推奨事項と素晴らしいボーナス指標を無料で共有します! 幸せで有益な取引をお祈りします!
このインジケーターは、反転ポイントと価格戻りゾーンを正確に表示します。     主要プレーヤー 。新たなトレンドが形成される場所を把握し、最大限の精度で意思決定を行い、すべての取引をコントロールします。 TREND LINES PRO インジケーターと組み合わせることで、その潜在能力を最大限に発揮します。 VERSION MT5 インジケーターが示す内容: 新しいトレンドの始まりに活性化する反転構造と反転レベル。 リスクと報酬の比率を最小限に抑えた利益 確定 と 損失停止の レベルの表示     RR 1:2   。 インテリジェントな削減ロジックによるストップロス。 指定されたインジケーターから 2 つのトレンド タイプの反転パターンを表示します。 指標: トレンドを追う   TREND LINES PRO   (世界的なトレンドの変化) TREND PRO   (クイックトレンド変更) シンプルで効果的   スキャナー   リアルタイムトレンド(新機能)。 マルチタイムフレームのインストゥルメント フィルタリング。 画面   利益     LOGIC AI信号の後。 当日プラス方
現在20%OFF! 初心者やエキスパートトレーダーに最適なソリューションです。 このインディケータは、エキゾチックペア・コモディティ・インデックス・先物など、あらゆるシンボルの通貨の強さを表示することに特化したインディケータです。金、銀、原油、DAX、US30、MXN、TRY、CNHなどの通貨の強さを表示するために、9行目にどのシンボルでも追加することができます。独自の機能を多数搭載し、新しい計算式を採用したため、ユニークで高品質、かつ手頃な価格のトレーディングツールとなっています。新しいトレンドやスキャルピングチャンスのトリガーポイントを正確に把握することができるため、あなたのトレードがどのように改善されるか想像してみてください。 ユーザーマニュアル:ここをクリック   https://www.mql5.com/en/blogs/post/708876 すべての時間枠に対応します。あなたはすぐにトレンドを見ることができるようになります! 新しいアルゴリズムに基づいて設計されているため、潜在的な取引の特定と確認がより簡単になります。これは、8つの主要通貨と1つのシンボルの強弱
Dynamic Forex28 Navigator - 次世代の Forex 取引ツール。 現在 49% オフ。 Dynamic Forex28 Navigator は、長年人気のインジケーターを進化させたもので、3 つの機能を 1 つにまとめています。 Advanced Currency Strength28 インジケーター (レビュー 695 件)  + Advanced Currency IMPULSE with ALERT (レビュー 520 件) + CS28 コンボ シグナル (ボーナス)。 インジケーターの詳細 https://www.mql5.com/en/blogs/post/758844 次世代の Strength インジケーターが提供するもの  オリジナルで気に入っていたすべての機能が、新機能と精度の向上によって強化されました。 主な機能: 独自の通貨強度計算式。 すべての時間枠でスムーズかつ正確な強度ライン。 トレンドの特定と正確なエントリーに最適です。 ダイナミックマーケットフィボナッチレベル (マーケットフィボナッチ)。 このインジケーターに固有
Advanced Supply Demand
Bernhard Schweigert
4.91 (299)
現在40%オフ 初心者にもエキスパートトレーダーにも最適なソリューション このインジケーターは独自の機能と新しい公式を多数内蔵しており、ユニークで高品質かつ手頃な取引ツールです。このアップデートでは、2つの時間枠ゾーンを表示できるようになります。より長いTFだけでなく、チャートTFとより長いTF(ネストゾーンを表示)の両方を表示できます。すべてのSupply Demandトレーダーの皆さんのお気に召すはずです。:) 重要情報の公開 Advanced Supply Demandの可能性を最大化するには、 https://www.mql5.com/ja/blogs/post/720245 にアクセスしてください。   エントリーまたはターゲットの正確なトリガーポイントを正確に特定できれば取引がどのように改善されるか想像してみてください。新しい基盤となるアルゴリズムに基づいて構築されているため、買い手と売り手の間の潜在的な不均衡をさらに簡単に特定できます。これは、最も強い需要と供給のゾーンと、過去のパフォーマンス(古いゾーンを表示)がグラフィカルに表現されるためです。これらの機能は、最適な
このインジケーターを購入すると、プロ仕様のトレードマネージャーを無料で差し上げます。 まず第一に、このトレーディングシステムがノンリペイント、ノンリドロー、ノンラグのインジケーターであることを強調する価値がある。これにより、手動取引とロボット取引の両方に理想的なものになっています。 オンラインコース、マニュアル、プリセットのダウンロード。 「スマートトレンドトレーディングシステム MT5」は、新規および経験豊富なトレーダー向けにカスタマイズされた包括的なトレーディングソリューションです。10以上のプレミアムインジケーターを組み合わせ、7つ以上の堅実なトレーディング戦略を備えており、多様な市場状況に対応する多目的な選択肢となっています。 トレンドフォロー戦略:トレンドを効果的に乗り越えるための正確なエントリーとストップロス管理を提供します。 リバーサル戦略:潜在的なトレンドの反転を特定し、トレーダーがレンジ相場を活用できるようにします。 スキャルピング戦略:高速で正確なデイトレードおよび短期取引のために設計されています。 安定性:すべてのインジケーターはノンリペイント、ノンリドロー、ノ
Super Reversal Indicator with Alert 概要 Super Reversal Indicator with Alert は、マルチタイムフレーム分析を用いて高確率の相場反転ポイントを特定するためのトレーディングツールです。ストキャスティクスのモメンタム、需給ゾーン、そして価格のリジェクションシグナルを組み合わせて分析を行います。 本インジケーターは、明確な視覚シグナルとリアルタイムアラートにより、トレーダーが市場の転換点を見極めるのをサポートします。 主な機能 マルチタイムフレーム ストキャスティクス分析 上位時間足のストキャスティクスを使用(ユーザー設定可能) モメンタムの変化やクロスシグナルを検出 エントリー精度を高めるための買われ過ぎ・売られ過ぎレベルを表示 反転リジェクションシグナル 重要な価格帯での強いリジェクションローソク足を検出 以下のポイントでの反転を識別 日足高値での売り反転 日足安値での買い反転 視認性を高めるため、チャート上に矢印を表示 需給ゾーン(Supply and Demand) H4およびD1の上位時間足から重要なゾーンを自動
The Super Arrow Indicator provides non-repainting buy and sell signals with exceptional accuracy. Key Features No repainting – confirmed signals remain fixed Clear visual arrows: green for buy, red for sell Real-time alerts via pop-up, sound, and optional email Clean chart view with no unnecessary clutter Works on all markets: Forex, gold, oil, indices, crypto Adjustable Parameters TimeFrame Default: "current time frame" Function: Sets the time frame for indicator calculation Options: Can be set
通貨強さウィザードは、取引を成功させるためのオールインワン ソリューションを提供する非常に強力な指標です。このインジケーターは、複数の時間枠のすべての通貨のデータを使用して、このまたはその外国為替ペアのパワーを計算します。このデータは、使いやすい通貨インデックスと通貨パワーラインの形式で表され、特定の通貨のパワーを確認するために使用できます。 必要なのは、取引したいチャートにインジケーターを接続することだけです。インジケーターは、取引する通貨の実際の強さを示します。このインジケーターは、トレンドに合わせて取引するときに有利に利用できる売買高の圧力の極値も示します。このインジケーターには、フィボナッチに基づく可能なターゲットも表示されます。 このインジケーターは、PUSH 通知を含むあらゆるタイプのアラートを提供します。 購入後ご連絡下さい。私の取引のヒントをあなたと共有し、素晴らしいボーナスインジケーターを無料で提供します! 幸せで有益な取引をお祈りします。
CRT Multi-Timeframe Market Structure & Liquidity Sweep Indicator Non-Repainting | Multi-Asset | MT5 Version Available MT5 Version:   https://www.mql5.com/en/market/product/162075 Full User Guide — explains what each feature does and why:   https://www.mql5.com/en/blogs/post/767525 Quick Start User Guide  — explains how to configure and in what order:  https://www.mql5.com/en/blogs/post/767540 Indicator Overview CRT Ghost Candle HTF Fractal is a complete institutional-grade market structure too
Scalping Entry Points - is a manual trading system that can adjust to price movements and give signals to open trades without redrawing. The indicator determines the direction of the trend by the central level of support and resistance. The dot indicator provides signals for entries and exits.  Suitable for manual intraday trading, scalping and binary options. Works on all time frames and trading instruments. The indicator gives several types of alerts. How to use the product The blue line det
説明書(ロシア語)  /  説明書 (英語)  /  バージョン MT5 主な機能: 売り手と買い手のアクティブなゾーンを表示します。 このインジケーターは、買いと売りの適切な最初のインパルスレベル/ゾーンをすべて表示します。これらのレベル/ゾーンがアクティブになると、エントリーポイントの探索が始まり、レベルの色が変わり、特定の色で塗りつぶされます。状況をより直感的に把握できるように、矢印も表示されます。 LOGIC AI - テンプレートをアクティブ化するときにエントリポイントを検索するためのゾーン(円)の表示 視認性を向上させるため、人工知能を用いて進入ポイントを探索したゾーンを表示する機能が追加されました。 より高い時間枠からのレベル/ゾーンの表示(MTFモード) より長い時間間隔でレベル/ゾーンを表示する機能を追加しました。また、インジケーターに自動トレンド検出機能(   TPSproTREND PRO   )を実装しました。 取引のための個別の専門的なステップバイステップのアルゴリズム このアルゴリズムは、トレンドの方向と逆方向の両方でデイトレードを行うために設計されていま
BTMM State Engine Pro is a MetaTrader 4 indicator for traders who use the Beat The Market Maker approach: Asian session context, kill zone timing, level progression, peak formation detection, and a multi-pair scanner from a single chart. It combines cycle state logic with a built-in scanner dashboard so you do not need the same tool on many charts at once. What it does Draws the Asian session range; session times can follow broker server offset or be set in inputs. Tracks level progression (L
Looking for a powerful yet lightweight swing detector that accurately identifies market structure turning points? Want clear, reliable buy and sell signals that work across any timeframe and any instrument? Buy Sell Arrow MT Swing is built exactly for that — precision swing detection made simple and effective. This indicator identifies Higher Highs (HH) , Higher Lows (HL) , Lower Highs (LH) , and Lower Lows (LL) with remarkable clarity. It is designed to help traders easily visualize market stru
Apollo Pips Generator は、トレンドの方向にシグナルを提供するインジケーターです。インジケーターは複数のエントリーポイントを提供するため、常に利益を得る取引機会を見つけることができます。スクリーンショットに注意してください。 スクリーンショットは、上部と下部を示す星の信号が付いたチャネルで表される他のツールと組み合わせたPipsGeneratorツールを示しています。この組み合わせにより、システムを適用する方法が複数提供されます。 購入後、無料で私の2番目のインジケーターを取得するために私に連絡してください。スクリーンショットで示したものとまったく同じシステムになります。 また、このシステムを使用して最良の結果を得る方法についても説明します。 どちらのツールも、プッシュ通知を含むすべてのタイプのアラートを提供します。 私はあなたに幸せな取引を望みます!
Meravith
Ivan Stefanov
5 (3)
マーケットメーカーのためのツール。 Meravith は次の機能を提供します: すべての時間足を分析し、現在有効なトレンドを表示します。 強気と弱気の出来高が等しくなる流動性ゾーン(出来高均衡)を強調表示します。 異なる時間足のすべての流動性レベルをチャート上に直接表示します。 テキスト形式の市場分析を生成し、参考情報として表示します。 現在のトレンドに基づいて目標値、サポートレベル、ストップロスを計算します。 取引のリスクリワード比を算出します。 口座残高に基づいてポジションサイズを計算し、潜在的な利益を推定します。 また、市場に大きな変化があった場合には警告を表示します。 インジケーターの主要ライン: 強気/弱気の出来高エグゾーストライン ― 目標値として機能します。 市場のトレンドを示すライン。市場が強気か弱気かによって色が変わり、トレンドのサポートとして機能します。主にその色が市場センチメントを示します。 出来高均衡ライン(Eq)。Eq(Volume Equilibrium)ラインはシステムの中核です。これは買い手と売り手の出来高のバランスポイントを表します。市場の流動性を示し
現在40%OFF! 初心者やエキスパートトレーダーのためのベストソリューション! このダッシュボードソフトウェアは、28の通貨ペアで動作しています。それは私達の主要な指標(高度な通貨の強さ28と高度な通貨インパルス)の2に基づいています。それは全体の外国為替市場の大きい概観を与えます。それは、すべての(9)時間枠で28の外国為替ペアのための高度な通貨の強さの値、通貨の動きの速度と信号を示しています。チャート上で1つのインディケータを使用して市場全体を観察し、トレンドやスキャルピングの機会をピンポイントで見つけることができたら、あなたのトレードがどのように改善されるか想像してみてください。 このインディケータには、強い通貨と弱い通貨の識別、潜在的な取引の識別と確認がより簡単になるような機能が搭載されています。このインディケータは、通貨の強さや弱さが増加しているか減少しているか、また、すべての時間枠でどのように機能しているかをグラフィカルに表示します。 新機能として、現在の市場環境の変化に適応するダイナミックなマーケットフィボナッチレベルが追加され、すでに当社のAdvanced
Advanced version of CyberZingFx Volume Plus, the ultimate MT4 indicator for traders seeking highly accurate buy and sell signals. With an additional strategy and price action dot signals that enhances its effectiveness, this indicator offers a superior trading experience for professionals and beginners alike. The CyberZingFx Volume Plus Advanced version combines the power of volume analysis and historical price data with an additional strategy, resulting in even more precise and reliable signals
Matrix Arrow Indicator MT4
Juvenille Emperor Limited
5 (3)
マトリックスアローインジケーターMT4は、すべてのシンボル/商品(外国為替、商品、暗号通貨、インデックス、株式)で使用できる100%再描画されていないマルチタイムフレームインジケーターに続くユニークな10in1トレンドです。マトリックスアローインジケーターMT4は、初期段階で現在のトレンドを判断し、最大10の標準インジケーターから情報とデータを収集します。 平均方向移動指数(ADX) 商品チャネルインデックス(CCI) クラシック平研アシキャンドル 移動平均 移動平均収束発散(MACD) 相対活力指数(RVI) 相対力指数(RSI) 放物線SAR ストキャスティクス ウィリアムズのパーセント範囲 すべてのインジケーターが有効な買いまたは売りシグナルを与えると、対応する矢印がチャートに印刷され、次のろうそく/バーの開始時に強い上昇トレンド/下降トレンドを示します。ユーザーは、使用するインジケーターを選択し、各インジケーターのパラメーターを個別に調整できます。マトリックスアローインジケーターMT4は選択されたインディケーターからのみ情報を収集し、それらのデータのみに基づいてアローを印刷
作者のその他のプロダクト
The Super Cross Trend indicator is designed for trend and signal trading. This indicator generates trend signals. It uses many algorithms and indicators to generate this signal. It tries to generate a signal from the points with the highest trend potential. This indicator is a complete trading product. This indicator does not need any additional indicators. You can only trade with this indicator. The generated signals are displayed on the graphical screen. Thanks to the alert features you can ge
Box martingale system is an indicator designed to trade martingale. This indicator sends a signal from the highest point where the trend is likely to return. With these signals the user starts the trades. These signals appear in the form of a box. The user can see from which point the signal is given. The important thing in trading martingale is to find a good starting point. This indicator provides this starting point. Trade rules Start processing when the first trade signal arrives. The impor
Face smiling trend indicator is an oscillator designed to search for turning points. Face smiling trend indicator represents an oscillator that uses in his work an average price for a certain period and is designed to determine the price reversal points. Face smiling trend indicator oscillates between 0.00 (oversold) and 105 (overbought) values depending upon market conditions. Red bars suggest bearish pressure and blue bars bullish pressure. Typically, a reversal of the trend occurs when achiev
This indicator uses Donchian channel and ATR indicators. This trend tracking system uses historical data to buy and sell. This indicator does not repaint. The point at which the signal is given does not change. You can use it in all graphics. You can use it in all pairs. This indicator shows the input and output signals as arrows and alert. Open long deals on blue arrows Open short deals on red arrows When sl_tp is set to true, the indicator will send you the close long and close short warnings.
Super oscillator indicator is an oscillator designed to calculate trend reversal points. A set of bar calculations and a set of algorithms to calculate trend reversals. Level probing system with high probability trends. All of these features combine to make it easier for investors to find trends. Suggestions and Features There are two levels on the super oscillator indicator. They are at levels of 0.5 and -0.5. The oscillator bar should be below -0.5 to find the upward trend. And a blue color t
The High and Low Points indicator is designed to calculate potential order points. The main feature of this indicator is to specify the points that the price can not exceed for a long time. The market always wants to pass points that can not pass. It is necessary to place an order waiting for this point indicated by this indicator. Is an indicator that constitutes many EA strategies. Designed for manual trading. Transaction Strategies High point buy stop order Low point sell stop order For exam
Are you tired of channeling? This indicator is designed to draw channels. Triple graphics channels, automatically installs 3 different graphics channels. These channels are shown on a single graphic. These channels are calculated by a number of different algorithms. Automatically draws on the screen. You can select three time zones. Parameters Period1 - from here you can select the first period. It can be selected from 1 minute time period to monthly time period. Period1_Channel_Color - period1
‌This indicator indicates potential entry points. Rsi indicator and console wax combination. In addition to the signals in the graphic arrows, text comments are also used. Features Works on any currency pairs. It works in all periods. Sensitivity setting. You can set the signal frequency. Use recommended standard settings. ‌The greatest feature of this display is the possibility of manual martingale. The signal intensity region tends to go in the direction of the signal. Works on all charts. An
Pivot trend indicator is a trend indicator that uses standard pivot calculation and some indicators. The purpose of the indicator is to calculate the possible trends using the pivot point. And to give the user an idea about trend direction. You can use this display as a trend indicator. Or with other indicators suitable for your strategy. Features The green bar represents the upward trend. The red bar represents the downward trend. The blue pivot point represents the upward trend. The yellow pi
Strong trend indicator is a special indicator designed to capture healthy signals. There are lines showing the signal of the indicator and the power of buying and selling. The signal line is yellow. The green lines are Buy lines. The ones that are brown are Sell lines. The green line must close above the yellow line to perform the operation. The brown line must close above the yellow line to sell. The important line is the first one that closes above the yellow line. If the first line is green,
The ”Trend Guess” is a complex software that does not involve the MACD, RSI or moving averages. It adapts itself to current market conditions using complicated algorithms based on price action and out custom indicators. The indicator will gives you trading signals Buy or Sell stop loss levels indicated in the popup alert window and graphically. You have to do is to press buy or sell button whenever you get a signal Important Rules Identify a current long term trend. Example – if you trade on a
HC candlestick pattern is a simple and convenient indicator able to define candle patterns.‌ Candlestick charts are a type of financial chart for tracking the movement of securities. They have their origins in the centuries-old Japanese rice trade and have made their way into modern day price charting. Some investors find them more visually appealing than the standard bar charts and the price action is easier to interpret. Hc candlestick pattern is a special indicator designed to find divergence
The Stubborn Scalper indicator can run in any currency pair and at any time interval. The larger the time interval, the less false signals are obtained. Always choose a larger time interval for healthy signals. Trade rules Turn on the Buy action when the Stubborn Scalper indicator turns blue and the trend up warning is displayed. The Stop Loss is set to the level at the end of the green circle. Turn off the operation when the Stubborn Scalper indicator is green or red. Turn on the Sell action w
Big Trend Signal   indicator is designed for trend and signal trading. This indicator generates trend signals.  It uses many algorithms and indicators to generate this signal. It tries to generate a signal from the points with the highest trend potential. This indicator is a complete trading product. This indicator does not need any additional indicators.  You can only trade with this indicator. The generated signals are displayed on the graphical screen.  Thanks to the alert features you can ge
This indicator is designed to find the difference in price and indicator. This indicator uses various indicators. These indicators RSI, Macd, Momentum, RVI, Stochastic, Standard deviation, Derivative, Williams, and custom. You can use these indicators by selecting the indicator type section. This indicator shows the price and indicator difference on the screen. Indicators are individually selectable. You can use the custom type to enter the desired parameters. The user is alerted with the alert
Undefeated trend indicator, an indicator that uses MacD and Bollinger bands. It is a coded indicator to find trends. It finds these trends by its own algorithm. This indicator requires visual monitoring. It does not give any warning because it needs visual follow-up. The main trendline should turn down to find the down trend. The main trend line should go under the white line and then go under the yellow line. The main trendline should turn upward to find the upward trend. The main trend line sh
Super signal series magic arrows is an indicator that generates trade arrows. It generates trade arrows with its own algorithm. These arrows give buying and selling signals. The indicator certainly does not repaint. Can be used in all pairs. Sends a signal to the user with the alert feature. Trade rules Enter the signal when the buy signal arrives. In order to exit from the transaction, an opposite signal must be received. It is absolutely necessary to close the operation when an opposite signa
This indicator is designed to filter trends. Using the RSI indicator we know. It is aimed to confirm trends with this indicator. Can be used alone. It can be used as an indicator to help other indicators. He is already a trend indicator. You can confirm the signals given by other indicators according to your strategy with this indicator. The RSI Trend Filtering indicator confirms trends using a number of complex algorithms. Red below trend zero represents the downward trend. If trend is blue abo
Colored trend indicator is a trend indicator that uses Average True Range and Standard Deviation indications. It is aimed to find more healthy trends with this indicator. This indicator can be used alone as a trend indicator. Detailed review 4 different trend colors appear on this indicator. The blue color represents the upward trend. The dark blue color has a tendency to decline after rising from the rising trend. The red color represents the declining trend. The dark red color has a tendency
Super signal series trend arrows is an indicator designed to generate trading signals. This indicator uses a number of different indicators and generates a signal using a number of historical data. It generally tries to calculate the trend return points. These trend returns may be sometimes very large, sometimes small. The investor should act with the belief that the signal may be small. Monthly median produces 5 to 10 signals. These signals vary according to market conditions. The signals do no
The EMA Trend indicator is a trend indicator using two moving averages. These two moving average is the main trend indicator with 89 EMA. 89 EMA is generally regarded as a trend in the Forex market. The second moving average is 49 EMA. A trend was created using two moving averages. You can use this display alone as a trend indicator. Or with other indicators suitable for your strategy. This indicator sends a warning every new trend starts. Features You can select and edit the periods. Time fram
Every successful trader knows what support and resistance spots are working. And always know that these points need to be kept in mind. They always trade according to this point. The support and resistance point indicator operates in two different modes. The first is the standard support and resistance points we know. The second is Fibonacci levels. This indicator automatically calculates and displays the support and resistance points on the screen. Features You can select the time frame you wa
Real Trend Lines is an indicator that calculates trends using a set of channels and using a set of algorithms. This indicator helps to find trend return points. It generally represents an oscillator. This trend tracking system helps the investor to understand small or large trends and determines the direction according to it. Trending features Up trend Rule 1 - yellow trend line should be below zero level. Rule 2 - the yellow trend line should be in the green and orange channel. Rule 3 - the tr
Super signal series mystery arrows is an indicator designed to generate trading signals. This indicator uses a number of different indicators and generates a signal using a number of historical data. Currency pairs:  Any Time interval:  M5, M15, M30. Suggested M5 Work with at least 20 pairs Parameters AlertsOn -  send alerts. If this feature is activated, it will be activated in other warning properties. AlertsMessage -  send a message AlertsSound -  sound alert setting AlertsEmail -  email ale
Super Trend Bars is a trend finding indicator. It tries to find the trends that are most likely to trend. A set of indicators and a set of algorithms. Trend probability changes color when it finds a high trend. The red color represents the declining trend. The lime color represents the upward trend. Super Trend Bar changes color when it finds a trend. Features This indicator is a trend indicator by itself. It can operate without the need for additional indicators. When you see the first lime co
The super oscillator trading system is a trend finding tool. This system consists of a few indicators and a few algorithms. The aim of this indicator is to direct the investor to find healthy trends. Trade Rules This indicator has two channel lines. These channels are red lines below zero and above zero. There is a line in two places to process. These are blue lines. There is one trend line, the yellow line. Up trend rules Rule 1 - the yellow trend line should close below the red line below the
The trend beads indicator is software that does not include trend indicators such as moving average, Bollinger bands. This indicator works entirely with price and bar movements. The purpose of the indicator is to calculate the most likely trends. To assist the user in determining trend trends. The user determines the trend direction with the colors on the screen. You can use this indicator alone as a trend indicator. Or with other indicators suitable for your strategy. Trade Rules Rising trend
The I Return Signal indicator is a product designed for signal trading. This indicator works by using a number of factors such as a set of indicators, recent history data, bar combinations, price movements, custom filtering system and various algorithms. It uses all of these factors at the same time and generates turn signals. The signals are generated by calculating from the highest possible points of the signal. This indicator is easy to use and understandable. Thanks to the warning features,
Multiple RSI indicator works based on the standard RSI indicator. This indicator will display the RSI indicator from different timeframes on one screen. You will see the RSI indicator for all timeframes on one screen. This indicator saves you from constantly changing charts. At the same time you can analyze the operations of other graphs relative to each other. Features This indicator shows the RSI graph of the timeframe you are working on and the upper timeframe graphs. For example, if you run
The Signal MACD product is an indicator that works with the standard MACD indicator. This indicator is designed to do signal trading using the objective MACD indicator and a set of algorithms. This indicator can be used both as an oscillator and as a signal producing product. So you can use this indicator in two goal. When the indicator finds a signal, it shows arrow marks on the oscillator. These arrows allow investors to trade. Trade Rules "Buy" action when you see a green arrow and receive a
フィルタ:
レビューなし
レビューに返信