Full VWAP
- インディケータ
- バージョン: 1.71
- アップデート済み: 24 1月 2022

このプロジェクトが好きなら、5つ星レビューを残してください。
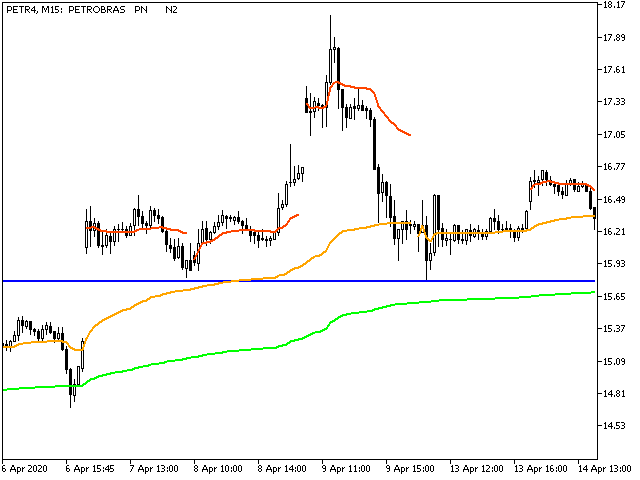
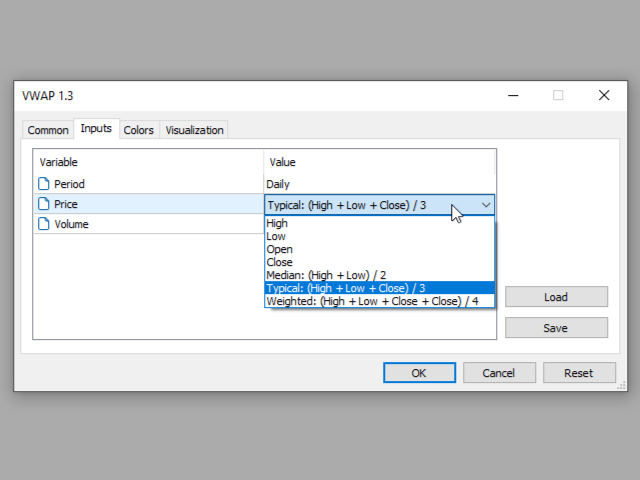
ボリュームウェイト平均価格は、合計ボリュームに取引された値の比率です
特定の時間の地平線上に取引. 平均価格の尺度です。
株式が取引地平線上に取引されている. VWAPは、多くの場合、
投資家の取引ベンチマークは、可能な限り受動を目指す
実行。
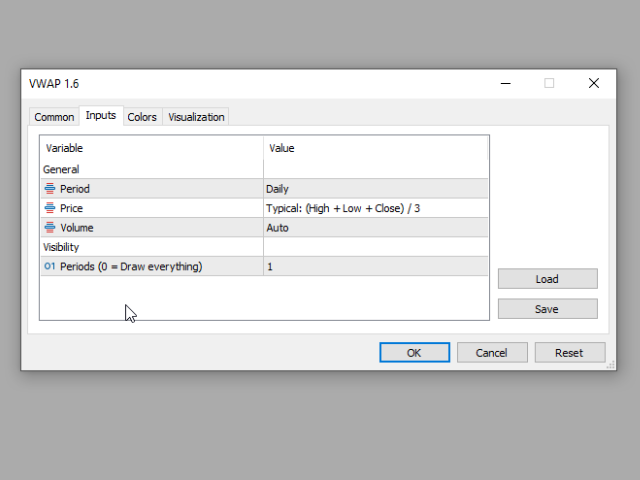
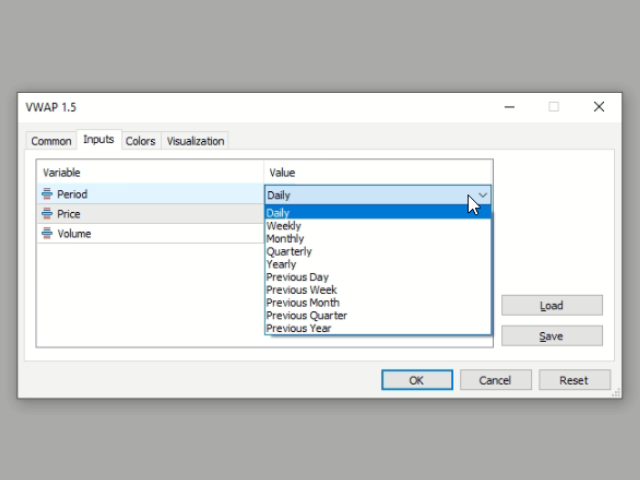
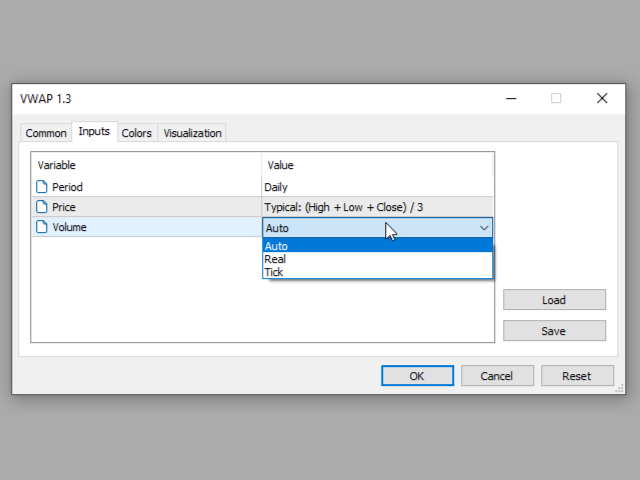
このインジケータを使用すると、VWAPを以下のように描画できます。
- 現在の日。
- 現在の週。
- 現在の月。
- 現在の四半期。
- 現在の年。
または:
- 前の日。
- 前週。
- 前の月。
- 前の四半期。
- 年末年始


#