LineSyncMirrorCharts

4

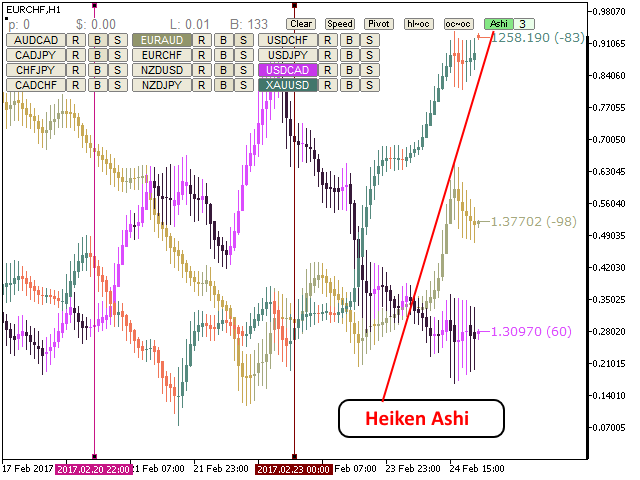
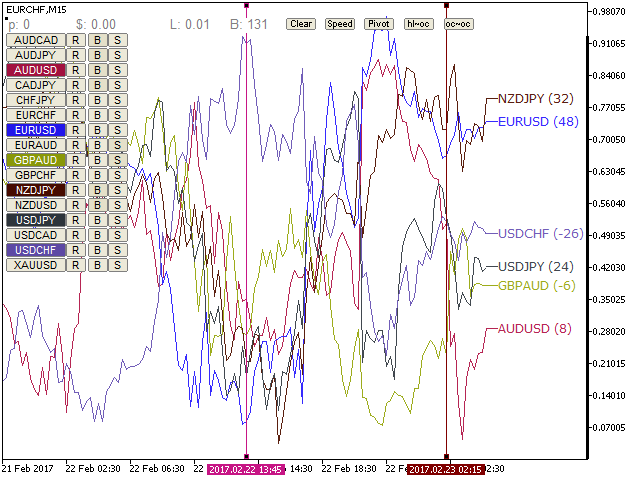
Indicator of correlation and divergence of currency pairs - all pairs on one price chart. It shows all pair that are open in the terminal. Full synchronization of all charts.

Does not work in the tester!

MT4 version


Advantages

Traders who use multicurrency trading strategies can visually observe the price movement of selected pairs on a single price chart in order to compare the parameters of their movement. This is an advanced and extended version of the OverLay Chart indicator

It is quite effective assistant for multicurrency trading - "paired trading" and "portfolio trading". It helps identify the emerging movements in advance.

The method consists of two strategies. The first one is designed to search for divergences between the currency pairs after a release of high-impact news or at the time the trading floors open. The logic of such operation is extremely simple. It is based on the assumption that once the "storm" in the market subsides, the delta between the price of instruments will begin to converge. It is recommended to pay attention to strong support and resistance levels, in order to avoid buying right under a strong resistance and selling at the very bottom.

Identification of false breakouts of the support/resistance levels.


Features

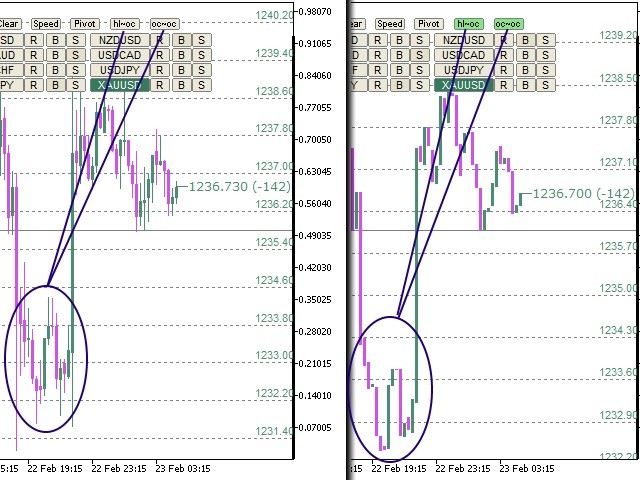
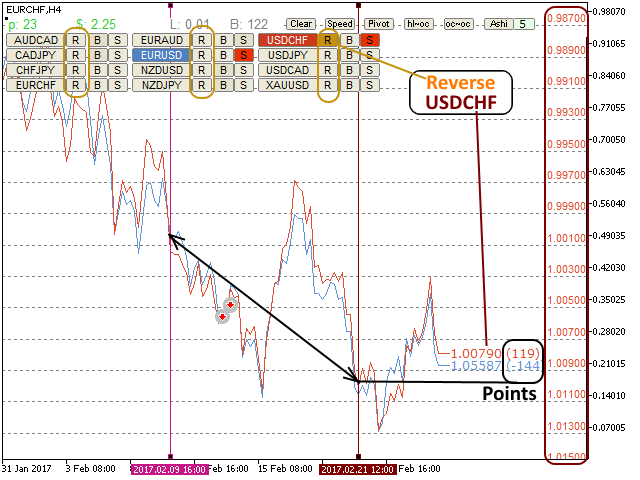
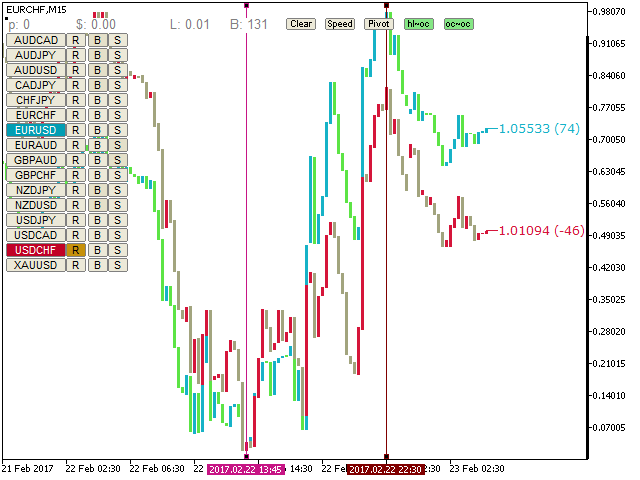
  • Invert any pair on the chart
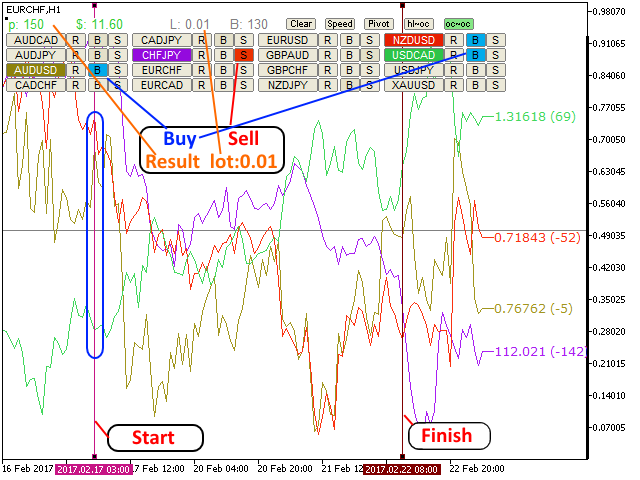
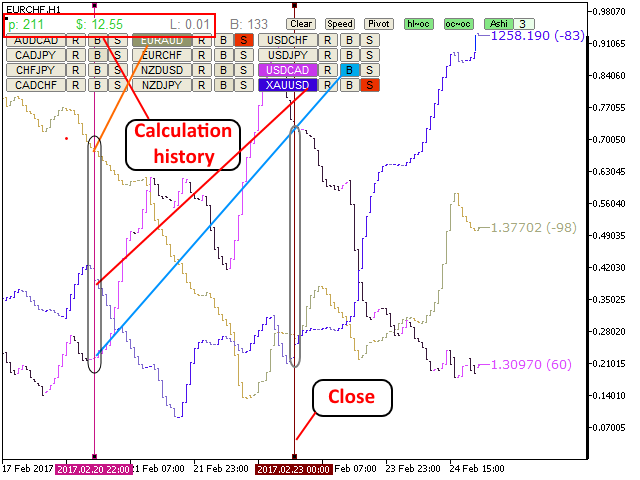
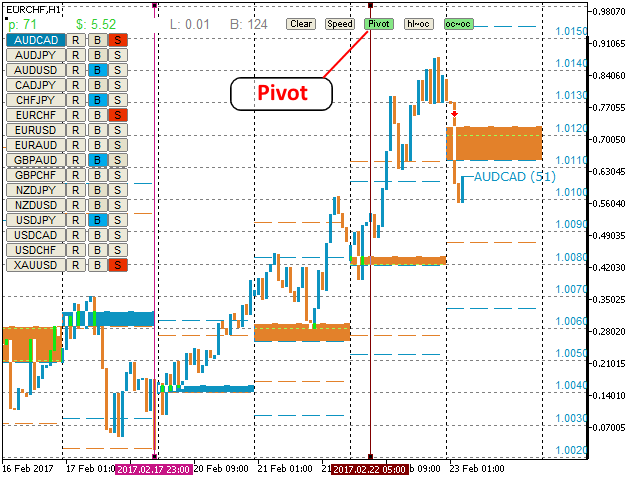
  • Identify the regularities in history in the form of virtual buys or sells of multiple pairs
  • Calculates the distance in points the price had passed on the selected interval
  • Visually determine the strength of the currency movement
  • Select different display color for each currency pair
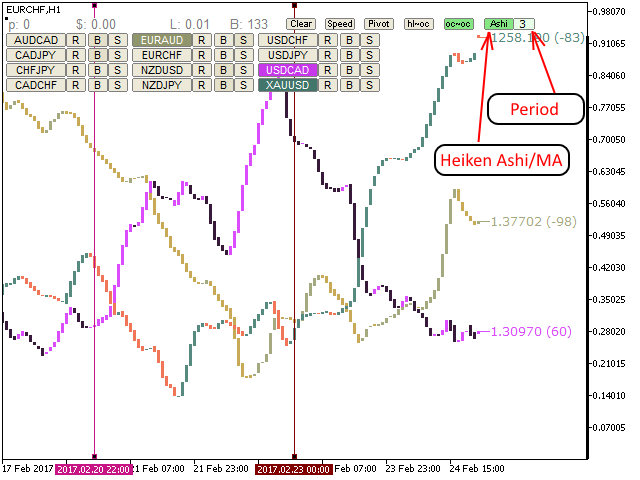
  • Display style: Bars, Candles, Lines, Heiken Ashi
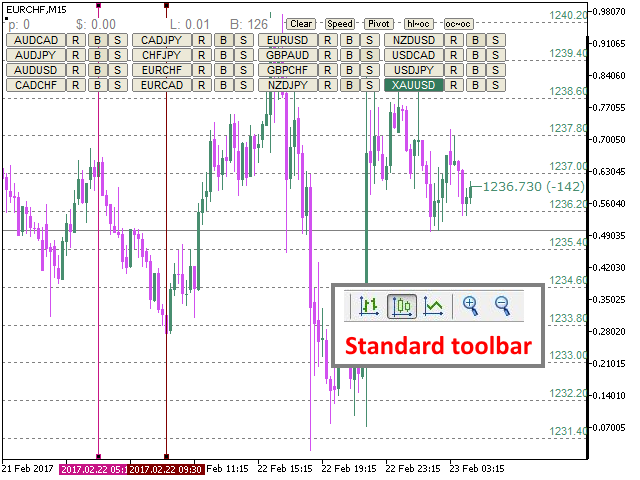
  • Synchronization of timeframes and scrolling of all charts
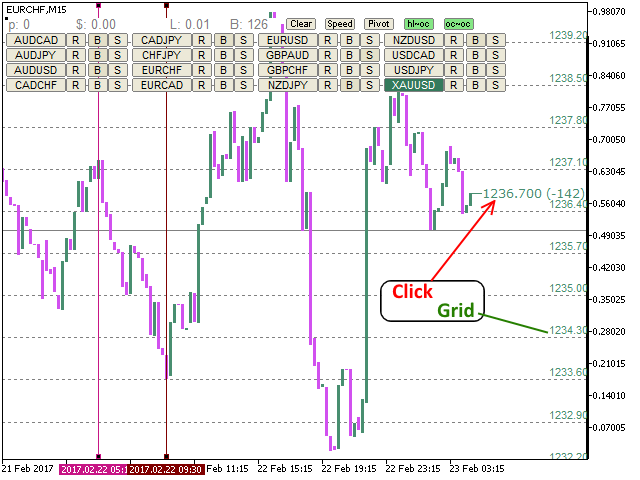
  • Ability to trade any pair on one main chart
  • Alert when exceeding the price change in "Points" per "Time"

It can be conveniently used in conjunction with the "CorrelatePairs" indicator


Warning

The indicator should be placed on one chart!

Does not work in the tester!

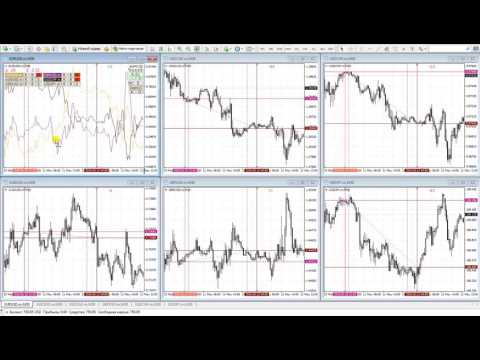
See the video for more details

The EA used in the video is attached in the Comments section (attach to one chart only!)

レビュー 1
Peiro Rahbari
555
Peiro Rahbari 2024.12.13 09:08 
 

very good thank you mr vitaly

おすすめのプロダクト
Price Magnet — Price Density and Attraction Levels Indicator Price Magnet is a professional analytical tool designed to identify key support and resistance levels based on statistical Price Density. The indicator analyzes a specified historical period and detects price levels where the market spent the most time. These zones act as “magnets,” attracting price action or forming a structural base for potential reversals. Unlike traditional Volume Profile tools, Price Magnet focuses on price-time d
Unlock the power of Smart Money Concepts (SMC) with the cleanest FVG indicator on the market. Smart FVG Pro is not just another gap detector. It is designed for professional traders who need to filter out noise and focus on high-probability reversal zones. Unlike standard indicators that clutter your chart with every minor gap, Smart FVG Pro uses advanced filtering logic (Trend + Volatility) and a unique "Smart Mitigation" system to automatically remove invalidated zones, keeping your chart clea
Trading Room Indicator is a professional market-structure tool built to give traders a clear, complete trading framework — combining CPR levels, dynamic targets, and trend direction in one clean view. Instead of guessing direction or overloading the chart with indicators, Trading Room Indicator focuses on what actually matters : levels, direction, and potential price expansion. What This Indicator Provides CPR Structure BUY level SELL level Pivot Point (PP) Designed to highlight equilibrium
Main purpose:   "Pin Bars"   is designed to automatically detect pin bars on financial market charts. A pin bar is a candle with a characteristic body and a long tail, which can signal a trend reversal or correction. How it works:   The indicator analyzes each candle on the chart, determining the size of the body, tail and nose of the candle. When a pin bar corresponding to predefined parameters is detected, the indicator marks it on the chart with an up or down arrow, depending on the directi
FREE
ZumikoFX Trading Stats - Professional Account Dashboard Overview ZumikoFX Trading Stats is a comprehensive, real-time account monitoring dashboard designed for serious traders who need complete visibility of their trading performance. This indicator displays all crucial trading statistics in an elegant, easy-to-read panel positioned in the top-right corner of your chart. Key Features Complete Account Monitoring Balance & Equity - Real-time account status with current balance and equity includ
FREE
この情報インジケーターは、アカウントの現在の状況を常に把握したい人にとって役立ちます。 VERSION MT 4 -   More useful indicators このインジケーターには、ポイント、パーセンテージ、通貨での利益、現在のペアのスプレッド、現在の時間枠でバーが閉じるまでの時間などのデータが表示されます。 チャート上に情報線を配置するには、いくつかのオプションがあります。 価格の右側 (価格の後ろにあります)。 コメントとして (グラフの左上隅に); 画面の選択した隅。 情報区切り記号を選択することもできます。 | / \ # このインジケーターは使いやすく、非常に有益です。設定で不要な情報項目を無効にすることも可能です。 設定 外観の種類     - 情報行の表示タイプ。次の 3 つのオプションがあります。 価格に従ってください     - 価格に従う。 コメントとして     - コメントとして; 画面の選択した隅に     - 画面の選択した隅にあります。 添付用グラフコーナー     - 表示タイプを選択した場合 画面の選択されたコーナーでは、この項目を使用して
FREE
Double Correlation indicator (free) plots two windowed correlations in a separate window.  the size of window is taken as input before the two symbols to correlate to. Two symbols are taken as an input parameters as well as period length. and the two correlations are computed with the currently shown symbol ex: input GBPJPY and AUDNZD.  current symbol EURUSD then the following will be computed corr(EURUSD,GBPJPY) and corr(EURUSD,AUDNZD) The indicator can be useful to run a multi-symbol pair trad
FREE
Hello, This is an easy symbol change panel. This is a full version of Symbol1 2Changer Symbols must be active on your Market Watch list. Parameters: SymbolList - you can add more symbols with a comma(,) ratio - change the size LineNumber - you can set that how many symbols are displayed per line. button_width - modify the button size button_height - modify the button size Thank you.
High Low Open Close
Alexandre Borela
4.98 (43)
このプロジェクトが好きなら、5つ星レビューを残してください。 このインジケータは、指定されたためのオープン、ハイ、ロー、クローズ価格を描画します 特定のタイムゾーンの期間と調整が可能です。 これらは、多くの機関や専門家によって見られた重要なレベルです トレーダーは、彼らがより多くのかもしれない場所を知るために有用であり、 アクティブ。 利用可能な期間は次のとおりです。 前の日。 前週。 前の月。 前の四半期。 前年。 または: 現在の日。 現在の週。 現在の月。 現在の四半期。 現年。
FREE
"2nd To NoneFX Scalper" is one powerful indicator which you can use on any timeframe. The accuracy is in between 90% - 95% can be more. The indicator is 100% non repaint so it doesn't repaint at all. When the arrow comes out wait for the candlestick to close the arrow won't repaint/recalculate or move. The indicator works with all volatility indices,step index, Boom & Crash(500 & 1000) and all currency pairs. You can change settings of the indicator. For great results find the trend of the pair,
RSI Currency Strength Meter is a powerful and elegant multi-currency indicator that measures the real-time relative strength of the 8 major currencies using RSI logic. By calculating the smoothed performance of each currency across its major pairs and applying the RSI formula, it delivers clean and responsive strength lines that make it easy to spot which currencies are truly strong or weak at any moment. This indicator is particularly useful for visualizing currency correlations and divergence
VFI Quantum
Nikita Berdnikov
5 (1)
Introducing VFI (Volume Flow Indicator) – a trading indicator that analyzes the relationship between volume and price movement to identify key trading opportunities. The indicator displays the strength and direction of volume flow, providing clear signals about potential entry and exit points. Signals are formed based on zero line crossovers, crossovers between the VFI line and its exponential moving average (EMA), and when the indicator exits overbought and oversold zones. Attention! This stra
FREE
RBreaker Gold Indicatorsは、金先物の短期日内取引戦略であり、トレンドフォローと日内反転の2つの取引手法を組み合わせたものです。トレンド相場での利益を捉えるだけでなく、相場が反転した際には迅速に利確し、その流れに沿ってポジションを反転させることができます。 この戦略は、アメリカの雑誌『Futures Truth』において、15年連続で最も収益性の高い取引戦略トップ10に選ばれた実績を持ち、非常に長いライフサイクルを誇り、現在も国内外で広く使用・研究されています。 本インディケーターは、2026年の金先物の値動きに対応し、14日間のATR指標に基づいて、ブレイクアウト係数A、観察係数B、リバーサル係数Rをより合理的な値で定義しています。非常に優れたインディケーターであり、安定的な年間収益を実現しています。ぜひおすすめします〜
DQN Gold XAUUSD is a neural network trading indicator for MetaTrader 5 designed to analyze Gold (XAUUSD) market conditions and display BUY and SELL signals directly on the chart. The indicator evaluates market behaviour using a Deep Q-Network (DQN) reinforcement learning model trained on historical price data. The system analyzes the current market structure and automatically selects the most appropriate strategy according to detected market conditions. Model Logic The neural network model was t
Your Trend Friend
Luigi Nunes Labigalini
5 (1)
The trend is your friend! Look at the color of the indicator and trade on that direction. It does not  repaint. After each candle is closed, that's the color of the trend. You can focus on shorter faster trends or major trends, just test what's most suitable for the symbol and timeframe you trade. Simply change the "Length" parameter and the indicator will automatically adapt. You can also change the color, thickness and style of the lines. Download and give it a try! There are big movements w
Range Directional Force Indicator – Designed for You to Optimize! The Range Directional Force Indicator is a cutting-edge tool designed to empower traders by visualizing market dynamics and directional strength. Built to offer insights into market trends and reversals, this indicator is an invaluable asset for traders seeking precision in their strategies. However, it is important to note that this indicator is not optimized, leaving room for you to tailor it to your unique trading preferences.
EPo-CreW Forex Super ORB-H4 インジケーターへようこそ! 本ガイドでは、市場の最初の4時間のオープニングレンジに基づいて、高確率のトレード機会を特定するためのこの強力なツールの使い方を解説します。 初心者の方から経験豊富なトレーダーまで、このシステムはより高い自信と一貫性を持って取引する手助けとなります。 これはデモ製品です。インストール日から30日後に有効期限が切れます。フルバージョンはこちら: https://www.mql5.com/en/market/product/160926?source=Site OR https://t.me/Fundamental_fx 取引:すべての通貨、金(GOLD)とBTCUSD NB: M5 タイムフレームに切り替えることを確認してください。このインジケーターを使うのに最適なタイムフレームです。 トレーディング戦略 戦略1:ブレイクアウト & リトレースメント(メイン) SELL(売り)セットアップ: 価格が青いラインを上にブレイクする(高値ブレイク) ゴールドの BREAKOUT 矢印が表示される 価格が再び青い
FREE
Haven FVG Indicator 2.0 - 市場の不均衡分析の新次元 大幅なアップデート、 Haven FVG Indicator 2.0 の登場です!これはフェアバリューギャップ(FVG)を扱うためのプロフェッショナルなツールであり、これまで以上に強力になりました。今回のバージョンでは、本格的なマルチタイムフレーム(MTF)分析と高度な通知システムを実装しました。これにより、チャートを切り替える時間を無駄にすることなく、スマートマネーコンセプト(SMC)に基づいたトレードを最高精度で行うことが可能になります。 他の製品を見る - > こちら . フェアバリューギャップ(FVG)は、市場が効率的でなかった場所、つまり「スマートマネーの痕跡」を表しています。バージョン2.0では、これらの痕跡を現在のチャート上だけでなく、上位足(H1、H4、D1)でも同時に確認できるため、市場のコンテキストをグローバルに把握することができます。 バージョン2.0の新機能 マルチタイムフレーム(MTF)分析 — 上位足のFVGを現在のチャート上に直接表示できるようになりました。M5やM15でトレー
FREE
Golden Spike Premium
Kwaku Bondzie Ghartey
5 (1)
Golden Spikes Indicator Technical indicator for synthetic indices trading on M1 timeframe. Compatible with Boom/Crash indices on Deriv platform and Gain/Pain indices on Weltrade platform. send me A private  message to receive trade ASISTANT EA.. booklet guide:  https://drive.google.com/file/d/1knQJqGHZSP5eQN24ndRz2ayZVCst6XhN/view?usp=sharing Also check my premium spikes bot: https://www.mql5.com/en/market/product/142350 Features Uses Parabolic SAR, RSI, and Bollinger Bands analysis Three risk
The Candle High Low Exit indicator uses the highest high and the lowest low of a range to draw trailing stop lines (orange under buys, magenta over sells) that advance with the trend until the trend changes direction.  Moreover, the trailing stop lines are generated to support the order’s trend direction (long or short):  In an upward trend, the long trailing stop line (orange line under buy) appears and advances upward until the close crosses under the line.  In a downward trend, the short trai
FREE
STAMINA HUD – Advanced Market & Trend Dashboard (MT5) STAMINA HUD   is a professional   market information panel   designed for traders who want   clarity, speed, and control   directly on the chart. It provides a   clean heads-up display (HUD)   with essential market data and   multi-timeframe trend direction , without cluttering the chart or generating trading signals. What STAMINA HUD Shows   Current Price   Spread (in real pips)   Today High–Low range (pips)   Average D
FREE
Candle Perspective Structure Indicator MT5 is a simple indicator that defines and displays the candlestick structure of the market. This indicator will suit both experienced traders and beginners who find it difficult to follow the structure visually. If you want to see more high-quality products or order the development/conversion of your own products, visit my partners' website: 4xDev Get 10% OFF on manual strategies automation services or indicator development/conversion services at 4xDev
FREE
Introduction to the Manual Backtesting Indicator on MQL5 The MetaTrader platform provides an excellent backtesting tool for evaluating Expert Advisors (EAs). However, when it comes to manually backtesting a strategy to assess its effectiveness, this tool has some limitations: You cannot manually draw zones or trend lines while in backtesting mode. You cannot switch timeframes to check time alignment. For example, if my strategy requires additional confirmation from a higher timeframe (HTF), this
The selective pin bar is designed to identify reversals. To use the selective pin bar effectively, traders typically look for Strong Rejection: The tail of the pin bar should extend significantly beyond the surrounding price action. It indicates that there was a sharp rejection of higher or lower prices during the trading period. A strong rejection suggests that the market sentiment may be changing.
FREE
Multi Currency Strength Dashboard Mini(無料)– MetaTrader 5 用 通貨強弱メーター Multi Currency Strength Dashboard Mini は MetaTrader 5 向けの無料インジケーターで、 8つの主要通貨 (USD / EUR / GBP / JPY / CHF / CAD / AUD / NZD)の相対的な強弱を、見やすいダッシュボードでリアルタイム表示します。 目的:強い通貨・弱い通貨を数秒で把握し、ウォッチリスト作成や「 強い通貨 vs 弱い通貨 」の組み合わせ選定を効率化します。 主な機能(Mini 無料版) 8主要通貨 の強弱を1つのパネルに表示。 強弱バー +パーセンテージの視覚的ダッシュボード。 自動リアルタイム更新(軽量更新)。 全タイムフレーム対応 (計算は選択した時間足で実行)。 多くのブローカーに対応(一般的なシンボルのサフィックスを考慮)。 仕組み Market Watch に表示されている主要FXペアの価格変化をもとに通貨ごとの強弱を算出し、0〜100に正規化してランキング形式
FREE
NOTE: Turn Pattern Scan ON This indicator identifies Swing Points, Break of Structure (BoS), Change of Character (CHoCH), Contraction and Expansion patterns which are plotted on the charts It also comes with Alerts & Mobile notifications so that you do not miss any trades. It can be used on all trading instruments and on all timeframes. The non-repaint feature makes it particularly useful in backtesting and developing profitable trading models. The depth can be adjusted to filter swing points.
FREE
BreakOutLines Pro
Magdalena Estefania Colonna
BreakoutLines Pro — Pivot Breakout Levels for XAUUSD BreakoutLines Pro is a precision indicator designed specifically for Gold (XAUUSD) traders who operate with a structured approach and well-defined risk. Based on automatic pivot detection, it identifies the most relevant swing highs and lows on the chart and projects complete trading setups—Entry, Stop Loss, and up to three Take Profit levels—directly onto the price, with value labels for immediate reference. How Does It Work? The indicato
概要 このインジケーターは、クラシックな ドンチャンチャネル を強化したバージョンで、実践的なトレード機能を追加しています。 標準の3本線(上限、下限、中央線)に加え、 ブレイクアウト を検出し、チャート上に矢印で視覚的に表示します。また、チャートを見やすくするために、 現在のトレンド方向と逆側のラインのみを表示 します。 インジケーターの機能: 視覚的シグナル :ブレイクアウト時にカラフルな矢印を表示 自動通知 :ポップアップ、プッシュ通知、Eメール RSIフィルター :市場の相対的な強弱に基づいてシグナルを検証 カスタマイズ可能 :色、ラインの太さ、矢印コード、RSI閾値など 動作原理 ドンチャンチャネルは次のように計算します: 上限線 :直近N本のクローズ済みローソク足の最高値 下限線 :直近N本のクローズ済みローソク足の最安値 中央線 :最高値と最安値の平均値 上方ブレイクアウト は終値が上限線を超えたときに発生し、 下方ブレイクアウト は終値が下限線を下回ったときに発生します。 インジケーターは以下を行います: 3本のドンチャンラインを描画 方向転換後の最初のブレイクアウト
FREE
概要 Candle Timer Countdown Pro は、現在のローソク足が終了するまでの残り時間を、滑らかで正確なカウントダウンとして表示します。さらに、円形のプログレスアーク(進行表示)を組み合わせることで、残り時間を瞬時に視覚的に把握できます。 ティック間で停止したり、時間がずれてしまう他のタイマーとは異なり、本インジケーターはサーバー時間の補間(Server Time Interpolation)を使用し、M1 から MN まであらゆる時間足で途切れのないスムーズなカウントダウンを実現します。 1分足でのスキャルピングでも、H4でのスイングトレードでも、現在のローソク足が正確にいつ確定するのかを把握することで、エントリータイミングの最適化、ローソク足パターンの確認、そして早すぎる判断の回避に役立ちます。 このタイマーが他と違う理由 多くの MT5 用キャンドルタイマーは TimeCurrent() のみに依存しており、新しいティックが到着したときにしか更新されません。低ボラティリティ時や上位時間足では、ティックの間隔が数秒空くことがあり、その間タイマーが停止し、その後突
MYTabogFX Supply & Demand is a powerful price action indicator designed to automatically identify high-probability supply and demand zones in the market. This tool helps traders visualize institutional zones where price is likely to react, reverse, or continue. Built for precision and simplicity, it highlights clean zones based on market structure and price behavior. Key Features: • Automatic Supply and Demand Zone Detection   • Clean and Easy-to-Read Zones   • Multi-Timeframe Support   • Zone
FREE
このプロダクトを購入した人は以下も購入しています
Azimuth Pro
Ottaviano De Cicco
5 (6)
発売プロモーション Azimuth Proは先着100名様限定で 299ドル でご提供します。最終価格は 499ドル となります。 リテールとインスティテューショナルのエントリーの違いはインジケーターではなく、ロケーションにあります。 多くのトレーダーは、モメンタムを追いかけたり、遅行シグナルに反応して、任意の価格レベルでエントリーします。機関投資家は、需給が実際にシフトする構造的なレベルに価格が到達するのを待ちます。 Azimuth Proはこれらのレベルを自動的にマッピングします:スイングアンカーVWAP、マルチタイムフレーム構造ライン、高確率ロケーションにのみ出現するABCパターン。 Azimuth Proは、構造分析とインテリジェントな自動化の両方を求めるプロフェッショナルトレーダー向けに構築されています。 Azimuthが外科的精度で市場構造をマッピングする一方、Azimuth Proはインテリジェンスレイヤーを追加します:トレーディングスタイルの自動検出、スマート設定された移動平均線、20年のデータでバックテストされた最適化パラメータ。その結果、お使いの銘柄と
このインジケーターを購入された方には、以下の特典を 無料 で提供しています: 各トレードを自動で管理し、ストップロスとテイクプロフィットを設定し、戦略ルールに基づいてポジションを決済する補助ツール 「Bomber Utility」 様々な銘柄に合わせたインジケーターの設定ファイル(セットファイル) 「最小リスク」、「バランスリスク」、「待機戦略」 の3つのモードで使用できる Bomber Utility 用の設定ファイル このトレーディング戦略をすぐに導入・設定・開始できる ステップバイステップのビデオマニュアル ご注意: 上記の特典を受け取るには、MQL5のプライベートメッセージシステムを通じて販売者にご連絡ください。 オリジナルのカスタムインジケーター 「Divergence Bomber(ダイバージェンス・ボンバー)」 をご紹介します。これは、MACDのダイバージェンス(乖離)戦略に基づいた 「オールインワン」型のトレーディングシステム です。 このテクニカルインジケーターの主な目的は、価格とMACDインジケーターの間に発生するダイバージェンスを検出 し、将来の価格の動きを示す
このインジケーターを購入すると、プロ仕様のトレードマネージャーを無料で差し上げます。 まず第一に、このトレーディングシステムがノンリペイント、ノンリドロー、ノンラグのインジケーターであることを強調する価値がある。これにより、手動取引とロボット取引の両方に理想的なものになっています。 オンラインコース、マニュアル、プリセットのダウンロード。 「スマートトレンドトレーディングシステム MT5」は、新規および経験豊富なトレーダー向けにカスタマイズされた包括的なトレーディングソリューションです。10以上のプレミアムインジケーターを組み合わせ、7つ以上の堅実なトレーディング戦略を備えており、多様な市場状況に対応する多目的な選択肢となっています。 トレンドフォロー戦略:トレンドを効果的に乗り越えるための正確なエントリーとストップロス管理を提供します。 リバーサル戦略:潜在的なトレンドの反転を特定し、トレーダーがレンジ相場を活用できるようにします。 スキャルピング戦略:高速で正確なデイトレードおよび短期取引のために設計されています。 安定性:すべてのインジケーターはノンリペイント、ノンリドロー、ノ
Meridian Pro
Ottaviano De Cicco
5 (1)
Meridian Pro:MT5用プロフェッショナル・マルチタイムフレーム・トレンドマトリックス 概要 Meridian Pro は Merkava Labs が開発したマルチタイムフレーム・トレンドマトリックスで、方向性の状態、強度、モメンタムの状況、マトリックスの合意をひとつのコンパクトなパネルに集約します。ひとつのアダプティブエンジンがM1からW1まで一貫して適用されます。シンボルごとの調整は不要。インジケーターの積み重ねも不要。すべてのアセットとすべてのタイムフレームをカバーするひとつの構造化された読み取りです。 発売キャンペーン — Meridian Proを USD 99 (導入価格)で入手。通常価格:USD 149 。 1. Meridian Proが他と異なる理由 ひとつのエンジン、バラバラなインジケーターのダッシュボードではない 多くのMTFダッシュボードは、タイムフレームごとに生のインジケーター値を繰り返すだけです。Meridian Proはマトリックス全体でひとつのアダプティブ・トレンドエンジンを使用するため、パネルの各行が同じ構造化フレームワークから導出されます
RelicusRoad Pro: 定量的市場オペレーティングシステム 【期間限定】無制限アクセス 70% OFF - 2,000人超のトレーダーと共に なぜ多くのトレーダーは「完璧な」インジケーターを使っても失敗するのでしょうか? それは、文脈を無視して 単一の概念 だけでトレードしているからです。文脈のないシグナルは単なるギャンブルです。勝ち続けるには、 根拠の重なり(コンフルエンス) が必要です。 RelicusRoad Proは単なる矢印インジケーターではありません。完全な 定量的市場エコシステム です。独自のボラティリティモデリングを用いて、価格が推移する「適正価値の道(Fair Value Road)」をマッピングし、ノイズと真の構造的ブレイクを判別します。 推測はやめましょう。機関投資家レベルの「ロード・ロジック」でトレードを。 コアエンジン:「Road」アルゴリズム システムの中心となる Road Algo は、市場環境にリアルタイムで適応するダイナミックなボラティリティチャネルです。 安全ライン(平衡点) と、価格が数学的に反転しやすい 拡張レベル を投影します。 Si
まず第一に、この取引インジケーターは再描画されず、再描画されず、遅延しないことを強調する価値があります。これにより、手動取引とロボット取引の両方に理想的なものになります。 ユーザーマニュアル:設定、入力、戦略。 アトミックアナリストは、価格の強さとモメンタムを利用して市場でより良いエッジを見つけるためのPA価格アクションインジケーターです。ノイズや誤ったシグナルを除去し、取引ポテンシャルを高めるための高度なフィルターを備えています。複雑なインジケーターの複数のレイヤーを使用して、アトミックアナリストはチャートをスキャンし、複雑な数学的計算をシンプルなシグナルと色に変換します。これにより、どのような初心者トレーダーでも理解して使用し、一貫した取引の決定を行うことができます。 「アトミックアナリスト」は、新規および経験豊富なトレーダー向けにカスタマイズされた包括的な取引ソリューションです。プレミアムインジケーターとトップノッチの機能を1つの取引戦略に組み合わせ、すべてのタイプのトレーダーにとって汎用性のある選択肢にします。 デイリートレーディングとスキャルピング戦略:高速で正確なデイ
BTMM State Engine Pro is a MetaTrader 5 indicator for traders who use the Beat The Market Maker approach: Asian session context, kill zone timing, level progression, peak formation detection, and a multi-pair scanner from a single chart. It combines cycle state logic with a built-in scanner dashboard so you do not need the same tool on many charts at once. What it does Draws the Asian session range; session times can follow broker server offset or be set in inputs. Tracks level progression (L
このインジケーターは、反転ポイントと価格戻りゾーンを正確に表示します。     主要プレーヤー 。新たなトレンドが形成される場所を把握し、最大限の精度で意思決定を行い、すべての取引をコントロールします。 TREND LINES PRO インジケーターと組み合わせることで、その潜在能力を最大限に発揮します。 VERSION MT4 インジケーターが示す内容: 新しいトレンドの始まりに活性化する反転構造と反転レベル。 リスクと報酬の比率を最小限に抑えた利益 確定 と 損失停止の レベルの表示     RR 1:2   。 インテリジェントな削減ロジックによるストップロス。 指定されたインジケーターから 2 つのトレンド タイプの反転パターンを表示します。 指標: トレンドを追う   TREND LINES PRO   (世界的なトレンドの変化) TREND PRO   (クイックトレンド変更) シンプルで効果的   スキャナー   リアルタイムトレンド(新機能)。 マルチタイムフレームのインストゥルメント フィルタリング。 画面   利益     LOGIC AI信号の後。 当日プラス方
OmniSync Projection
Antonio-alin Teculescu
5 (1)
Chronos Fractal Engine is an innovative price projection indicator for MetaTrader 5, designed to transform your technical analysis by intelligently identifying and projecting historical price patterns. Built upon an advanced correlation algorithm and the fractal principles of the market, this powerful tool visualizes potential future price movements, giving you a unique edge in your trading decisions. What is Chronos Fractal Engine? At its core, the Chronos Fractal Engine employs a sophisticat
トレンド スクリーナー インジケーターでトレンド取引の力を解き放ちます。ファジー ロジックと複数通貨システムを活用した究極のトレンド取引ソリューションです。 ファジー ロジックを活用した革新的なトレンド インジケーターである Trend Screener を使用して、トレンド取引を向上させます。 これは、13 を超えるプレミアム ツールと機能、および 3 つの取引戦略を組み合わせた強力なトレンド追跡インジケーターであり、Metatrader をトレンド アナライザーにする多用途の選択肢となります。 期間限定オファー : トレンド スクリーナー インジケーターは、わずか 100 ドルで生涯ご利用いただけます。 (元の価格 50$ ) (オファー延長) Trend Screener の 100% 非再描画精度の揺るぎない精度を体験して、取引の決定が過去の価格変動の影響を受けないようにしてください。 マルチタイムフレームおよびマルチ通貨機能の多用途性を解放し、比類のない自信を持って外国為替、商品、暗号通貨、インデックスの世界を取引できるようにします。 Trend Screener の包括的な
ARICoin is a powerful trading companion designed to generate high-probability entry signals with dynamic TP/SL/DP levels based on volatility. Built-in performance tracking shows win/loss stats, PP1/PP2 hits, and success rates all updated live. Key Features: Buy/Sell signals with adaptive volatility bands Real-time TP/SL/DP levels based on ATR Built-in MA Filter with optional ATR/StdDev volatility Performance stats panel (Success, Profit/Loss, PP1/PP2) Alerts via popup, sound, push, or email Cust
優れたテクニカルインジケーター「Grabber」をご紹介します。これは、すぐに使える「オールインワン」トレーディング戦略として機能します。 ひとつのコードに、市場のテクニカル分析ツール、取引シグナル(矢印)、アラート機能、プッシュ通知が強力に統合されています。 このインジケーターを購入された方には、以下の特典を無料で提供します: Grabberユーティリティ:オープンポジションを自動で管理するツール ステップバイステップのビデオマニュアル:インジケーターのインストール、設定、取引方法を解説 カスタムセットファイル:インジケーターをすばやく自動設定し、最大限の成果を出すための設定ファイル 他の戦略はもう忘れてください!Grabberだけが、あなたを新たなトレードの高みへと導いてくれるのです。 Grabber戦略の主な特徴: 推奨タイムフレーム:M5〜H4 対応通貨ペア・資産:どれでも使用可能ですが、私が実際に検証した以下を推奨します(GBPUSD、GBPCAD、GBPCHF、AUDCAD、AUDUSD、AUDSGD、AUDCHF、NZDUSD、NZDCAD、EURCAD、EURUSD、E
トレンドラインプロ   市場の真の方向転換点を理解するのに役立ちます。この指標は、真のトレンド反転と主要プレーヤーが再び参入するポイントを示します。 分かりますか     BOSライン   複雑な設定や不要なノイズなしに、より長い時間足でのトレンドの変化と重要なレベルを把握できます。シグナルは再描画されず、バーが閉じた後もチャート上に残ります。 MT4バージョン   -   RFI LEVELS PRO インジケーター と組み合わせることで、その最大限の能力を発揮します インジケーターが示す内容: 本当の変化   トレンド(BOSライン) 一度シグナルが現れたら、それは有効です!これは、リペイント機能を持つインジケーターとの重要な違いです。リペイント機能を持つインジケーターは、シグナルを発した後、それを変更し、資金の損失につながる可能性があります。これにより、より高い確率と精度で市場に参入できます。また、矢印が現れた後、目標値(利益確定)に達するか、反転シグナルが現れるまで、ローソク足の色を変更する機能もあります。 繰り返しエントリ   主要プレーヤーの補充 エントリーポイントを探す
Quantum TrendPulse を ご紹介します。これは、   SuperTrend   、   RSI   、および Stochastic のパワーを 1 つの包括的なインジケーターに組み合わせて、取引の可能性を最大限に引き出す究極の取引ツールです。精度と効率を求めるトレーダー向けに設計されたこのインジケーターは、市場のトレンド、勢いの変化、最適なエントリー ポイントとエグジット ポイントを自信を持って特定するのに役立ちます。 主な特徴: SuperTrend 統合: 現在の市場動向に簡単に追従し、収益性の波に乗ることができます。 RSI精度: 買われすぎと売られすぎのレベルを検出し、市場の反転のタイミングに最適で、SuperTrendのフィルターとして使用されます。 確率的精度: 確率的振動を活用して、変動の激しい市場で隠れたチャンスを見つけます。SuperTrend のフィルターとして使用されます。 マルチタイムフレーム分析:   M5 から H1 または H4 まで、さまざまなタイムフレームで市場を常に把握します。 カスタマイズ可能なアラート: カスタム取引条件が満たされ
Bill Williams Advanced is designed for automatic chart analysis using Bill Williams' "Profitunity" system. The indicator analyzes four timeframes at once. Manual (Be sure to read before purchasing) Advantages 1. Analyzes the chart using Bill Williams' "Profitunity" system. Signals are displayed in a table in the corner of the screen and on the price chart. 2. Finds all known AO and AC signals, as well as zone signals. Equipped with a trend filter based on the Alligator. 3. Finds "Divergence Bar
Gold Sniper Scalper Pro は、XAUUSD における ダマシブレイクアウト(false breakout)パターンの検出に特化した MetaTrader 5 用インジケーターです。価格がレンジの境界を突破してブレイクアウトトレーダーを誘い込み、その後反転してレンジ内に戻る4本バーのトラップ構造を識別します。インジケーターは各セットアップを17の品質要素で採点し、4層コンフルエンスパイプラインで評価し、7タイムフレームトレンドコンセンサスエンジンで検証し、ゴールドボラティリティレジーム分類器でフィルタリングします。すべてシグナルがチャートに表示される前に完了します。 詳細なユーザーガイドは、著者の   MQL5 ブログ   で入手できます。追加の更新は、著者の   MQL5 チャンネル   を通じて入手可能です。 現在のサポートポリシーに基づき、購入者は著者が開発した選定コンパニオンツールへの追加アクセスを受けることができます。 Forex通貨ペア、インデックス、暗号資産でも動作しますが、検出パラメーター、ボラティリティ処理、フィルターロジックはXAUUSD
CGE Trading Suite
Carl Gustav Johan Ekstrom
5 (1)
CGE Trading Suite delivers the analytical edge typically reserved for professional trading desks. The platform integrates a full suite of analytical tools into one seamless workflow: dynamic grid mapping, liquidity behavior analysis, ECM, trend lines, MIDAS, trade cycles, and directional channel projections. Together, these provide a unified view of market structure and momentum. Directional clarity is further enhanced by the capital flow index, which measures currency basket strength to identif
ARIPoint is a powerful trading companion designed to generate high-probability entry signals with dynamic TP/SL/DP levels based on volatility. Built-in performance tracking shows win/loss stats, PP1/PP2 hits, and success rates all updated live. Key Features: Buy/Sell signals with adaptive volatility bands Real-time TP/SL/DP levels based on ATR Built-in MA Filter with optional ATR/StdDev volatility Performance stats panel (Success, Profit/Loss, PP1/PP2) Alerts via popup, sound, push, or email Cu
Trend Hunter は、外国為替、仮想通貨、CFD 市場におけるトレンド指標です。 このインジケーターの特別な特徴は、価格がトレンドラインをわずかに突き抜けたときにシグナルを変更することなく、自信を持ってトレンドに従うことです。 インジケーターは再描画されず、バーが閉じた後に市場に参入するシグナルが表示されます。 トレンドに沿って移動すると、インジケーターにはトレンドの方向に追加のエントリーポイントが表示されます。 これらのシグナルに基づいて、小さなストップロスで取引できます。 トレンドハンターは正直な指標です。 インジケーター信号の上にマウスを置くと、信号の潜在的な利益と可能なストップが表示されます。 新しい信号が表示されると、次の通知を受け取ることができます。 アラート プッシュ通知 メールによる通知 電報での通知 チャートのスクリーンショットも Telegram に送信されるため、取引を決定するために端末を開く必要はありません。 インジケーターシグナルは、電報チャネル https://www.mql5.com/ja/market/product/11085#!ta
中国天機グローバル市場状態解析システムは、あらゆる銘柄とあらゆる時間足で使用できる MT5 用の市場状態分析インジケーターです。現在の相場がレンジなのかトレンドなのかを見極め、どの価格帯に注目すべきか、どの価格帯が魅力的に見えても実際にはリスクが高いのかを判断する助けになります。 中国天機グローバル市場状態解析システムは、市場の状態、価格構造、方向変化をより明確に理解するために設計された分析型インジケーターシステムです。単純な買いシグナルや売りシグナルだけを出すためのものではありません。現在の相場がレンジなのかトレンドなのか、そして今の価格帯がチャンスに近いのか、それともリスクに近いのかを、よりはっきり理解するためのものです。 多くのトレーダーは毎日同じような疑問を抱えています。相場はすでに下落した。この位置で反発するのか。今買うべきなのか。ここは本当の安値なのか、それとも偽の安値なのか。この反発のあと、相場はさらに下がるのか。今がレンジ相場なら、どこが買いに適した位置で、どこが売りに適した位置なのか。今がトレンド相場なら、どの価格帯が本当の安値に近く、どの価格帯が安く見えるだけで実際
トレンドトレーディング は、タイミングのプルバックとブレイクアウトにより、市場で起こっているトレンドから可能な限り利益を得るように設計された指標です。確立されたトレンドの中で価格が何をしているかを分析することにより、取引の機会を見つけます。 [ インストールガイド | 更新ガイド | トラブルシューティング | よくある質問 | すべての製品 ] 自信を持って効率的に金融市場を取引する むち打ちにならずに確立されたトレンドから利益を得る 収益性の高いプルバック、ブレイクアウト、早期の逆転を認識する この指標は、独自の品質とパフォーマンスを分析します 複数時間枠のダッシュボードを実装します インジケーターは再描画されていません 電子メール/音声/視覚アラートを実装します 確立されたトレンドは多くの取引機会を提供しますが、ほとんどのトレンド指標はそれらを完全に無視しています。インジケーターの解釈はかなり簡単です: (1) トレンドの変化 (2) トレンドの方向への後退 (3) トレンドの方向へのブレイクアウト 赤いダッシュ は下降トレンド中の修正です 青いダッシュ は上昇トレンド中
Ultimate SMC Indicator
Hicham Mahmoud Almoustafa
1 (1)
Ultimate SMC PRO – Smart Money Concepts Indicator (Order Blocks, FVG, Liquidity, BOS) for MetaTrader 5    After purchasing the product, you will receive an additional copy for free. Just contact me after your purchase. Ultimate SMC PRO is a professional trading indicator designed to visualize Smart Money Concepts directly on the chart. The indicator combines several institutional trading tools in one system to help traders identify potential high-probability trading zones. ULTIMATE S
このインディケータは、価格アクション分析とドンチャンチャネルのみを使用して、ジグザグ方式で価格の反転を検出します。再描画やバックペインティングを一切行わずに、短期取引向けに特別に設計されています。それは彼らの操作のタイミングを増やすことを目指している賢明なトレーダーにとって素晴らしいツールです。 [ インストールガイド | 更新ガイド | トラブルシューティング | よくある質問 | すべての製品 ] 驚くほど簡単に取引できます すべての時間枠で価値を提供します 自己分析統計を実装します 電子メール/音声/視覚アラートを実装します 可変長のブレイクアウトと混雑ゾーンに基づいて、インディケータは価格アクションのみを使用して取引を選択し、市場が非常に高速に行っていることに反応します。 過去のシグナルの潜在的な利益が表示されます この指標は、独自の品質とパフォーマンスを分析します 負けブレイクアウトは強調表示され、説明されます インジケータは、非バックペインティングおよび非再ペイントです この指標は、日中のトレーダーが単一の価格反転を見逃さないようにするのに役立ちます。ただし、すべての
Please contact me  https://t.me/RomaniaTrading Dragos Clean Execution is a price action execution indicator designed to simplify a high-probability intraday workflow based on liquidity sweep, market structure shift, and fair value gap confirmation. The indicator combines a higher-timeframe sweep concept with a lower-timeframe execution model to help traders identify cleaner entry locations, define invalidation clearly, and visualize realistic take-profit targets directly on the chart. Instead of
G-FiboTrend — Indicator Description G-FiboTrend is a trend-channel indicator for MetaTrader 5 that plots dynamic Fibonacci-based price zones over a rolling lookback period. How It Works The indicator scans a user-defined number of bars ( FiboPeriod ) to identify the highest high (HH) and lowest low (LL) within that window. From this range, it derives three key levels: Upper Band — Fibonacci level (default 61.8%) Mid Band — 50.0% midpoint Lower Band — Fibonacci level (default 38.2%) These levels
サポート線と抵抗線のプロットにうんざりしていませんか? サポートレジスタンス は、非常に興味深いひねりを加えてチャート内のサポートとレジスタンスラインを自動検出およびプロットするマルチタイムフレームインジケーターです。価格レベルは時間とともにテストされ、その重要性が高まるにつれて、ラインは太くなり、暗くなります。 [ インストールガイド | 更新ガイド | トラブルシューティング | よくある質問 | すべての製品 ] 一晩でテクニカル分析を強化 チャートを閲覧せずに重要な価格レベルを検出 一目ですべての価格レベルの相対的な強さを認識する すべての取引で最大30時間のプロットラインを節約 インジケーターは、すべての価格レベルの年齢を表示します インジケーターは再描画されていません 過去および現在の価格レベルは近接によって崩壊し、現在の市場行動に合わせて調整されます。動作は、必ずしもピークではない場所に線が引かれます。 価格レベルは、時間とともに拒否されるにつれて、より暗く、より広くなります ノイズを避けるために、重要でない価格レベルは定期的にクリアされます カスタマイズ可能な時間枠の
ご紹介     Quantum Breakout PRO は 、ブレイクアウト ゾーンの取引方法を変革する画期的な MQL5 インジケーターです。 13年以上の取引経験を持つ経験豊富なトレーダーのチームによって開発されました。     クォンタム ブレイクアウト プロ   は、革新的でダイナミックなブレイクアウト ゾーン戦略により、あなたのトレーディングの旅を新たな高みに押し上げるように設計されています。 クォンタム ブレイクアウト インジケーターは、5 つの利益ターゲット ゾーンを備えたブレイクアウト ゾーン上のシグナル矢印と、ブレイクアウト ボックスに基づいたストップロスの提案を提供します。 初心者トレーダーにもプロのトレーダーにも適しています。 量子EAチャネル:       ここをクリック 重要!購入後、インストールマニュアルを受け取るためにプライベートメッセージを送ってください。 推奨事項: 時間枠: M15 通貨ペア: GBPJPY、EURJPY、USDJPY、NZDUSD、XAUUSD アカウントの種類: ECN、Raw、またはスプレッドが非常に低い R
AriX
Temirlan Kdyrkhan
1 (4)
AriX Indicator for MT5 A powerful trend-following and signal-evaluation tool AriX is a custom MT5 indicator that combines Moving Averages and ATR-based risk/reward logic to generate clear buy/sell signals. It visualizes dynamic SL/TP levels, evaluates past trade outcomes, and displays win/loss statistics in a clean on-chart panel. Key features include: Buy/Sell signals based on MA crossovers ATR-based SL/TP1/TP2/TP3 levels with visual lines and labels Signal outcome tracking with real-time stat
MT4版 | インストール方法は? | FAQ Owl Smart Levels — 無駄なシグナルを排除した構造的なトレンドエントリー Owl Smart Levels は、1つのインジケーターに統合された完全なトレーディングシステムです。単にレベルを表示するだけでなく、 エントリーする価値があるゾーン を明確に示します。 コアロジックはシンプルで実践的です: トレンド → プルバック → エントリー インジケーターはこれらのゾーンを自動検出し、価格がレベルにタッチするだけで継続しないような状況をフィルタリングします。 主な違い: 多くのツールはレベルへのタッチでシグナルを出します。 Owl Smart Levelsは、レベルをエントリーのトリガーではなく、関心ゾーンとして扱います。 シグナルの形成ロジック ロジックは明確で透明です: トレンド方向 → インパルス構造 → プルバックゾーン → エントリーポイント 本システムでは以下を使用します: 主要ポイントを特定するためのフラクタル 価格構造(視覚ノイズを排除したZigZag) エントリーと目標値算出のためのフィボナッチレベル
マーケットメーカーのためのツール。 Meravith は次の機能を提供します: すべての時間足を分析し、現在有効なトレンドを表示します。 強気と弱気の出来高が等しくなる流動性ゾーン(出来高均衡)を強調表示します。 異なる時間足のすべての流動性レベルをチャート上に直接表示します。 テキスト形式の市場分析を生成し、参考情報として表示します。 現在のトレンドに基づいて目標値、サポートレベル、ストップロスを計算します。 取引のリスクリワード比を算出します。 口座残高に基づいてポジションサイズを計算し、潜在的な利益を推定します。 また、市場に大きな変化があった場合には警告を表示します。 インジケーターの主要ライン: 強気/弱気の出来高エグゾーストライン ― 目標値として機能します。 市場のトレンドを示すライン。市場が強気か弱気かによって色が変わり、トレンドのサポートとして機能します。主にその色が市場センチメントを示します。 出来高均衡ライン(Eq)。Eq(Volume Equilibrium)ラインはシステムの中核です。これは買い手と売り手の出来高のバランスポイントを表します。市場の流動性を示し
作者のその他のプロダクト
EasyTrade
Vitaly Muzichenko
2.33 (6)
Small trading panel for managing orders and positions in 1 click for MetaTrader 4 Version for MetaTrader 5 here Set hidden TakeProfit, StopLoss and pending orders at lines placed on the chart Work on time on the news Backtesting manual strategies in the tester Placing virtual orders Playing a sound signal when the price reaches a level Automatic closing of all positions on the account or symbol by the total take profit in the deposit currency Description Can be dragged to any part of the chart
通貨ペアの相関と発散の指標-同じ価格チャート上のすべてのペア。ターミナルで開いているすべてのペアを表示します。 MT5バージョン 利点 マルチ通貨取引戦略を使用しているトレーダーは、同じ価格チャートで選択したペアの価格変動を視覚的に観察して、変動のパラメーターを比較できます。これは、OverLayチャートインジケーターの高度な拡張バージョンです。 これは、多通貨取引のかなり効果的なアシスタントです。「ペア取引」と「ポートフォリオ取引」は、今後の動きを事前に判断するのに役立ちます。 この手法は2つの戦略に要約されます。最初の戦略は、重要なニュースリリース後またはトレーディングフロアの開設時に通貨ペア間の不一致を見つけるように設計されています。そのような作業の論理は非常に単純であり、市場の「嵐」が収まった後、商品の価格間のデルタが再び収束し始めるという仮定に基づいていますが、強力なサポートと強い抵抗の下で直接購入することを避けるための抵抗レベルと一番下の販売。 サポート/レジスタンスレベルの誤ったブレイクアウトを特定する。 可能性 チャート上の任意のペアを反転します い
CorrelatePairs
Vitaly Muzichenko
2 (2)
Advantage The analyzer provides an opportunity to examine correlation in history, for example, for the previous month excluding the current one, thus allowing you to evaluate symbol movement in history. It can be conveniently used in conjunction with LineSyncMirrorChart analyzer. Charts are synchronized by a market type: Forex, CFD, Futures, and Indices. The analyzer calculates the distance covered by the price on a specified period in points. The tool fits pairs and portfolio traders. Descript
Automatic lot calculation per stop level: calculates the lot considering the risk. It is possible to enter a percentage of the deposit and set the line to the planned stop level. As a result, the lot for entry will be calculated. Also, the TakeProfit level will be calculated taking into account the profit/loss ratio, and their profit/loss in the deposit currency. Thus, the final result of the trade can be seen, which is an integral part of successful trading. Features The indicator displays the
Advantage The analyzer provides an opportunity to examine correlation in history, for example, for the previous month excluding the current one, thus allowing you to evaluate symbol movement in history. It can be conveniently used in conjunction with the LineSyncMirrorCharts analyzer. Charts are synchronized by a market type: Forex, CFD, Futures, and Indices. The analyzer calculates the distance covered by the price on a specified period in points. The tool fits pairs and portfolio traders. Des
Automatic calculation of lot size based on the StopLoss level: it calculates the lot with consideration of the risk percentage. Enter the deposit percentage and set the line to the planned StopLoss level. The lot size for the entry will be output as a result. The TakeProfit will also be calculated with taking into account the profit/loss ratio, and their profit/loss in the deposit currency. Thus, the end result of the trade can be seen immediately, which is an integral part of successful trading
EasyTrades
Vitaly Muzichenko
1 (1)
Small trading panel for managing orders and positions in 1 click for MetaTrader 5 The version for MetaTrader 4 is here , you can check it in the tester without restrictions Set hidden TakeProfit, StopLoss and pending orders at lines placed on the chart. Virtual breakeven. Virtual trailing stop. Close all positions. Close only Buy positions. Close only Sell positions. Work in the back testing mode (working in the tester is limited). Place up to 20 virtual orders. News trading and operation by tim
フィルタ:
Peiro Rahbari
555
Peiro Rahbari 2024.12.13 09:08 
 

very good thank you mr vitaly

レビューに返信