Market Profile Studio MT4
- インディケータ
- バージョン: 1.0
- アクティベーション: 5

TPO or volume profile per day, week or session: histogram, letter blocks or letters, with POC, value area, naked POCs and on-chart buttons.
Description
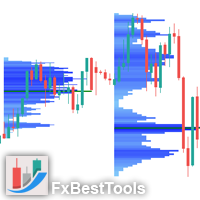
Market Profile Studio shows where the market spent its time, or where it traded its volume, inside each session. Every session gets its own profile next to the candles, with the point of control (POC), the value area and its high and low (VAH / VAL). The main settings are on a small button bar on the chart, so you can change the view with one click instead of opening the settings.
What it shows
- A profile for each session, as a histogram, as classic TPO letter blocks, or as letters only.
- POC: the price row with the most TPOs or the most volume, highlighted, with a line across the session.
- Value area: the rows around the POC that hold 70 % of the profile (adjustable), with VAH and VAL lines and a colour gradient.
- Naked POCs: the POC of a finished session that price has not traded at since. The line runs to the right edge of the chart until price touches it.
- Initial balance (optional): the range of the first hour of the session (adjustable), marked at the left of the profile.
- Single prints: price rows touched by one TPO period only.
- Price labels for POC, VAH, VAL and naked POCs, and the date of each session.
TPO letters and blocks
- Every TPO period (30 minutes by default) has its letter: A for the first period of the session, B for the next, and so on (A-Z, a-z, 0-9).
- Compact: the letters of each price row are pushed to the left, which gives the usual profile shape.
- Split: every period stays in its own column, so you can follow how the session developed in time.
- Colours by value area (POC row, value area, outside rows) or by period (each letter its own colour).
- The letters are drawn when the blocks are large enough; zoom in, or use fewer rows per session, to read them.
Sessions
- Day (server day), Week, Asia (00:00-09:00 UTC), London (07:00-16:00 UTC), New York (13:00-22:00 UTC), or a custom session with your own start and end time.
- Up to 200 sessions on the chart.
Profile type
- TPO: each TPO period counts once on every price row it touched.
- Volume: the volume of each bar is shared evenly across the price rows of its range. Tick volume by default; real volume where the broker provides it (input).
- Row height: automatic (about 40 rows in an average session) or a fixed number of points.
On-chart buttons
- Session: Day, Week, Asia, London, New York, Custom.
- TPO or Volume.
- Fewer or more sessions (- / +).
- Colour theme: Ocean, Ember, Forest, Mono.
- Histogram / Blocks / Letters, Compact / Split, colours by value area or by period.
- Value area, POC, naked POCs, initial balance, single prints and labels on or off.
- The bar can be collapsed to one button and placed in any corner of the chart. Your choices are kept for each chart, also after a timeframe change or a restart of the terminal.
Drawing and speed
- The profiles are drawn on a transparent layer behind the candles, so the candles stay visible.
- Finished sessions are calculated once; only the current session is updated with new bars and ticks (at most four times a second). In our tests 200 day sessions on a one-minute chart (about 270,000 bars) were built in less than 0.1 seconds.
Values for Expert Advisors
- Three buffers hold the developing POC, VAH and VAL of the session on every bar (buffers 0-2, also in the Data Window). The value of a bar is final when the bar closes.
About repainting
- The profile of a finished session does not change.
- The profile of the current session grows with each new bar until the session ends; this is how a market profile works.
- The automatic row height is chosen when the indicator calculates the history. If the terminal recalculates later (for example after loading more history), the row height can change slightly. Set a fixed row height if you need identical values after every recalculation.
Notes
- Best on M1 to H1 charts; the profile is built from the bars of the chart.
- The Asia, London and New York sessions use the offset of the server time from UTC, which MetaTrader 5 reads from the trade server. You can also set the offset yourself. Daylight saving time is not applied to these sessions; use the custom session for exact local exchange hours.
- The indicator does not trade and does not predict prices. It shows where trading took place.
Inputs
- Session, profile type, sessions to show, value area %, row height (automatic or points), rows per session for the automatic height, TPO period, profile width.
- Custom session start and end, server UTC offset, real volume.
- Value area, POC, naked POCs, initial balance and its length, single prints, labels.
- Drawing (histogram, blocks, letters), split columns, colours by period, colour theme, button bar corner, label font size.
Works on any symbol. No DLL.