BotTrader Structure Analyzer

BotTrader Structure Analyzer

Professional SMC Multi-Timeframe and Multi-Asset Indicator for MetaTrader 5

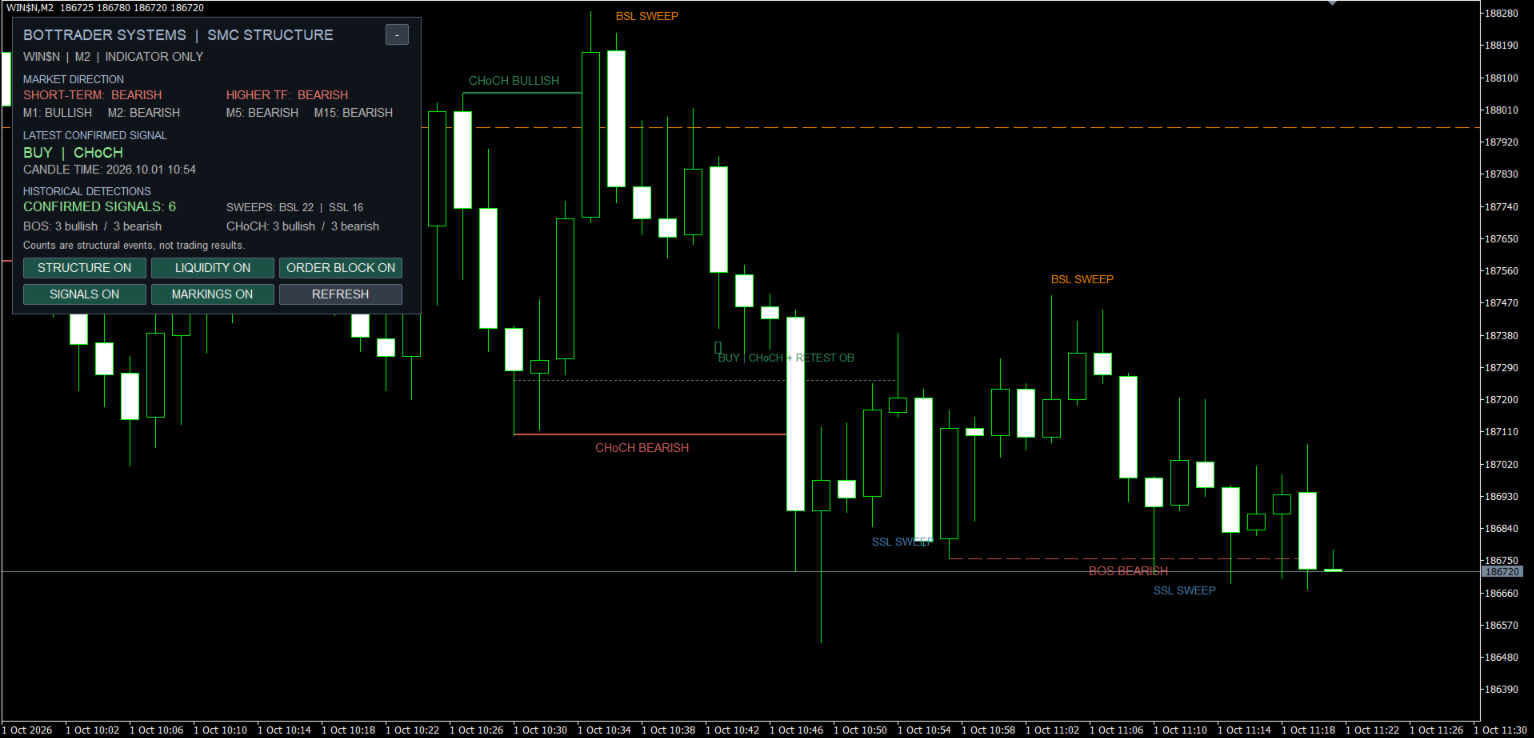
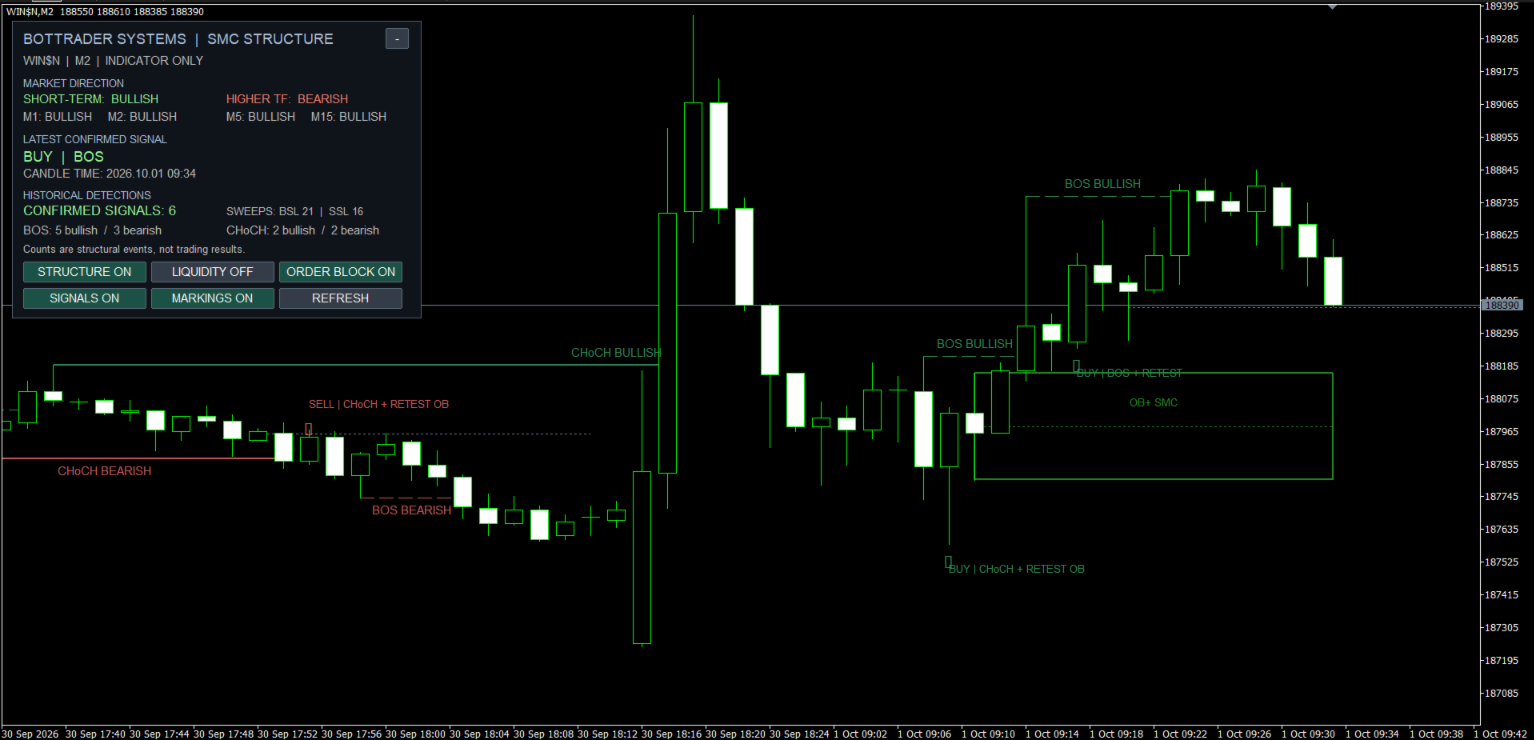
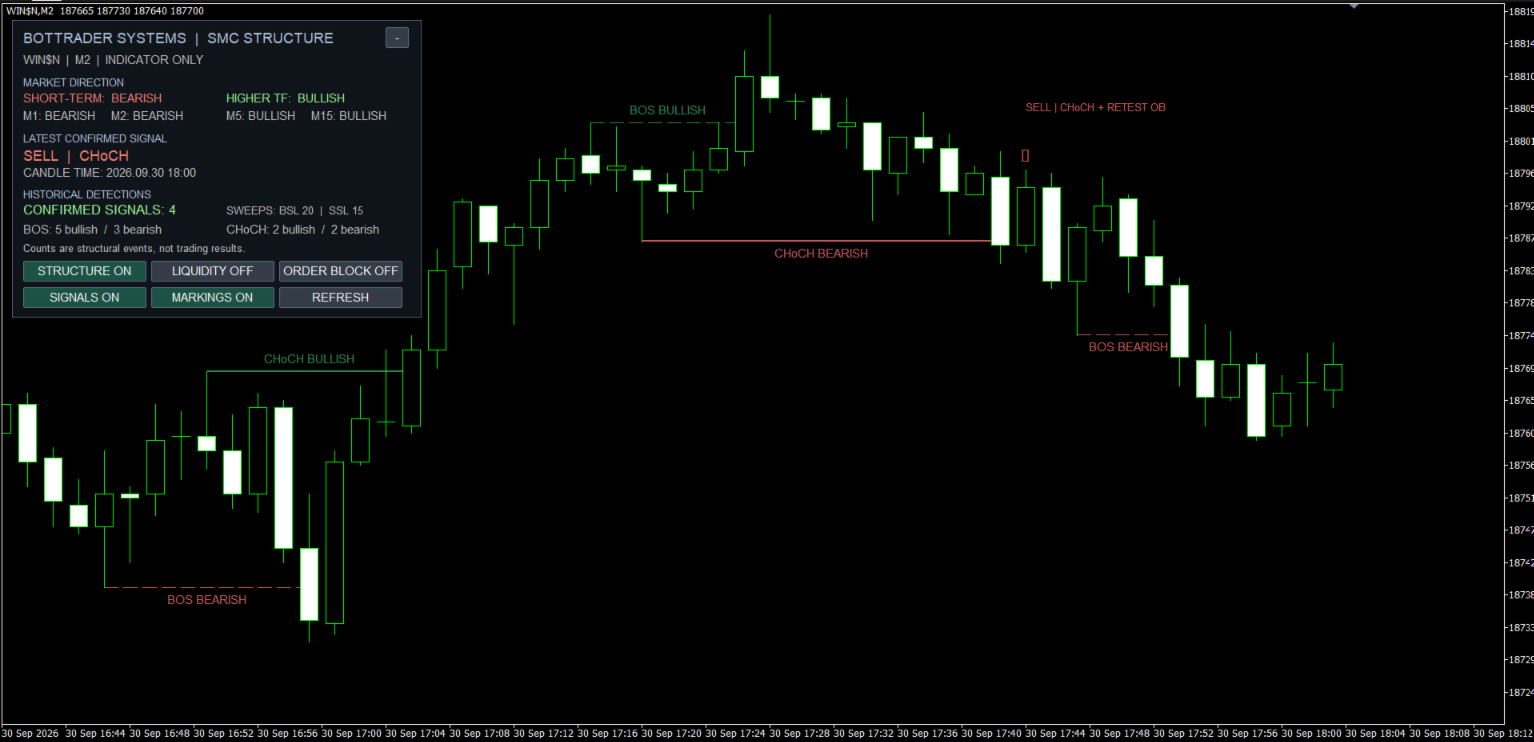
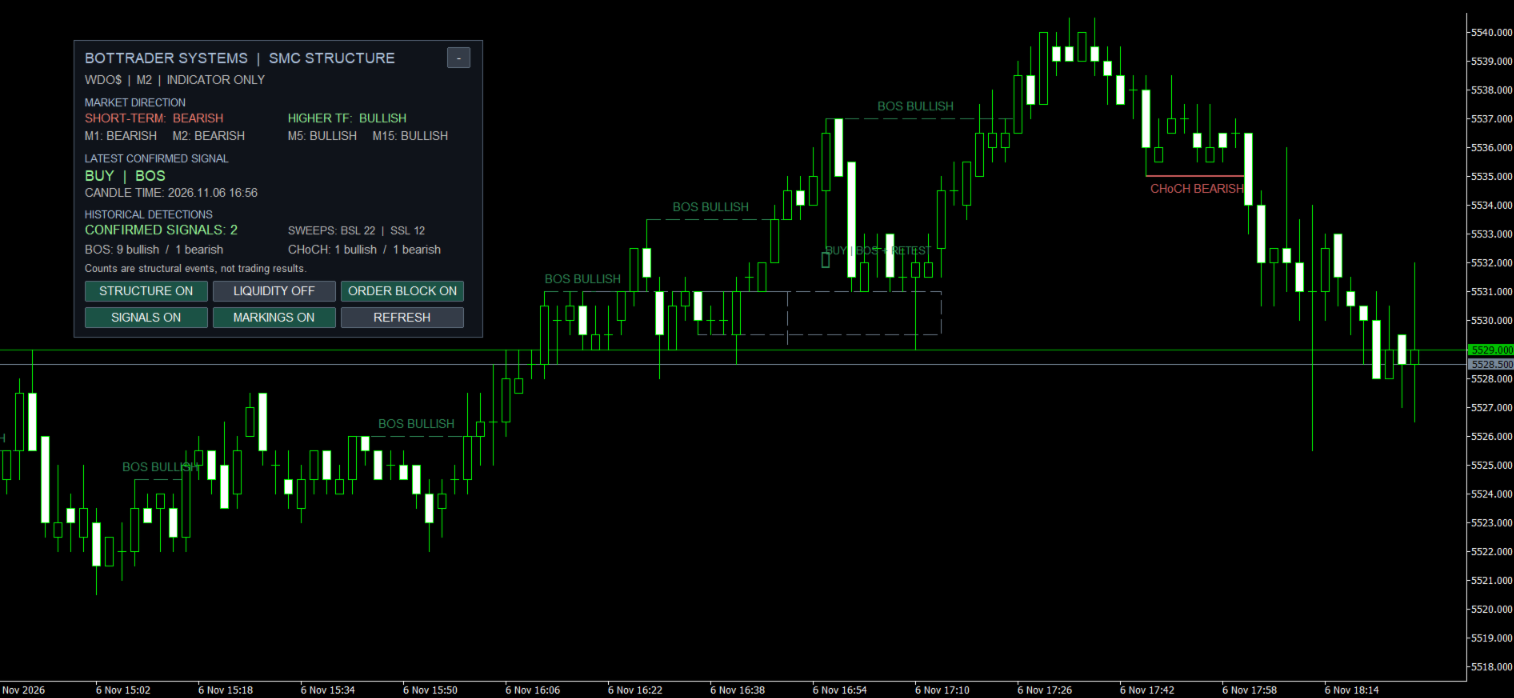
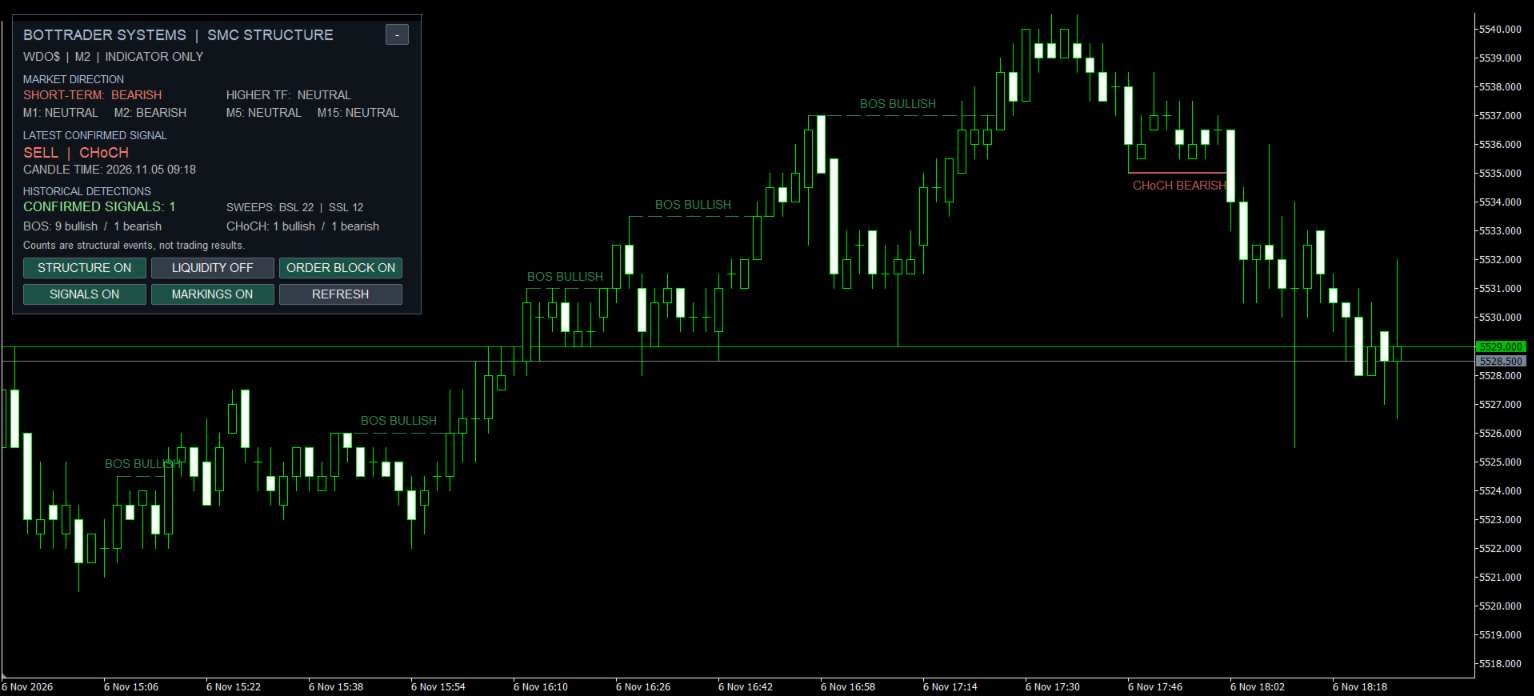
BotTrader Structure Analyzer, developed by BotTrader Systems, is a technical analysis indicator based on Smart Money Concepts (SMC), designed to automatically identify market structure, breakouts, potential reversals and key price zones.

The indicator combines structural analysis, multiple timeframes and confirmed trading setups to help traders understand price action.

Main Features

1. BOS — Break of Structure

  • Automatic bullish and bearish BOS detection.

  • Structural breakout levels displayed directly on the chart.

  • Identification of potential trend continuation movements.

  • Breakout analysis and subsequent retest evaluation.

2. CHoCH — Change of Character

  • Automatic identification of potential market structure changes.

  • Bullish and bearish CHoCH detection.

  • Setup confirmation based on structural conditions, liquidity sweeps and Order Block retests.

3. Order Blocks (OB)

  • Automatic detection of bullish and bearish Order Blocks.

  • Visual zone identification using chart rectangles.

  • Clear visualization of relevant price areas.

  • Optional Order Block display controls.

4. Multi-Timeframe Analysis

  • Simultaneous directional analysis across M1, M2, M5 and M15.

  • Higher-timeframe trend analysis using H1 as the default reference.

  • Bullish, bearish and undefined trend classification.

  • Multi-timeframe alignment verification for BOS setup confirmation.

5. Multi-Asset Compatibility

The indicator automatically identifies the symbol of the chart where it is attached, allowing it to be used with different financial instruments supported by MetaTrader 5.

Supported instrument categories include:

  • Forex: EURUSD, GBPUSD and other currency pairs.

  • Indices: NAS100, US30 and other indices.

  • Metals: XAUUSD and other instruments.

  • Cryptocurrencies: BTCUSD, ETHUSD and other cryptocurrencies.

  • Brazilian B3 markets: WIN, WDO and other compatible instruments.

Each indicator instance analyzes its current chart symbol. Multiple instruments can be monitored by attaching the indicator to separate charts.

Instrument availability depends on the broker, and behavior may vary across markets.

Fully Movable and Interactive Dashboard

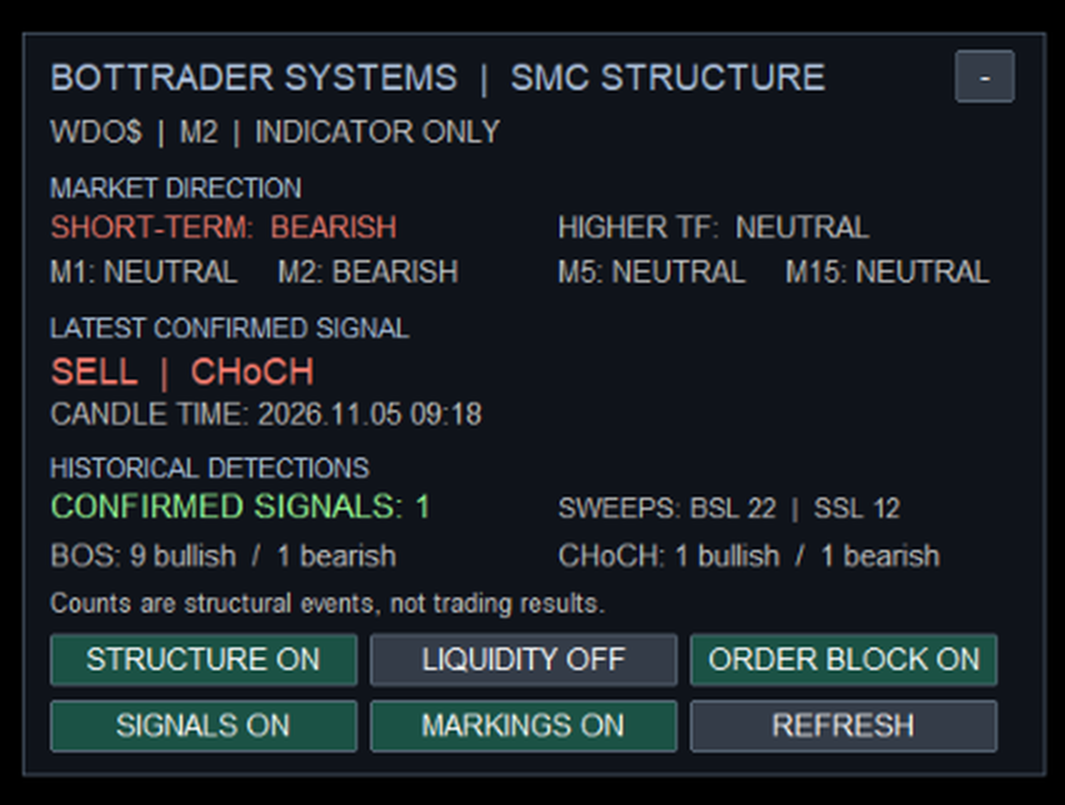
One of the key features of BotTrader Structure Analyzer is its fully movable dashboard, designed to provide flexibility and a clean chart layout.

Users can click and drag the dashboard with the mouse, positioning it anywhere within the available chart area without changing the indicator's analytical rules.

Dashboard Information:

  • Short-term market direction.

  • Higher-timeframe market trend.

  • Individual M1, M2, M5 and M15 trends.

  • Latest confirmed BUY or SELL signal.

  • Signal confirmation date and time.

  • Historical BOS and CHoCH counts.

  • Confirmed setup statistics.

  • BSL and SSL liquidity sweep information.

Interactive Dashboard Controls:

  • Freely drag and reposition the dashboard.

  • Minimize or expand the panel with one click.

  • Enable or disable BOS and CHoCH markings.

  • Show or hide Order Blocks.

  • Control liquidity visualization.

  • Enable or disable signal labels.

  • Refresh the visual analysis.

The dashboard features a solid dark background, organized text and color-coded information to improve readability.

Alerts and Notifications

Optional alerts are available for confirmed trading setups:

  • Sound alerts.

  • MetaTrader 5 mobile push notifications.

  • Confirmation messages containing instrument and structure information.

Notifications require the appropriate terminal configuration.

Customizable Settings

Users can configure analysis and visualization parameters, including historical lookback, swing detection, retest windows, structural zones, chart markings and notifications.

Important Information

BotTrader Structure Analyzer is a technical analysis indicator, not an Expert Advisor.

It does not automatically open, modify or close trading positions.

BOS, CHoCH, Order Block markings and confirmed trading setups do not guarantee profitable results. Users should independently evaluate market conditions and apply appropriate risk management.

Developed by BotTrader Systems.

おすすめのプロダクト
SupportResistanceは、以前のろうそくの高値と安値に基づく動的なサポートとレジスタンスのインジケーターです。 計算パラメータは設定可能です。 前のキャンドルの最大値と最小値を参照として使用することも、前のキャンドルのグループの最大値と最小値を使用することもできます。 インジケーターは、抵抗を示すために赤い線を使用し、サポートを示すために緑の線を使用します。 サポートまたはレジスタンスが壊れた場合、その線は点線で示され、再び関連するようになったときにのみ復元されます。 サポートまたは抵抗が壊れた後、反対の線が到達すると、最後の有効な値で新しいサポートまたは新しい抵抗が見つかります。 過去の最大値または最小値の場合、有効なサポートまたはレジスタンスラインはありません。
Market Entropy
Elian Isaac Rodrigues Oliveira
The Market Entropy indicator was created to measure the order of price changes over time. consists of two lines and a histogram where the lines are responsible for measuring the price movement and the histogram measures the strength of the analyzed movement. It can be used to find a trend (Image 2) or price reversal (Image 3). Blue Line: Buy Entropy Red Line: Sell Entropy Historgram: Market Entropy Interpretation: Buy Line above the Sell Line indicates that in the analyzed period buyers were
Here I present you this awesome indicator I made. This is a nique combination witch puts you in the same level as MM's. So you can surf a lot of waves and identify the rally time, breakouts, and the perfect time to get in the market. ---- The SSL Channel is a great all-rounder based on 2 Simple Moving Averages, one of recent Highs, one of recent Lows. The calculation prints a   channel   on the chart consisting of 2 lines. This strategy gives a Long signal when price closes above the top of thes
Volume Waves
Paulo Henrique Faquineli Garcia
One of the best tools for analyzing volume, Weis Wave was devised by David Weis to facilitate reading the directional flow. For the disciples of the Wyckoff method, this means an evolution, facilitating a predictive reading of the market, always looking for Accumulation and Distribution zones for traded assets. For better understanding, in this indicator we try to cover every reading of EFFORT (traded volume) versus RESULT (price change). Thus, you can apply the indicator on the chart twice to
Apex Break PRO は、MetaTrader 5 向けの不再描画ピボットトレンドラインブレイクアウトインジケーターです。ピボット高値とピボット安値を検出し、連続するピボット間に動的な斜めトレンドラインを描画し、確定したバーの終値でそれらのトレンドラインをブレイクした際に買いシグナルと売りシグナルを生成します。すべてのシグナルは最大4つの独立したコンフルエンス層——EMAトレンド、RSI境界値、出来高急増検出、ADXトレンド強度——を通じてフィルタリングされ、何個の条件が一致したかをトレーダーが即座に確認できるスター評価システムで格付けされます。ATRベースのストップロスと3つのテイクプロフィットレベルが各シグナルに対して体系的なリスク管理を提供し、リアルタイムのダッシュボードは方向性、フィルター状態、および到達チェックマーク付きの取引レベルの追跡を表示します。 MT4バージョンはこちら:  Apex Break PRO MT4 その他の製品はこちら:   全製品一 覧 ライブ事例や新ツールをご覧になるには、プロフィールをご訪問いただき、アップデートを見逃さないようフレンドリク
CRT Candle Range Theory HTF MT5 - Ultimate CRT Indicator: 高度なICTコンセプトとMalaysian SnRトレーディングシステム 最も先進的なCandle Range Theoryインジケーターでマーケットメーカーの足跡をマスターしましょう。Ultimate CRT Indicatorを使用して、Smart Money Concepts (SMC)の真の力を解き放ち、機関投資家のように正確にトレードします。真剣なトレーダー専用に構築されたこのインジケーターは、ICT Concepts (Inner Circle Trader)の核となる柱である、非常に効果的なCandle Range Theory (CRT)を自動化し、Malaysian Support and Resistance (SnR)エントリー手法とFVG (Imbalance)ゾーンの致命的な精度でそれを強化します。 MT5でForex、Crypto、Indicesのいずれを取引している場合でも、このアルゴリズムは市場のノイズを取り除き、ダマシ(fakeout)を
A Malaysian SnR (MSNR) indicator that draws A, V, gap and OCL levels from three timeframes, keeps track of which levels are still fresh, and reads the MSNR storyline for you. The MSNR radar watches your Market Watch and shows which symbol sits at a fresh D1 or H4 level right now. Every level and every storyline turn is confirmed on a closed candle, so the levels you see on past candles are the same levels the chart showed live. What you get All MSNR level types: A levels (resistance), V levels (
Description The indicator uses market profile theory to show the most relevant trading zones, on a daily basis. The zones to be shown are LVN (low volume nodes) and POC (point of control). An LVN zone is one which represents price areas with the least time or volume throughout the day. Typically, these areas indicate a supply or demand initiative, and in the future, they can turn into important breakout or retracement zones. A POC zone is one which represents price areas with the most time or vo
Features 3 types of waves: bullish, bearish and unknown. The unknown tower comes when prices move in opposite the direction of the current tower. Label that shows the percentage remaining for the next tower. Allows you set the type of volume that will be accumulated in the towers, either real or tick volumes. Thus, the indicator works in any market, for example: stocks, futures, forex, commodities, etc. Allows you to set the required score for the tower exchange. Allows you to set the font size
Weis Wave Double Side
Eduardo Da Costa Custodio Santos
The Weis Wave Bouble Side Indicator for MT5 is part of the toolkit (Wyckoff Academy Wave Market) The Weis Wave Bouble side Indicator for MT5 was created based on the already established Weis Wave created by David Weis. The Weis Wave Double Side indicator reads the market in waves as it was done by R. Wyckoff in 1900. It helps in the identification of effort x result, cause and effect, and Supply and demand Its differential is that it can be used below the zero axis, further improving plus operat
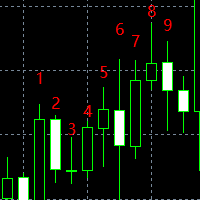
神奇九转, 顾名思义就是每当出现数字9时,行情就很大的几率会发生逆转,这时应该注意止盈。是一个很有效的指标。 在序列显示和形成过程中,一旦出现不符合触发条件的情况,则前面序列数字消失,本次九转序列结构不存在。如果连续九天都达到触发条件,九转序列结构形成,价格走势可能发生反转。 九转序列可分为上升九转结构和下降九转结构,也就是九转序列在买多和买空以及判断各种走势反转是都可以使用。 九转序列买入建仓,即下降九转序列结构形成时,价格走势将要发生转变,考虑建仓买入。 买入条件:连续出现九根K线,并且满足收盘价都低于前一根K线收盘价,当第8、9根K线满足上述条件时,九转序列形成,投资者准备买入建仓。 使用分时九转时需要注意两点: 1、极端行情时(连续上涨或下跌),九转序列失效; 2、当九转序列完全形成时,再进场操作(尤其不用刚出现数字8或9就入场,一定要完全形成之后才可以。)
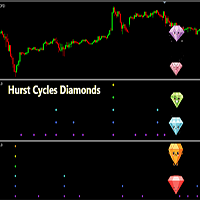
Hurst Cycles Diamonds Description This indicator is an alternative version inspired by the pioneering work of David Hickson and the Hurst Cycles Notes indicator developed by Grafton. The main objective is to provide a clear and intuitive view of the Hurst cycles. Credits Original Concept : David Hickson - Hurst Cycles Theory Inspiration : Grafton - Hurst Diamond Notation Pivots Alternative Version : Fillipe dos Santos Main Features Identifies and displays pivots in multiple time cycles Visual t
Indicator shows 3 Fibonacci expansion levels, based on the last pivot breakout. Pivots are calculated based on volatility (ATR), works on every Timeframe and Symbol. Lines are displayed only after the pivot breakout. A comment on the upper left side shows the minimum calculated value (in points) for pivots. Parameters: Variation: minimum variation for the pivot. ATR multiplication factor. (default 3) ATR Period: Period for ATR value calculations. (default 60) Ex.:   ATR on TimeFrame H1 = 100poi
Supertrend Volume Confirm
Isaac Alexander Pinero Garcias
DESCRIPTION Supertrend Volume Confirm — Trend Signals Confirmed by Volume and RSI Supertrend Volume Confirm is a buy/sell signal indicator based on the classic Supertrend, with two additional confirmation filters: volume and RSI. Unlike more complex multi-timeframe systems, this indicator works on a single timeframe, designed for traders who want something direct and easy to read. It works on any market symbol (forex, gold, indices, stocks, crypto) thanks to its default use of tick volume, unive
Automatic Support & Resistance zones for MetaTrader 5 — confirmed by real price action, not just the nearest line. Tenet Support & Resistance Pro scans D1, H4, H1, M15, M5 and M1 price history and plots the key support and resistance levels for you. Instead of simply highlighting whichever line sits closest to price, it checks how many times price has actually tested a level in recent candles before confirming it as the current trading zone — so you're not reacting to a level the market never re
True Weis Wave
Atila Goncalves Firmino
A version based on David Waves' description in his book 'Trade About to Happen' of his adaptation of the Wyckoff wave chart. The indicator directionally accumulates volume, adding to each brick or candle close, with color indication for up and down. it can be used it with tick or real volume, it also changes color when the accumulated value of the previous wave is exceeded, being the trade signal. Yellow color is used for doji candlestick, it will continue with accumulation without zero the sum
Candle Patterns Pro v4 is a professional candlestick pattern detection indicator for MetaTrader 5, designed to help traders identify classic and less common price-action formations directly on the chart. The indicator automatically scans the market for multiple candlestick formations, highlights detected patterns, and provides a live Pattern Counter panel showing how many detected patterns are present on the chart. Key Features Classic Candlestick Patterns Candle Patterns Pro v4 detects a wide r
Triple Period VWAP plots three Volume Weighted Average Price lines at once: daily, weekly and monthly. Each line resets automatically at the start of its own period instead of rolling continuously, so you always see where the average price stands for the current day, the current week and the current month side by side. Colors follow a familiar convention: magenta for the daily line, blue for the weekly line, and dark green for the monthly line. Line width and colors are configurable. Features:
Zeiierman アダプティブ移動平均線は、適応的なトレンド分析を通じて取引機会を特定するために設計されたテクニカル分析ツールです。これは、TradingView における Zeiierman のオリジナル指標を基にした Metatrader 用の適応版であり、複数の分析手法を組み合わせて市場の視覚的な評価を提供します。 技術的特徴 市場のボラティリティに基づく適応的平滑化アルゴリズムを使用 感度を動的に調整するために効率比 (ER) を計算 ボラティリティ測定のためにシグマバンドを組み込み 色付きの移動平均線によってトレンド方向を表示 トレンド変化やシグナルに関する設定可能なアラートを含む 機能 このインジケーターは市場データを処理して以下を行います: ボラティリティの状況に応じて平滑化係数を調整 色の変化によってトレンド方向を表示(強気、弱気、または中立) シグマに基づく条件を用いてエントリーおよびエグジットの可能性を生成 トレンドを視覚化するためのローソク足カラー表示をオプションで提供 想定される利用例 トレンドフォロー戦略や平均回帰戦略に役立つ可能性がある 外国為替、株
Nro Lines
Sonia Maria Lima Costa
Nro Lines インジケーターは、ラインプロットを通じて、主要な価格レベルの精密かつ動的な可視化を提供します。 この機能により、トレーダーは最適化された技術分析を実行できるようになり、効果的な取引戦略の開発や、市場への参入・退出の的確な判断に不可欠です。   主な特徴: - 市場の変化に応じて調整される動的な参照ライン。トレーダーに更新された関連性の高い視覚的表現を提供します。 - 関連レベルの自動計算。ユーザーがチャートの解釈に専念できるようにします。 - 複数のグローバル市場との互換性。世界中の様々な金融市場で活動するトレーダーにとって多用途なツールとなります。 - 異なる市場セッションのスケジュールのカスタマイズ。これは、様々なタイムゾーンで活動したり、特定の取引時間を持つ市場を専門とするトレーダーにとって重要です。 - カスタマイズ可能な線の色、スタイル、太さ。各トレーダーが自身の視覚的好みや分析ニーズに応じてインジケーターをカスタマイズできます。 - トレンドラインの固定モードまたは動的モードの柔軟性。インジケーターを市場条件に自動的に適応させるか、比較分析のために安定さ
Percent Levels
Cinthia Regina De Moraes
Indicador tipo 2mv frequência mostra os níveis percentuais no mercado financeiro que tendem a ser zonas realmente importantes para os traders. Observem que o preço segue um fluxo e uma frequência que se enquadram em canais percentuais de movimento,  tradicionalmente traçados por níveis Fibonacci. O indicador LevelsPercent traça linhas em pontos específicos de percentual configurados pelo usuário e "pode" anteceder possíveis níveis de SUPORTE e RESISTÊNCIA. A leitura do mercado e a identificação
Win43 Scalper
Eadvisors Software Inc.
O novo s43 Scalper para Mini-Índice (WIN-IND) faz operações de curto prazo no timeframe 1min buscando pequenas variações do mercado, utiliza nova tecnologia de trade, os resultados no intraday são íncríveis, confira:      Após a instalação adicione no gráfico dos instrumentos win para visualizar os resultados no backteste. Recomendamos o timeframe de 1min.
Auto Fractal Support And Resistance is a powerful multi-timeframe indicator designed for traders who want to trade lower timeframes with higher timeframe accuracy. When your mouse cursor is on a line you can easily see fractal describtion and index of fractal candle  and timeframe of that fractal candle.  This indicator automatically detects H1 and D1 fractal levels and draws clean horizontal support and resistance lines on any lower timeframe chart (M1, M5, M15, M30). Now you can see where the
アンカード線形回帰チャネル(ALRC) 概要: **アンカード線形回帰チャネル(ALRC)**は、従来の線形回帰チャネルを進化させた高度なテクニカル分析ツールです。**確認されたピボットポイントにチャネルをアンカー(固定)**できることで、チャート上の重要な構造的ポイントに対する価格の動きをより正確かつ信頼性の高い形で捉えることができます。 主な特徴: 確認済みピボットへのアンカー: 重要なピボットを手動で選択してチャネルを固定し、マーケットで検証されたイベントに基づいた分析を可能にします。 トレンドの明確な視覚化: アンカーチャネル内での価格の動きを観察することで、反転、ブレイクアウト、チャネルの拡張などを把握できます。 高い信頼性: 確認されたイベントを起点にすることで、より信頼性の高いトレードシグナルを提供します。 主な活用方法: チャネル内における動的なサポートとレジスタンスゾーンの特定 トレンド反転の初期兆候を捉える チャネルの境界線を利用したリスク管理の強化 カスタマイズ可能なパラメーター: アンカーピボット: 識別されたピボットを起点としてチャネルを設定 回帰期間: 回帰
FVG and Structure PRO は、マーケットストラクチャー(BOS / CHoCH)、フェアバリューギャップ(FVG)、オーダーブロック、イコールハイ・イコールローをチャート上に表示します。ICT や Smart Money のトレーダーが使うプライスアクションの概念です。すべての要素は確定足で判定されるため、一度表示された内容が後から描き直されることはありません。 主な機能 強さを調整できるスイング高値・安値。BOS(継続)と CHoCH(性質の転換)を足の確定時に描画 各スイングに HH / HL / LH / LL ラベルを表示(任意) フェアバリューギャップ(3本の足のインバランス)。ATR 基準の最小サイズで小さなギャップを除外 埋まり具合の追跡:価格がギャップを埋めるにつれて FVG のボックスが縮み、まだ開いている部分が正確に分かります ギャップを消化済みとみなす条件を選択:完全に埋まる、50%(consequent encroachment)、最初のタッチ。消化済みゾーンは非表示またはグレーで残せます キルゾーンフィルター:ロンドン、NY AM、NY PM
Stochastic Horizontal Line Alert for MT5 Turn your Stochastic horizontal levels into automatic alerts. Simply draw a line on the Stochastic window and let the indicator monitor it for you.  Your Stochastic levels are monitored automatically — so you don't have to watch the chart all the time. Stochastic Horizontal Line Alert is a simple and convenient MetaTrader 5 indicator that monitors horizontal levels drawn in the Stochastic Oscillator window and automatically alerts you when the Stochasti
Adaptive Fibonacci Trend Zones is an MT5 indicator built for traders who want a clean structure-based Fibonacci workflow without constantly redrawing anchors by hand. The indicator automatically detects the dominant swing, builds the active Fibonacci map, projects trade-map zones and adapts its behavior across scalp, intraday and swing conditions. Instead of leaving outdated levels on the chart when structure changes, the indicator can disable the active trade map and wait for a new anchor. T
Range Filtered AlgoAlphaは、市場のボラティリティを分析することで潜在的な取引機会を特定するためのテクニカル分析ツールです。このMetaTrader向けAlgoAlphaオリジナルTradingViewインジケーターの改訂版は、複数の分析方法を組み合わせて視覚的な市場評価を提供します。 技術的特徴 価格平滑化にカルマンフィルター(Kalman Filtering)を採用 ボラティリティ測定にATRベースバンド(ATR-based Bands)を統合 トレンド分析にスーパートレンド(Supertrend)要素を組み込み カラーろうそく足(Candles)とマーカー(Markers)で視覚的シグナルを提供 設定可能なアラート機能(Configurable Alerts)を装備 機能性 当インジケーターは市場データを処理し以下を実現: ATR(平均真の範囲)を使用したボラティリティレンジ計算 市場ノイズ低減のためのフィルタリング技術(Filtering Techniques)適用 視覚的要素(Visual Elements)による潜在的なトレンド方向の表示 使用事例 ボ
O Touch VWAP é um indicador que permite calcular uma Média Ponderada por Volume (VWAP) apenas apertando a tecla 'w' no seu teclado e após clicando no candle do qual deseja realizar o calculo, clicando abaixo do candle é calculada a VWAP baseado na minima dos preços com o volume, clicando sobre o corpo do candle é calculado uma VWAP sobre o preço medio com o volume e clicando acima do candle é calculado uma VWAP baseado na máxima dos preços com o volume, voce tambem tem a opção de remover a VWAP
Santa Trend
Marco Aurelio Cestari
4.4 (5)
Santa Trend Indicator  is an efficient way to forecast and detect the trend in any market. Advantages Generates instant buy and sell signals. Provides an alternate exit strategy to your existing trading system. Never repaints, never backpaints, never recalculates. Works in all symbols and all timeframes. Perfect trend filter for any strategy or expert advisor. Fully compatible with Expert Advisor (EA) development. Does not lag.
FREE
このプロダクトを購入した人は以下も購入しています
Trend Sniper X
Sarvarbek Abduvoxobov
4.86 (44)
Trend Sniper X は、トレードの方向性と潜在的な反転ポイントを明確かつ正確に特定するのに役立つ、MetaTrader 5 用のマルチタイムフレーム・トレンドフォロー指標です。 MT4用: https://www.mql5.com/en/market/product/193245 価格情報: 現在の価格はプロモーション価格であり、今後のアップデートや新機能のリリースに伴い変更される場合があります。 ボーナス特典: このインジケーター用の無料自動売買アシスタントEAを入手するには、購入後に an 著者(開発者)へメッセージをお送りください。 Code2Profit チャンネル マルチタイムフレーム分析で相場をマスターしよう! Trend Sniper X で勝率を最大化する方法:重要なルールとセッションのコツ 技術仕様 プラットフォーム MetaTrader 5 インジケータータイプ マルチタイムフレーム・トレンドインジケーター 操作タイムフレーム あらゆるチャートタイムフレームに対応。個別に選択可能な上位タイムフレーム (M1–MN1) を搭載 主要銘柄 FX、ゴールド (X
新たな王者が登場 - インジケーター + 注文管理表示(TP1 + TP2 + TP3)+ オプションのTelegramシグナル送信機能付き(無料) (完全なトレード&シグナルシステム) ゴールド向け最高のEA: Gold Slayer このインジケーターには、高度な戦略、カスタマイズ可能な注文管理システム、そしてエンベロープ拡張を組み合わせた平均回帰システムが搭載されています。さらに、RSIなど複数のインテリジェントな確認フィルターによって、高確率の反転エントリーをBUY・SELLシグナルとして検出します。 単にトレードを学ぶだけでなく、複数ポジションを効果的に管理し、過去に利益を出しているオープンポジションで損失トレードをカバーする方法も学べます。 M5向けに構築・最適化されており、流動性が高くシグナルの精度が安定しているBTCUSDとXAUUSDで優れたパフォーマンスを発揮します。 このインジケーターは、ATRを基に自動計算されたエントリー、ストップロス、テイクプロフィットレベルを備えた明確なLong・Shortシグナルを提供するため、リスク管理が最初から組み込まれています。 マ
Smart Trend Trading System — MetaTrader 5 ご購入後、MQL5で私にメッセージをお送りいただくと、Smart Universal Expert Advisorを無料で受け取れるほか、オンライン講座、PDFマニュアル、非公開グループへのアクセスもご利用いただけます。 STTSは、トレンドの方向、エントリー・決済シグナル、反転ゾーン、重要な価格水準をチャート上にまとめて表示します。システムを参考に手動で取引することも、別の対応EAを接続し、ご自身で選んだ設定に基づいて自動売買することもできます。 ひとつのシステム、4つのトレードアプローチ STTSのトレードアプローチは、大きく4つのカテゴリーに分かれています。 • スキャルピング — 短期的なシグナルや相場の動きを捉えます。 • トレンドトレード — 方向性を評価し、トレンド内の機会を探します。 • 反転トレード — 反転の可能性があるゾーンや方向の変化を見つけます。 • 出来高トレード — 出来高に基づく情報を使い、市場の活発さを評価します。 エントリー・決済の矢印、トレンド情報、サポート・
あなたのトレード優位性を視界に入れよう! M5 Sniper は MeanFX による新しいインジケーターです。 正確なトレードシグナル と 適応型TP/SLレベル を組み合わせることで、結果として可能な限り最高の統計的トレードを実現します! 5回購入されるごとに価格が上昇し、次の価格は69$です 購入後に私にメッセージを送っていただければ、ヒント/ガイドとボーナスEAをお受け取りいただけます 何が他と違うのでしょうか? Gold XAUUSDにおける 実証済みの統計的パフォーマンス ( ほぼすべてのアセットで機能します 。一貫した結果が得られないまま何でも扱おうとするのではなく、1つの時間足をマスターすることに重点を置いています) 1日あたり1~8回のトレード を各シンボルで実行し、高い勝率と、すべての統計的優位性をこちら側に持つことができます チャート上には 確認済みの BUYおよびSELLシグナルのみを表示 適応型TPおよびSLレベル を各トレードごとにインジケーターが生成 平均Winrate 75%+ 平均 Signal Ratio 最低1.1+ アラーム と通知を 携帯電話
SuperScalp Pro
Van Minh Nguyen
4.54 (37)
SuperScalp Pro - Professional Multi-Layer Confluence Scalping System SuperScalp Proは、複数の高度な確認フィルターを追加することで、従来のSupertrendを強化したスキャルピング向けインジケーターです。誤ったシグナルを大幅に減らしながら、成功する可能性がより高いBuy/Sellの取引機会を見つけるのに役立ちます。 BuyとSellの矢印がチャート上に明確に表示され、ATRに基づくStop LossとTake Profitのレベルもリアルタイムで自動計算されます。 ご購入後、MQL5で私にメッセージを送っていただくと、SuperScalp Pro Auto Trader EAを無料で受け取れるほか、ユーザーガイドとプライベートグループへのアクセスもご利用いただけます。 推奨設定ファイルをダウンロード: [Set File] 詳細なドキュメントは製品ブログでご覧いただけます: [User Guide] 最新情報を受け取るには公式チャンネルにご参加ください: [Official Channel] Sup
Gann Made Easy   は、ミスター・ギャンの理論を使用した取引の最良の原則に基づいた、プロフェッショナルで使いやすい外国為替取引システムです。 W・D・ガン。このインジケーターは、ストップロスとテイクプロフィットレベルを含む正確な買いと売りのシグナルを提供します。 PUSH通知を利用して外出先でも取引可能です。 ご購入後、取引方法の説明と優れた追加インジケーターを無料で入手するには、私にご連絡ください! おそらく、ギャンの取引手法についてはすでに何度も聞いたことがあるでしょう。通常、ギャンの理論は初心者のトレーダーだけでなく、すでにある程度の取引経験がある人にとっても非常に複雑なものです。なぜなら、ギャンの取引手法は理論的にはそれほど簡単に適用できるものではないからです。私はその知識を磨き、最良の原則を私の外国為替インジケーターに組み込むために数年を費やしました。 このインジケーターは非常に簡単に適用できます。必要なのは、それをチャートに添付し、簡単な取引推奨事項に従うだけです。このインジケーターは常に市場分析の仕事を行い、取引の機会を探します。適切なエントリーポイントを検
Entry Points Proは、注文を出す前に、どこでエントリーし、どこにストップを置き、どのロットで取引するかを示します。 価格 現在 149 USD、この価格での販売は残り1本です。その後は 199 USD に値上がりし、最終価格は 349 USD です。 私は相場のトレードで収入を得ており、それを公開しています。だから、このインジケーターを誰にでも売る必要はありません。自分の頭で考えるトレーダーのためのツールであり、魔法のボタンではありません。 矢印はローソク足の確定時に表示され、リペイントしません。設定は2つ:あなたの資金と1回のトレードあたりのリスクです。 お支払い前にご確認ください:無料デモはMT5のストラテジーテスターで動作し、2分で済みます。ご購入後は、私が個人的に設定をお手伝いします。 2019年、私はこのインジケーターの実力を世界中に示しました。そのシグナルに従って手動で、リアル口座で、公開の場でトレードしたのです。口座はMyfxbookでモニタリングされ、私はこの実験の経過をFacebookで詳しく発信していました。結果:4か月で10,000ドルが941,4
ULTRAは、「オールインワン」方式で機能するテクニカル指標です。市場を独自に分析し、売買シグナルを生成し、ストップロス注文を設定するための水準を表示し、利益を確定したり損失を最小限に抑えたりするためにポジションを決済すべきタイミングを提案します。 つまり、市場の分析方法や、水準(ストップロスをどこに設定すべきか)の見極め方がわからなくても、あるいは資金管理に苦労していても問題ありません。ULTRAがすべて代行してくれます! 購入者限定特典 :「ULTRA」インジケーターをご購入後、私にプライベートメッセージをお送りいただければ、「ULTRA BOT」を無料プレゼントとしてお受け取りいただけます。これは、このインジケーターからのシグナルに基づいて、オープンしたトレードを管理するのに役立つ特別なツールです(各トレードにストップロスを設定し、最適な結果が得られるよう、戦略のルールに従って自動的にトレードを決済します)。  また、インジケーターを最大限に活用できるよう、さまざまな資産向けの既成の設定も購入者の皆様に提供しています。これらの「超お得な特典」を無料で入手するには、私へダイレクトメ
SMC Intraday Formula
VividMind Digital Solutions
5 (26)
まず正直に言いましょう。 どんなインジケーターも、それ単体であなたを利益化させることはできません。もしそう言う人がいるなら、それは夢を売っているだけです。完璧な売買シグナル(矢印)を表示するインジケーターは、いくらでも“完璧に見せる”ことができます。正しい過去の区間を拡大して、勝ちトレードだけを切り取ればいいだけです。私たちはそれをしません。 SMC Intraday Formula はツールです。 市場構造を読み取り、最も高い確率の価格ゾーンを特定し、今この瞬間のスマートマネーの痕跡をシンプルな言葉で正確に示します。最終判断はあなたが行います。トレードを実行するのもあなたです。しかし今は「希望」ではなく「精度」でエントリーできます。 私たちはこのインジケーターを、ゴールド(XAUUSD)および主要FX通貨ペアで約3年間、日々のスキャルピングに使用してきました。M1、M5、M15、M30の主要ツールです。これは未来を予測しようとするのではなく、今まさに形成されている高確率セットアップを示し、その理由を説明します。 他のすべてのインジケーターと何が違うのか? ほとんどのトレーディングイ
M1 SNIPER は使いやすいトレーディングインジケーターシステムです。M1時間足向けに設計された矢印インジケーターです。M1時間足でのスキャルピングのためのスタンドアロンシステムとして、また既存のトレーディングシステムの一部としても使用できます。このトレーディングシステムはM1時間足での取引に特化して設計されていますが、他の時間足でも使用できます。元々、この手法はXAUUSDとBTCUSDの取引用に設計しましたが、他の市場においても役立つと考えています。 インジケーターのシグナルは、トレンドの方向と逆方向に取引できます。インジケーターのシグナルを利用して両方向に取引するのに役立つ特別な取引テクニックをご紹介します。この手法は、特別な動的なサポートとレジスタンスの価格帯を利用することに基づいています。 ご購入後、M1 SNIPER矢印インジケーターをすぐにダウンロードできます。さらに、M1 SNIPERツールのすべてのユーザーに、以下のスクリーンショットに表示されているApollo Dynamic SRインジケーターを無料で提供しています。この2つのインジケーターを組み合わせることで
次回アップデート — バージョン 2.52 近日公開!【新機能】 市場分析とトレードワークフローを強化する、4つの主要な新機能にご期待ください 皆様のトレードニーズに応える4つの新機能により、市場分析を次のレベルへと引き上げます。新機能をご紹介します: 1. TRADE OVERVIEW DASHBOARD 2. CONFLUENCE AT ZONE 3. STRONG & WEAK HIGH/LOW 4. OTE 1. TRADE OVERVIEW DASHBOARD 市場全体の状況をより簡単に把握できるダッシュボードです。トレード判断をサポートするガイダンスを提供し、市場分析とトレード計画を体系的に行えるよう支援します。すべてを1つの画面で確認できます。 マルチタイムフレーム市場概要(Multi-Timeframe Market Overview) 市場の方向性と価格構造をより明確に把握 市場状況をすばやく確認 体系的な市場分析とエントリー計画のためのガイダンス 2. CONFLUENCE AT ZONE 価格が重要なゾーンに入るとき…いくつのサポート要因が一致しているかを確認で
Adaptive Price Action Engine インジケーターを購入すると、EAが無料に マルチタイムフレーム対応・自己最適化トレンド&ローソク足パターン分析 市場環境は常に変化しており、すべてのPrice Actionパターンが、あらゆる市場環境で同じ価値を持つわけではありません。 Adaptive Price Action Engine は、変化する市場環境への適応を目的として、 トレンド構造、マルチタイムフレーム分析、ローソク足パターン、統計的最適化 を1つの分析フレームワークに統合しています。 2つのアダプティブモード Dual Alpha Trend Mode 低い時間足と高い時間足のAlpha Trendパラメータを自動的に探索し、直近の市場動向に合わせてトレンド判定を適応させます。 Candlestick + Alpha Mode Alpha Trendによる市場レジーム判定と、 22種類の強気・弱気ローソク足パターン を組み合わせます。すべてのパターンを同じように扱うのではなく、さまざまなパターンの組み合わせを統計的に評価し、選択された市場環境において過去
FiboSniper Pro – Multi-Filter Fibonacci System with Auto SL/TP and Control Panel FiboSniper Proは、動的なFibonacci Envelopesと複数の確認フィルターを組み合わせ、選別されたBuyおよびSellシグナルを生成するテクニカルインジケーターです。FibonacciレベルはMoving AverageとATRを基に計算され、その後ADX、EMA、RSI、ATR、Volume、Time、Candle構造によってフィルタリングされます。インジケーターは、ATRに基づく自動Stop LossおよびTake Profitレベルをチャート上に直接表示し、さらに迅速な調整が可能なインタラクティブControl Panelを提供します。 ご購入後、MQL5で私にメッセージを送っていただくと、Auto Trader Xを無料で受け取れるほか、このインジケーターの取引シグナルを自動化する方法についての説明もご利用いただけます。 User GuideとSet Files: [Click here] 完全
Auto Optimized SpeedAngle は、継続的なウォークフォワード最適化(WFO:Walk-Forward Optimization)によりカーブフィッティング(過剰最適化)を排除した、機関投資家レベルのモメンタムベクトルシステムです。市場レジームの変化時に効果が低下する静的な入力に依存せず、アウトオブサンプル(OOS)検証を用いてパラメーターを動的に再キャリブレーションすることで、表示されるシグナルが単なる過去の偶然ではなく、確実な統計的優位性に基づいていることを保証します。 主な機関投資家向けフレームワーク ウォークフォワード最適化エンジン: ルックバック期間やしきい値の数千に及ぶ組み合わせを継続的にスキャンし、データをインサンプルとアウトオブサンプルに厳格に分離します。未検証のデータ環境において数学的優位性が証明された場合にのみ、新しいパラメーター設定を採用します。 定量的目的関数: 単なる純利益の追求ではなく、機関投資家レベルの安定性指標をターゲットとします。システム品質ナンバー(SQN)、期待値(1トレードあたりの平均Rマルチプル)、またはネットRの最適化を選
Boba Analysis Suite
Trade Ready Solutions LLC
5 (2)
Boba Analysis Suite Boba Analysis Suite は、MetaTrader 5 向けの分析インジケーターです。市場構造、重要な価格帯、相場全体の状況を、一つのチャート画面にまとめて表示します。 トレーダーおよびトレーディング指導者としての実務経験をもとに開発され、市場の方向性の評価、重要な価格水準の特定、複数の時間足を組み合わせた分析など、体系的な分析プロセスを支援します。 相場の背景を踏まえた分析 個々のシグナルの意味は、相場の状況によって変わります。Boba Analysis Suite は、現在のチャート状況をより大きな市場構造と関連付け、あらかじめ定めたルールに沿って取引アイデアを検討するための分析を支援します。 主な分析機能: トレンドと市場構造: 市場の方向性と、その背景にある構造を評価します。 重要な価格帯と価格水準: さらに分析すべき重要な領域を視覚的に表示します。 複数の時間足: 異なる時間足の情報を組み合わせ、相場全体の状況を評価します。 視覚的な分析プロセス: 分析情報をチャート上で直接確認できます。 自主的な取引判断を支援 Boba
「Scalper Vault」は、デイトレードで安定した成果を目指すトレーダーのために設計された、強力かつ充実した機能を備えたトレーディングシステムです。 この高精度なインジケーターは、それ単体で完結するトレーディングシステムとして機能し、FXやバイナリーオプションのトレーダーに、機関投資家レベルの分析を提供します。 ご購入後、ぜひご連絡ください。 トレードのヒントに加え、豪華なボーナスをプレゼントいたします! 「Scalper Vault」を活用すれば、勘に頼った判断や複雑な手動分析は不要です。使いやすいトレード手法に集中し、純粋に「エントリー・決済」という実行フェーズに専念できます。 高精度なトレンドフォロー・シグナル:中核となるアルゴリズムが市場構造を分析し、主要なトレンド方向に沿った高確率なシグナルを提示します。これにより、誤ったエントリーを大幅に削減できます。 精度の高い天井・底の検知:市場の勢いが尽きたポイントをスキャンし、反転の可能性が高いゾーンを特定します。 ギャン(Gann)理論に基づく売買ゾーン:数学的な「ギャン・レベル」を自動的にチャート上に描画します。機関投資
Apex Patterns PRO インジケーターをご購入いただくと、それに基づいたExpert Advisorを無料でご提供します。 自己最適化するチャートパターンおよびブレイクアウト分析システム 従来のパターンスキャナーは固定のパラメータに依存しているため、市場のボラティリティや構造が変化するとパフォーマンスが低下することがよくあります。 Apex Patterns PROは、構造的なチャートパターン認識、モメンタムフィルタリング、および統計的な自己最適化を単一の分析フレームワークに統合することで、変化する市場環境に適応するように設計されています。 適応型スキャンエンジン 自己最適化パターンモード 最近の履歴データから適切なパターンパラメータを自動的に検索し、静的な設定を使用するのではなく、現在の市場の動きに合わせてインジケーターの構造検出を適応させます。 スマートブレイクアウトフィルタリング 古典的なパターン認識と、モメンタム、ボリューム、プライスアクションの指標を組み合わせます。すべてのブレイクアウトを同じように扱うのではなく、システムが根底にある市場構造を評価し、現在の統計
Crystal Heikin Ashi Signals—Professional Trend & Signal Detection Indicator Advanced Heikin Ashi Visualization with Intelligent Signal System for Manual & Automated Trading Final Price: $149 ---------> Price goes up $10 after every 10 sales . Limited slots available — act fast . Overview User Guide PDF Crystal Heikin Ashi Signals is a professional-grade MetaTrader 5 indicator that combines pure Heikin Ashi candle visualization with an advanced momentum-shift detection system. Designed for both m
トレンドキャッチャーインジケーター トレンドキャッチャーインジケーターは、開発者独自の適応型トレンド分析指標を組み合わせることで、市場価格の動きを分析します。短期的なノイズを除去し、根底にあるモメンタムの強さ、ボラティリティの拡大、価格構造の挙動に焦点を当てることで、真の市場方向性を特定します。また、移動平均線、RSI、ボラティリティフィルターなどの平滑化およびトレンドフィルタリング機能を備えたカスタマイズ指標も使用します。 実際の運用状況のモニタリングやその他の製品については、こちらをご覧ください: https://www.mql5.com/en/users/mechanic/seller ご注意ください。私はTelegramでEAや設定を販売していません。詐欺です。すべての設定はブログで無料で公開しています。 重要!ご購入後すぐにご連絡ください。手順とボーナスをお送りします!
Volatility Master for MetaTrader is a real-time dashboard tool that scans up to  50 symbols  to identify high-volatility , trending markets instantly. With bullish/bearish signals, customizable alerts, and a user-friendly interface, it helps you avoid range-bound conditions and focus on high-probability trades. Clarity leads to confidence. Trade confidently and protect your capital effectively with this powerful dashboard. We don't offer free or bonus indicators in exchange of reviews from you.
SIO Oscillator:自己最適化型セミバリアンス・インバランス・オシレーター インジケーターをご購入いただくと、それをベースにしたエキスパートアドバイザー(EA)を無料でお受け取りいただけます。 多くのオシレーターは、すべての価格変動を同じように扱います。SIOは上昇圧力と下降圧力を分けて捉え、その間のインバランス(不均衡)を測定することで、買い手と売り手のどちらが本当に相場を支配しているかを示します。インバランスが極値に達すると、SIOはエントリー、ストップロス(Stop Loss)、テイクプロフィット(Take Profit)の水準を伴う明確なシグナルを表示します。 SIOの大きな特長は、固定パラメーターに頼らないことです。内蔵の自己最適化機能が、現在の銘柄と時間足に適したパラメーターを継続的に探索し、使用する前に検証します。 2つのシグナルモード 平均回帰(Mean Reversion):インバランスの極値で取引し、均衡への回帰を狙います。 トレンドフォロー(Trend Following):持続的で優勢なインバランスの方向に取引します。 自動モード:最適化機能が直近のデ
多通貨対応の通貨強弱・モメンタム・インジケーター MT5 Dynamic Forex28 Navigator は、長年ご好評いただいているインジケーターの発展版で、3 つの機能を 1 つに統合したものです: Advanced Currency Strength28 Indicator (700 件のレビュー) Advanced Currency IMPULSE with ALERT (530 件のレビュー) CS28 Combo Signals(最近のボーナス) この 2 つの前身インジケーターは MQL5 Market で合計 1,200 件を超えるレビューを獲得しており、2016 年から MT4 コミュニティで定番となっています。Dynamic Forex28 Navigator MT5 は、実績ある同じロジックを引き継いでいます。 MetaTrader 5 向けに完全に再構築 – MT5 ネイティブのマルチシンボル・アーキテクチャを最大限に活かす設計です。 ユーザーマニュアル: https://www.mql5.com/en/blogs/post/758844 MT4 版をお探し
Neuro Poseidon is a new indicator by Daria Rezueva. It combines precise trading signals with adaptive TP/SL levels - creating best possible trades as a result! Message me and get  Neuro Poseidon Assistant  as a gift to automize your trading process! What makes it stand out? 1. Proven profitability on all assets and timeframes 2. Only confirmed BUY and SELL signals present on the chart 3. Adaptive TP & SL levels generated by the software for each trade 4. Easy to understand - suitable for al
AriFocus - Non-Repainting Buy/Sell Signals AriFocus - one clear signal. AriFocus marks buy and sell signals directly on the chart and suggests a stop-loss level for each one. Every signal is confirmed on bar close and never repaints. - Buy/sell arrows, confirmed on bar close - Suggested stop-loss level for every signal - Trend band and candle coloring to show direction at a glance - 10 ready-made presets, or your own settings (14 calculation methods) - Pop-up, push and email alerts with entr
通貨強さウィザードは、取引を成功させるためのオールインワン ソリューションを提供する非常に強力な指標です。このインジケーターは、複数の時間枠のすべての通貨のデータを使用して、このまたはその外国為替ペアのパワーを計算します。このデータは、使いやすい通貨インデックスと通貨パワーラインの形式で表され、特定の通貨のパワーを確認するために使用できます。 必要なのは、取引したいチャートにインジケーターを接続することだけです。インジケーターは、取引する通貨の実際の強さを示します。このインジケーターは、トレンドに合わせて取引するときに有利に利用できる売買高の圧力の極値も示します。このインジケーターには、フィボナッチに基づく可能なターゲットも表示されます。 このインジケーターは、PUSH 通知を含むあらゆるタイプのアラートを提供します。 購入後ご連絡下さい。私の取引のヒントをあなたと共有し、素晴らしいボーナスインジケーターを無料で提供します! 幸せで有益な取引をお祈りします。
Advance AI Scanner is a multi-symbol analysis indicator for MetaTrader 5. It scans Forex pairs, metals, energy, stock indices and cryptocurrencies at the same time and rates each instrument with its own self-training model. It explains in plain English what moved each market and why, and it estimates how far upcoming economic news usually moves each symbol, measured on your broker's own price history. $199 instead of $499. 10 copies left at this price. One time purchase  Installation and User
Azimuth Pro
Ottaviano De Cicco
5 (7)
Azimuth Pro V2:MT5向けシンセティック・フラクタル構造分析と確認済みエントリー 概要 Azimuth Pro は Merkava Labs によるマルチレベルスイング構造インジケーターです。4つのネストされたスイングレイヤー、スイングアンカーVWAP、ABCパターン検出、3タイムフレーム構造フィルタリング、そして確定バーでの確認済みエントリー — 1つのチャートで、ミクロスイングからマクロサイクルまでを網羅するワークフロー。 これはブラインドシグナル製品ではありません。ロケーション、コンテキスト、タイミングを重視するトレーダーのための構造ファーストワークフローです。 ハロウィンプロモーション — 35%オフ 相場が不気味に揺れても、あなたの優位性は鋭いまま。このオファーが霧の中に消える前に、35%オフで手に入れよう。 Azimuth Proが現在259 USD(通常399 USD)。 1. V2での変更点 シンセティック・マルチタイムフレームエンジン 上位タイムフレーム分析をMeridian Proと同じ独自のシンセティックアーキテクチャで一から再構築。より
SkyHammer Signal Pro Entry、SL、TP レベルを固定表示する、プロ仕様のノーリペイント・トレンドシグナルインジケーター SkyHammer Signal Pro は、明確で固定され、検証可能なシグナルを求めるトレーダー向けに設計された、構造的なトレンド・モメンタム系シグナルインジケーターです。 特に M1 と M5 などの短期時間足で最も効果を発揮します。 このインジケーターは、天井や底を予測するためのものではありません。シグナルを出す前に、確認された市場構造、トレンド方向、モメンタムの強さ、健全なボラティリティ、そしてターゲットまでの十分な値幅を確認します。 主な機能 固定シグナルメカニズム シグナルが確認されると、矢印、Entry、Stop Loss、TP1、TP2 の各レベルはチャート上に永久的に固定されます。 その後のローソク足の動きによって、シグナルが消えたり、移動したり、変更されたりすることはありません。 これにより、トレーダーは各シグナルを明確に確認でき、リアルタイム相場中にシグナルが消えるという一般的な問題を避けることができます。 完全な過去シ
Break and Retest Hunter is a powerful MetaTrader 5 indicator designed to automatically identify support and resistance levels, breakout structures, and potential retest opportunities in real time. Bonus Indicator: After purchasing Break and Retest Hunter , contact me to receive Trade Indicator Assistant EA completely free as a bonus utility. $65 for the next 10 copies . Next price is $120.  Combining adaptive market analysis, clear BUY/SELL signals, Fibonacci-based profit targets, and a premiu
Bill Williams Advanced is designed for automatic chart analysis using Bill Williams' "Profitunity" system. The indicator analyzes four timeframes at once. Manual (Be sure to read before purchasing) Advantages 1. Analyzes the chart using Bill Williams' "Profitunity" system. Signals are displayed in a table in the corner of the screen and on the price chart. 2. Finds all known AO and AC signals, as well as zone signals. Equipped with a trend filter based on the Alligator. 3. Finds "Divergence Bar
作者のその他のプロダクト
BotTrader Mini Indice WIN SMC Automated Smart Money Concepts Trading for the Brazilian Mini Index (WIN/B3). BotTrader Mini Indice SMC is an automated Expert Advisor developed primarily for trading Brazilian Mini Ibovespa Index Futures (WIN) on MetaTrader 5. The system combines Smart Money Concepts (SMC), market structure analysis, multi-timeframe confirmation, and automated trade management. Key Features Automated BUY and SELL operations. BOS and CHoCH market structure analysis. Multi-timeframe
フィルタ:
レビューなし
レビューに返信