Spread and Rollover Risk Monitor Pro

Spread and Rollover Risk Monitor Pro for MetaTrader 5

Monitor live spreads, analyze historical spread behavior and assess the exposure of open positions around rollover and throughout the trading day.

Spread and Rollover Risk Monitor Pro is a read-only MT5 indicator designed to make Bid/Ask spread conditions easier to understand. It combines live monitoring, tick-based historical statistics, a configurable rollover countdown, position exposure analysis and a compact or expanded on-chart dashboard.

Live Spread Monitoring

Follow the current Bid/Ask spread in points, with explicit quote-quality states including valid, stale and unavailable. The indicator identifies unusually high spreads using configurable thresholds and available historical references.

Historical Spread Analysis

The indicator analyzes the tick history available from your broker. Statistics include time-weighted mean, median, 90th percentile (P90), minimum and maximum spread. The expanded panel displays an hourly profile with a selectable P90, maximum or mean metric.

History loading progress, calendar coverage, trading-session coverage and sample-quality information are displayed separately. Incomplete or insufficient data is identified rather than silently treated as a complete reference.

Rollover Countdown and Session Awareness

Configure the rollover time using your broker's server clock. The indicator shows the countdown and identifies pre-rollover, rollover and post-rollover periods. It also checks the trading-session information reported by the terminal. Spread anomalies are monitored throughout the trading day, not only during rollover.

Read-Only Position Exposure

For open positions on the current chart symbol, the indicator reads BUY/SELL direction, Stop Loss information and distance from the relevant closing price (Bid for BUY, Ask for SELL). It compares Stop Loss distance with current and historical spread measures and reports clear risk reasons. Hedging and netting accounts are supported.

No trades are placed, closed or modified. The comparison is an informational exposure assessment, not a probability of stop-out or a guarantee that a Stop Loss will be triggered.

Explainable Risk Status

The panel reports NORMAL, CAUTION, HIGH, CRITICAL or DATA UNAVAILABLE, together with a short explanation. The classification considers the current spread, suitable historical references, rollover conditions, quote availability and open-position exposure. It avoids presenting historical percentiles as reliable when the data does not meet the configured quality requirements.

Dashboard and Alerts

  • Compact and expanded on-chart layouts, with adjustable text scale and corner placement.
  • Hourly spread chart with P90, MAX and MEAN views.
  • Optional dashboard, terminal popup and push alerts for abnormal spreads, rollover proximity, elevated risk and normalization.
  • Configurable alert cooldown to limit repeated notifications.
  • Optional CSV archive for spread, rollover and risk observations, with buffered writes and file rotation.

Getting Started

  1. Attach the indicator to the desired MetaTrader 5 chart.
  2. Set the rollover time according to your broker's server time.
  3. Choose the history period and dashboard layout.
  4. Allow the historical loader to collect available tick data. Initial loading time depends on the broker, the selected history period and the terminal environment.
  5. Enable optional popup, push or CSV logging according to your preferences.

Important Notes

The indicator monitors one chart symbol per instance. Historical tick availability and trading-session definitions depend on the broker. Market closures, missing ticks and extraordinary trading schedules can affect statistical coverage. The displayed spreads are in MT5 points; their monetary significance depends on the symbol's contract specifications.

This is an analytical tool, not a trading signal system or an automated trade manager. It cannot prevent slippage, gaps, execution delays or trading losses. No profitability or risk-reduction outcome is guaranteed.

Spread and Rollover Risk Monitor Pro helps traders examine spread conditions and understand potential exposure using information from their own MetaTrader 5 environment.

おすすめのプロダクト
Correlation indicator
Hendrikus Alberto Lauricella
Correlation indicator is a trading indicator that compares price correlations on up to 8 different instruments simultaneously. This indicator is designed to be very versatile. It can be used to trade many different strategies from scalping to hedging to simple trend-following based on an average trend direction of multiple currency pairs or it can signal only when all the pairs correlate on the same side of a particular moving average. The indicator automatically applies the same moving average
JT360 DNA PBO Template V2.7 Public – Multi-Mode Chart Analysis for MetaTrader 5 Product Overview The JT360 DNA PBO Template is a versatile chart analysis tool for MetaTrader 5. It combines multiple candle display modes, six configurable moving averages, Daily/Weekly/Monthly VWAP, and a visual PBO status display in one integrated indicator. The goal is to provide a flexible chart environment that can be adapted to different trading styles and analysis approaches, from short-term intraday trading
Pivot Prof
Paul Anscombe
4.91 (35)
Ulimate MTF Support & Resistance - 5 Star Best Seller  New Year Sale - save $20    (normal price $79) Beginner or Professional our best selling multi-timeframe Pivot Prof will enhance your trading and bring you great trade opportunities with the Support and Resistance levels that professionals use. Pivot trading is a simple effective method for entering and exiting the market at key levels and has been used by professionals for decades and works on all symbols: Forex, Crypto, Stocks, Indicies et
Volumatic VIDYA ダッシュボード Volumatic VIDYA ダッシュボードをご紹介します — 20の通貨ペアと全タイムフレームにわたる買いと売りのシグナルを提供するだけでなく、完全なトレード設定を提供するプロフェッショナルグレードの適応型トレンドスキャナーです:エントリーゾーン、ストップロス、テイクプロフィット — すべてのシグナルで自動的に計算されます。 推測不要。手動計算不要。実行に必要なすべてを備えた適応型シグナルのみ。 これに心当たりはありませんか? トレンドエントリーを探して何十ものチャートを手動でスキャンしている — それでもほとんどを見逃している 適切なタイミングで見ていなかったため、利益の出るプルバックエントリーを逃している 数学ではなく推測に基づいてストップロスとテイクプロフィットを設定している 固定移動平均線がトレンド中に遅れすぎるか、レンジ中に偽シグナルを出している チャート分析に何時間も費やし、自信を持ってトレードを執行できていない これらのいずれかが当てはまるなら — Volumatic VIDYA ダッシュボードはまさにあなたのために作ら
Multi Chart Synchronizer: 究極のマルチチャート同期装置  Multi Chart Synchronizer は、マルチタイムフレーム分析とヒストリカルバックテストを効率化するために設計されたプロフェッショナルグレードの同期ツールです。チャートを手動で調整する手間が省けるため、プライスアクションと戦略策定に集中できます。 主なメリット 履歴バックテストに最適化:   過去の市場データを分析して優位性を高めるトレーダーに最適です。 シームレスなMTF分析:   同じ銘柄の複数のチャートを瞬時に同期します。上位時間枠でトレンドの成立を特定すると、キーを1回押すだけで、下位時間枠のチャートもすべてその瞬間に合わせて同期されます。 多用途アプリケーション:   複数の時間枠にわたってエントリー条件を確認する必要がある裁量トレーダーと EA 開発者の両方にとって不可欠なツールです。 主な特徴 インスタント同期(Qキー):   特定のローソク足にマウスを移動し、   「Q」   キーを押すだけです。その瞬間、同じ銘柄の開いているすべてのチャートに垂直同期ラインが表示されます
Nexus Prime AIO
Gabriel Balbino De Oliveira
Nexus Quantum AIO – Your Ultimate Trading GPS Tired of messy charts and confusing signals? Most traders fail because they operate in the dark, guessing where the price will go. Nexus Quantum AIO is a complete visual decision-making system. It takes complex institutional calculations and translates them into simple colors and signals on your screen. What does it do for you? The Market Traffic Light: It colors your candles and background. Green (Strong Uptrend), Red (Strong Downtrend), and Gray (S
# Dynamic Pivot Zones - Pivots as zones, not lines *Category: Support and Resistance | Difficulty: beginner | Window: chart window (overlaid on price) | Markets: Universal (Forex, indices, commodities, crypto, stocks) | Suggested timeframes: M5, M15, M30, H1* ## Short description > Turns pivots into zones whose width depends on the previous period volatility. The levels stay fixed for the whole session, with no recalculation. ## Full description ### Overview Classic pivots are infinitely
Currency Strength & Pair Selection Dashboard is a MetaTrader 5 indicator for manual FX analysis. It ranks eight major currencies — USD, EUR, GBP, JPY, CHF, CAD, AUD, and NZD — using closed-bar relative returns from available broker currency pairs. Multi-timeframe analysis (configurable 1–4 timeframes) shows trend, momentum, and MTF agreement for each currency. The pair-selection table ranks candidate pairs by currency-strength difference and labels alignment as Strong, Moderate, Neutral, or Mixe
FREE
トレードチャンスを逃したくないけど、ずっとチャートを見続けるのは辛い・・・・ そんなあなたのために、この商品が存在します!! Touch Alert Pro - 商品概要 価格がアラートオブジェクトに到達したら「MetaTrader5」アプリに通知を送るインジケーターです。チャート上のボタンを押して自由にアラートオブジェクトを追加・削除できます。また、アラートオブジェクトごとに通知上限回数を設定することができます。自動売買の機能はないため、トレード補助のツールとしてお使いください。 - 機能説明 ①コントロールパネル 6つのボタンで構成されています。上からボタンの機能を紹介します。 ・水平線作成ボタン:アラート機能を持つ水平線を1つチャート上に設置します。 ・チャネルライン作成ボタン:アラート機能を持つチャネルラインを1つチャート上に設置します。 ・トレンドライン作成ボタン:アラート機能を持つトレンドラインを1つチャート上に設置します。 ・フィボナッチリトレースメント作成ボタン:アラート機能を持つフィボナッチリトレースメントを1つチャート上に設置します。 ・フィボナ
Spread Monitor and Logger は、現在の銘柄におけるブローカーのスプレッドを記録します。スプレッドが広がるタイミング(ロールオーバー、ニュース、閑散時間帯)を示し、表計算ソフトで開けるシンプルなログを残します。 仕組み - インジケーターは毎秒、現在のスプレッドをポイント単位で読み取ります。サンプルは銘柄が気配値を出している間(直近1分以内に新しいティックがある場合)だけカウントされるため、市場が閉まっている時間帯で統計が下がることはありません。 - パネルには、現在のスプレッド、現在のサーバー時間(1時間単位)の平均・最小・最大、そして本日の最大値とその時刻が表示されます。 - サーバー時間の各1時間の終わりに、ターミナルのサンドボックス内の CSV ファイルに1行を追記します:MQL5\Files\DinexSpread\<symbol>.csv。各行には日付、時間、銘柄、サンプル数、スプレッドの平均・最小・最大が入ります。 - スプレッドが固定ポイント数を超えたとき、または現在の1時間の平均の一定倍数を超えたとき(デフォルトは 3x、30 サンプル以降)に
FREE
MT5 Drawdown Tracker – Track Your EA’s Performance with Precision! Take your trading analysis to the next level with our MT5 indicator designed to monitor, record, and report the drawdown of any Expert Advisor. Whether you’re fine-tuning your strategies or optimizing risk management, this tool gives you the insights you need. Key Features: Effortless Tracking: Automatically monitors the drawdown levels of your EAs with precision. Comprehensive Data Storage: Accurately logs each drawdown event,
News Bias Engine — Real-Time Economic Calendar with Post-News Directional Bias Most news indicators show you WHEN events happen. News Bias Engine tells you WHAT TO DO after they happen. THE PROBLEM WITH STANDARD NEWS INDICATORS Every economic calendar tool on the market does the same thing: displays upcoming events with countdown timers. That's useful, but it's only half the job. The real question after NFP, CPI, or an FOMC rel
Passage Victorious is a handy tool, and even if you are used to trading on a clean chart, sometimes you need to take a look at this indicator. If you are not sure how to determine the trend inflection point and are concerned about how to draw trend lines then this indicator is for you. From now on, you do not need to sit near the computer and analyze the price, just use this indicator. The indicator calculates saturation levels of the price chart. A signal to exit the oversold area is a buy si
Session Liquidity Pro — institutional-grade session mapping for MetaTrader 5, by DEFPARAM Labs. WHAT IT DOES • Draws Asian, London and New York session ranges as shaded boxes with High, Low and 50% Equilibrium levels (optionally extended to the right) • Builds a custom Opening Range (ORB) box with user-defined start time and duration • Detects confirmed liquidity sweeps (stop hunts): when price takes out a completed session high/low and closes back inside, an arrow prints on the closed bar • L
NQX Session Range BreakoutはMetaTrader 5用のシグナルインジケーターです:欧州オープン時のオーバーナイトレンジのブレイクアウト。 静かなオーバーナイトレンジを把握し、欧州時間帯にそのレンジを明確に超えて引けた最初の足でシグナルを出すNQX独自のロジックです。推奨エントリー、短いストップ、遠めのターゲット(3:1、5:1、10:1)を表示します。判断するのはあなたです。 チャート上に表示されるもの - 確定したシグナル足に矢印を表示します(確定したシグナルがリペイントされることはありません)。 - 推奨エントリー、短いストップ、遠めの推奨ターゲット(デフォルトはリスクの5倍)、さらに3 x 1、5 x 1、10 x 1の参考ライン。 - レベルに到達すると、チャート上にラベル(ターゲットまたはストップ)が表示されます。 - 最新のシグナルと、表示中の履歴に出現したシグナル数を示すパネル。 - 新しいシグナルのポップアップ通知とプッシュ通知(オプション)。 NQX独占ロジック:他のどのNQXインジケーターもこのエントリーシグナルとマーケットフィルターの組
This is a highly accurate spike detector especially on higher time frames. This indicator is created for Boom and Crash Markets on Deriv and PainX and GainX Markets on Weltrade. There are a lot of settings to adjust to your strategy. It uses a highly secret algorithm that allows this spike detector to pick up signals all time frames. This indicator will pay itself off in one week. Make sure you stay below or above 60 SMA depending on if you are buying or selling. Once you cross the 200 SMA in th
RM Multi-Chart Backtester Multi-Timeframe Manual Backtesting for MetaTrader 5. Are you tired of the limits of the MT5 Strategy Tester? Do you want true multi-timeframe manual backtesting, with several charts open at once and no accidental look at future price action? RM Multi-Chart Backtester turns your normal MetaTrader 5 charts into an interactive, fully synchronized replay. Test your ICT, SMC, Price Action or mechanical strategies on many timeframes at the same moment in history, with your ow
Gold Position Size Calculator (XAUUSD) - a free risk-based lot size calculator built specifically for gold traders. Enter your account balance, risk percentage, entry price and stop-loss price. The calculator instantly shows the correct lot size, risk amount, stop distance, risk/reward ratio and potential profit - so every gold trade risks exactly what you allow, never more. Features: Built for Gold (XAUUSD), works on any forex pair Auto-detects contract size from the symbol specification (no ma
FREE
Channel Creator
Ross Adam Langlands Nelson
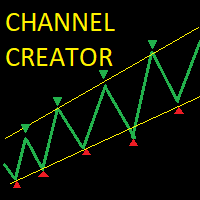
The auto-channel indicator creates a top line and bottom line that encloses a channel within which the symbol has been trading.  The channel is created by finding high points for the top line and low points for the bottom line, these points are shown with arrows. A line of best fit is then plotted through these points and extended until the end of the chart. This indicator is useful for trading both within the channel and for breakouts. Inputs: MAPeriod - The moving average period over which the
Pair correlation divergence. Define your pair in indicator setting with this format : SYMBOL1:SYMBOL2,SYMBOL3:SYMBOL4 Already Defined Symbols : EURUSD:GBPUSD,AUDUSD:NZDUSD,USDCHF:EURUSD,USDCAD:Crude,XAUUSD:AUDUSD Symbol name should match the exact case as you see it in left panel where all symbols are listed. CAUTION  : If you drag any symbol on screen and indicator doesn't paint(live mode, not strategy tester) then just  Right click-> indicators list-> select divergence indicator-> edit-> ok-
30 Indicator Comment Center — Your Full Trading Desk on One Chart 30 Indicator Comment Center turns your MetaTrader 5 chart into a complete confluence-trading workstation. Instead of stacking a dozen separate indicators and guessing how they agree, this tool runs 30 professional-grade technical engines simultaneously , blends them into a single live verdict, and presents everything through a clean, modern six-page interface — built right on your chart. No more switching windows. No more mental
概要 ATRマルチレベルおよび移動平均バンドインジケーターは、トレーダーが市場のトレンド、サポートおよびレジスタンスレベル、ボラティリティを特定するのを支援する強力なツールです。このインジケーターは、価格変動の周りにビジュアルバンドを作成するために、複数の移動平均とATR(平均真の範囲)乗数を組み合わせています。これにより、トレーダーは潜在的な反転ポイント、トレンド条件、および市場の統合ゾーンを検出するのに役立ちます。 特徴 複数バンドの視覚化: トレンドを簡単に識別するために、赤、オレンジ、黄色、緑、青、紫などの異なる色で、6つの動的バンドを表示します。 ATRボラティリティバンド: 市場のボラティリティに基づいてバンドのグラフを調整し、反転または価格の継続の可能性について明確な視覚的信号を提供します。 カスタマイズ可能なパラメーター: ATR乗数と移動平均の期間を調整可能で、市場の異なる条件やトレーディング戦略に適応します。 トレンドの明確な識別: バンドはボラティリティに応じて拡張および収縮し、トレーダーがトレンド、統合期間、および潜在的なブレイクポイントを簡単に視認できます。
FREE
The   Correlation Matrix   indicator shows the actual correlation between the selected instruments. The default setting is set to 28 currency pairs, gold, and silver, but the indicator can compare any other symbols. Interpretation of the indicator Positive correlation  (correlation is above 80 %). Negative correlation  (correlation is below -80 %). Weak or no correlation  (correlation is between -80 and 80 %). Main features The indicator shows the actual correlation between the selected instr
Big Price Display Big Price Display is a lightweight MetaTrader 5 chart indicator that shows live bid , ask , and current price in a clean on-chart panel you can place anywhere. It reads live quotes from the chart symbol and updates in real time. Choose what to show, how it looks, and where it sits on the chart — all through simple input settings. Key Features Live current price — mid, last, bid, or ask (your choice) Bid and ask — shown separately with individual colors Spread — displayed in poi
Dual Striker - ゴールド取引向けの新しいEAです。 ライブシグナル +150% ->   リアル口座 マーチンゲールなし、ナンピンなし お使いの取引プラットフォームで無料テスト:   Dual Striker EA ほとんどのトレーダーは ZigZag を誤って使用しています。 それは市場理解を助けるどころか、誤ったシグナルを生み、トレンドの認識を歪めます。 Valable ZigZag はこの問題を解決します 。価格の動きの本質的な構造と市場の方向を示します。 従来の ZigZag の限界 従来の ZigZag は過剰に多くの動きに反応します。 その結果: 小さな押し目でも大きな変化のように見える レベルのブレイクがシグナルとして認識されるが、継続しない 調整と本当のトレンド転換の区別が難しくなる これにより不要な行動が増え、現在の市場の動きを正しく理解できなくなります。 VALABLE ZIGZAG がトレンドを定義する仕組み 以下はインジケーターの仕組みの簡単な説明です。チャート上で方向がどのように形成されるかを理解する助けになります。 Valable Zi
FREE
Gamma Volatility Levels
Carlos Pascual Perez Maturano
Gamma & Volatility Levels Pro [XAUUSD Edition] – The indicator used by professional gold traders in 2025 Fully automatic indicator developed exclusively for XAUUSD (Gold). Displays in real time the most powerful institutional levels that move gold price every single day: • HVL (High Volatility Level) – Orange dashed line Dynamic extreme volatility level (20-period SMA + 1 standard deviation). Gold bounces or breaks this level 87 % of sessions with moves of +$40 to +$120. • CALL RESISTANCE – Blue
概要 Candle Timer Countdown Pro は、現在のローソク足が終了するまでの残り時間を、滑らかで正確なカウントダウンとして表示します。さらに、円形のプログレスアーク(進行表示)を組み合わせることで、残り時間を瞬時に視覚的に把握できます。 ティック間で停止したり、時間がずれてしまう他のタイマーとは異なり、本インジケーターはサーバー時間の補間(Server Time Interpolation)を使用し、M1 から MN まであらゆる時間足で途切れのないスムーズなカウントダウンを実現します。 1分足でのスキャルピングでも、H4でのスイングトレードでも、現在のローソク足が正確にいつ確定するのかを把握することで、エントリータイミングの最適化、ローソク足パターンの確認、そして早すぎる判断の回避に役立ちます。 このタイマーが他と違う理由 多くの MT5 用キャンドルタイマーは TimeCurrent() のみに依存しており、新しいティックが到着したときにしか更新されません。低ボラティリティ時や上位時間足では、ティックの間隔が数秒空くことがあり、その間タイマーが停止し、その後突
Heiken_Ashi_Bars - MT5用 高度なトレンド可視化ツール 概要 Heiken_Ashi_Bars は、市場のノイズを取り除き、真のトレンドを浮き彫りにするために設計された、強力で視覚的に直感的なカスタムインジケーターです。従来のローソク足チャートは不規則な動きが多く、ダマシのシグナルにつながることがよくあります。価格データを平均化することで、このインジケーターはプライスアクションを滑らかにし、トレンドの継続、反転、および利益の出るエントリーポイントを非常に簡単に見つけることができます。 主な機能と利点 究極のノイズリダクション: 小さな価格のスパイクや持ち合いのノイズをフィルタリングします。 明確な視覚的シグナル: 色分けされたバーにより、強気および弱気のモメンタムを一目で確認できます。 リペイントなし (No Repaint): バーが確定するとシグナルは固定され、過去のバーを再計算しません。 高度に最適化: ターミナルの遅延をゼロにするクリーンなコード。 多用途: すべての金融商品 (FX、インデックス、貴金属、仮想通貨) で完璧に機能します。 トレード方法 上昇
「Apollo Price Action System」は、純粋なプライスアクションの原則に基づいて構築された強力な取引インジケーターです。市場や価格の動きを分析し、勝率の高い取引機会を特定します。インジケーターの内部ロジックが定める市場条件が完全に整うと、即座に「買い」または「売り」のシグナルを生成します。 ご購入後、取引のヒントと素敵な特典をお渡ししますので、ぜひご連絡ください! Apollo Price Action Systemは、純粋に価格変動に基づいたロジックを採用しているため、単独で完結する完全な取引システムとして利用できるほか、既存の戦略にシームレスに組み込み、エントリーの精度を高めるための確認ツールとして活用することも可能です。 このインジケーターは、シンプルで使いやすい設計となっており、複雑な設定や高度なテクニカル分析のスキルは必要ありません。現在の市場の方向性を可視化するためにチャート上へトレンドラインを自動描画するほか、適切なリスク管理を行うためのエントリーシグナル(矢印)や、それに対応する損切り(ストップロス)レベルも表示します。 Apollo Price A
The indicator creates 2 dot lines representing an upper and lower bands and the main indicator aqua line as the price power. If the main line is swimming inside the bands, then you should wait and watch before entering the market. When the main line jumps out or in the bands, then you should make a long or a short position.
このプロダクトを購入した人は以下も購入しています
Trend Sniper X
Sarvarbek Abduvoxobov
4.86 (44)
Trend Sniper X は、トレードの方向性と潜在的な反転ポイントを明確かつ正確に特定するのに役立つ、MetaTrader 5 用のマルチタイムフレーム・トレンドフォロー指標です。 MT4用: https://www.mql5.com/en/market/product/193245 価格情報: 現在の価格はプロモーション価格であり、今後のアップデートや新機能のリリースに伴い変更される場合があります。 ボーナス特典: このインジケーター用の無料自動売買アシスタントEAを入手するには、購入後に an 著者(開発者)へメッセージをお送りください。 Code2Profit チャンネル マルチタイムフレーム分析で相場をマスターしよう! Trend Sniper X で勝率を最大化する方法:重要なルールとセッションのコツ 技術仕様 プラットフォーム MetaTrader 5 インジケータータイプ マルチタイムフレーム・トレンドインジケーター 操作タイムフレーム あらゆるチャートタイムフレームに対応。個別に選択可能な上位タイムフレーム (M1–MN1) を搭載 主要銘柄 FX、ゴールド (X
新たな王者が登場 - インジケーター + 注文管理表示(TP1 + TP2 + TP3)+ オプションのTelegramシグナル送信機能付き(無料) (完全なトレード&シグナルシステム) ゴールド向け最高のEA: Gold Slayer このインジケーターには、高度な戦略、カスタマイズ可能な注文管理システム、そしてエンベロープ拡張を組み合わせた平均回帰システムが搭載されています。さらに、RSIなど複数のインテリジェントな確認フィルターによって、高確率の反転エントリーをBUY・SELLシグナルとして検出します。 単にトレードを学ぶだけでなく、複数ポジションを効果的に管理し、過去に利益を出しているオープンポジションで損失トレードをカバーする方法も学べます。 M5向けに構築・最適化されており、流動性が高くシグナルの精度が安定しているBTCUSDとXAUUSDで優れたパフォーマンスを発揮します。 このインジケーターは、ATRを基に自動計算されたエントリー、ストップロス、テイクプロフィットレベルを備えた明確なLong・Shortシグナルを提供するため、リスク管理が最初から組み込まれています。 マ
Smart Trend Trading System — MetaTrader 5 ご購入後、MQL5で私にメッセージをお送りいただくと、Smart Universal Expert Advisorを無料で受け取れるほか、オンライン講座、PDFマニュアル、非公開グループへのアクセスもご利用いただけます。 STTSは、トレンドの方向、エントリー・決済シグナル、反転ゾーン、重要な価格水準をチャート上にまとめて表示します。システムを参考に手動で取引することも、別の対応EAを接続し、ご自身で選んだ設定に基づいて自動売買することもできます。 ひとつのシステム、4つのトレードアプローチ STTSのトレードアプローチは、大きく4つのカテゴリーに分かれています。 • スキャルピング — 短期的なシグナルや相場の動きを捉えます。 • トレンドトレード — 方向性を評価し、トレンド内の機会を探します。 • 反転トレード — 反転の可能性があるゾーンや方向の変化を見つけます。 • 出来高トレード — 出来高に基づく情報を使い、市場の活発さを評価します。 エントリー・決済の矢印、トレンド情報、サポート・
あなたのトレード優位性を視界に入れよう! M5 Sniper は MeanFX による新しいインジケーターです。 正確なトレードシグナル と 適応型TP/SLレベル を組み合わせることで、結果として可能な限り最高の統計的トレードを実現します! 5回購入されるごとに価格が上昇し、次の価格は69$です 購入後に私にメッセージを送っていただければ、ヒント/ガイドとボーナスEAをお受け取りいただけます 何が他と違うのでしょうか? Gold XAUUSDにおける 実証済みの統計的パフォーマンス ( ほぼすべてのアセットで機能します 。一貫した結果が得られないまま何でも扱おうとするのではなく、1つの時間足をマスターすることに重点を置いています) 1日あたり1~8回のトレード を各シンボルで実行し、高い勝率と、すべての統計的優位性をこちら側に持つことができます チャート上には 確認済みの BUYおよびSELLシグナルのみを表示 適応型TPおよびSLレベル を各トレードごとにインジケーターが生成 平均Winrate 75%+ 平均 Signal Ratio 最低1.1+ アラーム と通知を 携帯電話
SuperScalp Pro
Van Minh Nguyen
4.54 (37)
SuperScalp Pro - Professional Multi-Layer Confluence Scalping System SuperScalp Proは、複数の高度な確認フィルターを追加することで、従来のSupertrendを強化したスキャルピング向けインジケーターです。誤ったシグナルを大幅に減らしながら、成功する可能性がより高いBuy/Sellの取引機会を見つけるのに役立ちます。 BuyとSellの矢印がチャート上に明確に表示され、ATRに基づくStop LossとTake Profitのレベルもリアルタイムで自動計算されます。 ご購入後、MQL5で私にメッセージを送っていただくと、SuperScalp Pro Auto Trader EAを無料で受け取れるほか、ユーザーガイドとプライベートグループへのアクセスもご利用いただけます。 推奨設定ファイルをダウンロード: [Set File] 詳細なドキュメントは製品ブログでご覧いただけます: [User Guide] 最新情報を受け取るには公式チャンネルにご参加ください: [Official Channel] Sup
Gann Made Easy   は、ミスター・ギャンの理論を使用した取引の最良の原則に基づいた、プロフェッショナルで使いやすい外国為替取引システムです。 W・D・ガン。このインジケーターは、ストップロスとテイクプロフィットレベルを含む正確な買いと売りのシグナルを提供します。 PUSH通知を利用して外出先でも取引可能です。 ご購入後、取引方法の説明と優れた追加インジケーターを無料で入手するには、私にご連絡ください! おそらく、ギャンの取引手法についてはすでに何度も聞いたことがあるでしょう。通常、ギャンの理論は初心者のトレーダーだけでなく、すでにある程度の取引経験がある人にとっても非常に複雑なものです。なぜなら、ギャンの取引手法は理論的にはそれほど簡単に適用できるものではないからです。私はその知識を磨き、最良の原則を私の外国為替インジケーターに組み込むために数年を費やしました。 このインジケーターは非常に簡単に適用できます。必要なのは、それをチャートに添付し、簡単な取引推奨事項に従うだけです。このインジケーターは常に市場分析の仕事を行い、取引の機会を探します。適切なエントリーポイントを検
Entry Points Proは、注文を出す前に、どこでエントリーし、どこにストップを置き、どのロットで取引するかを示します。 価格 現在 149 USD、この価格での販売は残り1本です。その後は 199 USD に値上がりし、最終価格は 349 USD です。 私は相場のトレードで収入を得ており、それを公開しています。だから、このインジケーターを誰にでも売る必要はありません。自分の頭で考えるトレーダーのためのツールであり、魔法のボタンではありません。 矢印はローソク足の確定時に表示され、リペイントしません。設定は2つ:あなたの資金と1回のトレードあたりのリスクです。 お支払い前にご確認ください:無料デモはMT5のストラテジーテスターで動作し、2分で済みます。ご購入後は、私が個人的に設定をお手伝いします。 2019年、私はこのインジケーターの実力を世界中に示しました。そのシグナルに従って手動で、リアル口座で、公開の場でトレードしたのです。口座はMyfxbookでモニタリングされ、私はこの実験の経過をFacebookで詳しく発信していました。結果:4か月で10,000ドルが941,4
ULTRAは、「オールインワン」方式で機能するテクニカル指標です。市場を独自に分析し、売買シグナルを生成し、ストップロス注文を設定するための水準を表示し、利益を確定したり損失を最小限に抑えたりするためにポジションを決済すべきタイミングを提案します。 つまり、市場の分析方法や、水準(ストップロスをどこに設定すべきか)の見極め方がわからなくても、あるいは資金管理に苦労していても問題ありません。ULTRAがすべて代行してくれます! 購入者限定特典 :「ULTRA」インジケーターをご購入後、私にプライベートメッセージをお送りいただければ、「ULTRA BOT」を無料プレゼントとしてお受け取りいただけます。これは、このインジケーターからのシグナルに基づいて、オープンしたトレードを管理するのに役立つ特別なツールです(各トレードにストップロスを設定し、最適な結果が得られるよう、戦略のルールに従って自動的にトレードを決済します)。  また、インジケーターを最大限に活用できるよう、さまざまな資産向けの既成の設定も購入者の皆様に提供しています。これらの「超お得な特典」を無料で入手するには、私へダイレクトメ
SMC Intraday Formula
VividMind Digital Solutions
5 (26)
まず正直に言いましょう。 どんなインジケーターも、それ単体であなたを利益化させることはできません。もしそう言う人がいるなら、それは夢を売っているだけです。完璧な売買シグナル(矢印)を表示するインジケーターは、いくらでも“完璧に見せる”ことができます。正しい過去の区間を拡大して、勝ちトレードだけを切り取ればいいだけです。私たちはそれをしません。 SMC Intraday Formula はツールです。 市場構造を読み取り、最も高い確率の価格ゾーンを特定し、今この瞬間のスマートマネーの痕跡をシンプルな言葉で正確に示します。最終判断はあなたが行います。トレードを実行するのもあなたです。しかし今は「希望」ではなく「精度」でエントリーできます。 私たちはこのインジケーターを、ゴールド(XAUUSD)および主要FX通貨ペアで約3年間、日々のスキャルピングに使用してきました。M1、M5、M15、M30の主要ツールです。これは未来を予測しようとするのではなく、今まさに形成されている高確率セットアップを示し、その理由を説明します。 他のすべてのインジケーターと何が違うのか? ほとんどのトレーディングイ
M1 SNIPER は使いやすいトレーディングインジケーターシステムです。M1時間足向けに設計された矢印インジケーターです。M1時間足でのスキャルピングのためのスタンドアロンシステムとして、また既存のトレーディングシステムの一部としても使用できます。このトレーディングシステムはM1時間足での取引に特化して設計されていますが、他の時間足でも使用できます。元々、この手法はXAUUSDとBTCUSDの取引用に設計しましたが、他の市場においても役立つと考えています。 インジケーターのシグナルは、トレンドの方向と逆方向に取引できます。インジケーターのシグナルを利用して両方向に取引するのに役立つ特別な取引テクニックをご紹介します。この手法は、特別な動的なサポートとレジスタンスの価格帯を利用することに基づいています。 ご購入後、M1 SNIPER矢印インジケーターをすぐにダウンロードできます。さらに、M1 SNIPERツールのすべてのユーザーに、以下のスクリーンショットに表示されているApollo Dynamic SRインジケーターを無料で提供しています。この2つのインジケーターを組み合わせることで
次回アップデート — バージョン 2.52 近日公開!【新機能】 市場分析とトレードワークフローを強化する、4つの主要な新機能にご期待ください 皆様のトレードニーズに応える4つの新機能により、市場分析を次のレベルへと引き上げます。新機能をご紹介します: 1. TRADE OVERVIEW DASHBOARD 2. CONFLUENCE AT ZONE 3. STRONG & WEAK HIGH/LOW 4. OTE 1. TRADE OVERVIEW DASHBOARD 市場全体の状況をより簡単に把握できるダッシュボードです。トレード判断をサポートするガイダンスを提供し、市場分析とトレード計画を体系的に行えるよう支援します。すべてを1つの画面で確認できます。 マルチタイムフレーム市場概要(Multi-Timeframe Market Overview) 市場の方向性と価格構造をより明確に把握 市場状況をすばやく確認 体系的な市場分析とエントリー計画のためのガイダンス 2. CONFLUENCE AT ZONE 価格が重要なゾーンに入るとき…いくつのサポート要因が一致しているかを確認で
Adaptive Price Action Engine インジケーターを購入すると、EAが無料に マルチタイムフレーム対応・自己最適化トレンド&ローソク足パターン分析 市場環境は常に変化しており、すべてのPrice Actionパターンが、あらゆる市場環境で同じ価値を持つわけではありません。 Adaptive Price Action Engine は、変化する市場環境への適応を目的として、 トレンド構造、マルチタイムフレーム分析、ローソク足パターン、統計的最適化 を1つの分析フレームワークに統合しています。 2つのアダプティブモード Dual Alpha Trend Mode 低い時間足と高い時間足のAlpha Trendパラメータを自動的に探索し、直近の市場動向に合わせてトレンド判定を適応させます。 Candlestick + Alpha Mode Alpha Trendによる市場レジーム判定と、 22種類の強気・弱気ローソク足パターン を組み合わせます。すべてのパターンを同じように扱うのではなく、さまざまなパターンの組み合わせを統計的に評価し、選択された市場環境において過去
FiboSniper Pro – Multi-Filter Fibonacci System with Auto SL/TP and Control Panel FiboSniper Proは、動的なFibonacci Envelopesと複数の確認フィルターを組み合わせ、選別されたBuyおよびSellシグナルを生成するテクニカルインジケーターです。FibonacciレベルはMoving AverageとATRを基に計算され、その後ADX、EMA、RSI、ATR、Volume、Time、Candle構造によってフィルタリングされます。インジケーターは、ATRに基づく自動Stop LossおよびTake Profitレベルをチャート上に直接表示し、さらに迅速な調整が可能なインタラクティブControl Panelを提供します。 ご購入後、MQL5で私にメッセージを送っていただくと、Auto Trader Xを無料で受け取れるほか、このインジケーターの取引シグナルを自動化する方法についての説明もご利用いただけます。 User GuideとSet Files: [Click here] 完全
Auto Optimized SpeedAngle は、継続的なウォークフォワード最適化(WFO:Walk-Forward Optimization)によりカーブフィッティング(過剰最適化)を排除した、機関投資家レベルのモメンタムベクトルシステムです。市場レジームの変化時に効果が低下する静的な入力に依存せず、アウトオブサンプル(OOS)検証を用いてパラメーターを動的に再キャリブレーションすることで、表示されるシグナルが単なる過去の偶然ではなく、確実な統計的優位性に基づいていることを保証します。 主な機関投資家向けフレームワーク ウォークフォワード最適化エンジン: ルックバック期間やしきい値の数千に及ぶ組み合わせを継続的にスキャンし、データをインサンプルとアウトオブサンプルに厳格に分離します。未検証のデータ環境において数学的優位性が証明された場合にのみ、新しいパラメーター設定を採用します。 定量的目的関数: 単なる純利益の追求ではなく、機関投資家レベルの安定性指標をターゲットとします。システム品質ナンバー(SQN)、期待値(1トレードあたりの平均Rマルチプル)、またはネットRの最適化を選
ARICoin is a powerful trading companion designed to generate high-probability entry signals with dynamic TP/SL/DP levels based on volatility. Built-in performance tracking shows win/loss stats, PP1/PP2 hits, and success rates all updated live. Key Features: Buy/Sell signals with adaptive volatility bands Real-time TP/SL/DP levels based on ATR Built-in MA Filter with optional ATR/StdDev volatility Performance stats panel (Success, Profit/Loss, PP1/PP2) Alerts via popup, sound, push, or email Cust
Boba Analysis Suite
Trade Ready Solutions LLC
5 (2)
Boba Analysis Suite Boba Analysis Suite は、MetaTrader 5 向けの分析インジケーターです。市場構造、重要な価格帯、相場全体の状況を、一つのチャート画面にまとめて表示します。 トレーダーおよびトレーディング指導者としての実務経験をもとに開発され、市場の方向性の評価、重要な価格水準の特定、複数の時間足を組み合わせた分析など、体系的な分析プロセスを支援します。 相場の背景を踏まえた分析 個々のシグナルの意味は、相場の状況によって変わります。Boba Analysis Suite は、現在のチャート状況をより大きな市場構造と関連付け、あらかじめ定めたルールに沿って取引アイデアを検討するための分析を支援します。 主な分析機能: トレンドと市場構造: 市場の方向性と、その背景にある構造を評価します。 重要な価格帯と価格水準: さらに分析すべき重要な領域を視覚的に表示します。 複数の時間足: 異なる時間足の情報を組み合わせ、相場全体の状況を評価します。 視覚的な分析プロセス: 分析情報をチャート上で直接確認できます。 自主的な取引判断を支援 Boba
ScalpPoint is a powerful trading companion designed to generate high-probability entry signals with dynamic TP/SL/DP levels based on volatility. Built-in performance tracking shows win/loss stats, PP1/PP2 hits, and success rates — all updated live. Key Features: Buy/Sell signals with adaptive volatility bands Real-time TP/SL/DP levels based on ATR Built-in MA Filter with optional ATR/StdDev volatility Performance stats panel (Success, Profit/Loss, PP1/PP2) Alerts via popup, sound, push, or emai
「Scalper Vault」は、デイトレードで安定した成果を目指すトレーダーのために設計された、強力かつ充実した機能を備えたトレーディングシステムです。 この高精度なインジケーターは、それ単体で完結するトレーディングシステムとして機能し、FXやバイナリーオプションのトレーダーに、機関投資家レベルの分析を提供します。 ご購入後、ぜひご連絡ください。 トレードのヒントに加え、豪華なボーナスをプレゼントいたします! 「Scalper Vault」を活用すれば、勘に頼った判断や複雑な手動分析は不要です。使いやすいトレード手法に集中し、純粋に「エントリー・決済」という実行フェーズに専念できます。 高精度なトレンドフォロー・シグナル:中核となるアルゴリズムが市場構造を分析し、主要なトレンド方向に沿った高確率なシグナルを提示します。これにより、誤ったエントリーを大幅に削減できます。 精度の高い天井・底の検知:市場の勢いが尽きたポイントをスキャンし、反転の可能性が高いゾーンを特定します。 ギャン(Gann)理論に基づく売買ゾーン:数学的な「ギャン・レベル」を自動的にチャート上に描画します。機関投資
Apex Patterns PRO インジケーターをご購入いただくと、それに基づいたExpert Advisorを無料でご提供します。 自己最適化するチャートパターンおよびブレイクアウト分析システム 従来のパターンスキャナーは固定のパラメータに依存しているため、市場のボラティリティや構造が変化するとパフォーマンスが低下することがよくあります。 Apex Patterns PROは、構造的なチャートパターン認識、モメンタムフィルタリング、および統計的な自己最適化を単一の分析フレームワークに統合することで、変化する市場環境に適応するように設計されています。 適応型スキャンエンジン 自己最適化パターンモード 最近の履歴データから適切なパターンパラメータを自動的に検索し、静的な設定を使用するのではなく、現在の市場の動きに合わせてインジケーターの構造検出を適応させます。 スマートブレイクアウトフィルタリング 古典的なパターン認識と、モメンタム、ボリューム、プライスアクションの指標を組み合わせます。すべてのブレイクアウトを同じように扱うのではなく、システムが根底にある市場構造を評価し、現在の統計
Crystal Heikin Ashi Signals—Professional Trend & Signal Detection Indicator Advanced Heikin Ashi Visualization with Intelligent Signal System for Manual & Automated Trading Final Price: $149 ---------> Price goes up $10 after every 10 sales . Limited slots available — act fast . Overview User Guide PDF Crystal Heikin Ashi Signals is a professional-grade MetaTrader 5 indicator that combines pure Heikin Ashi candle visualization with an advanced momentum-shift detection system. Designed for both m
トレンドキャッチャーインジケーター トレンドキャッチャーインジケーターは、開発者独自の適応型トレンド分析指標を組み合わせることで、市場価格の動きを分析します。短期的なノイズを除去し、根底にあるモメンタムの強さ、ボラティリティの拡大、価格構造の挙動に焦点を当てることで、真の市場方向性を特定します。また、移動平均線、RSI、ボラティリティフィルターなどの平滑化およびトレンドフィルタリング機能を備えたカスタマイズ指標も使用します。 実際の運用状況のモニタリングやその他の製品については、こちらをご覧ください: https://www.mql5.com/en/users/mechanic/seller ご注意ください。私はTelegramでEAや設定を販売していません。詐欺です。すべての設定はブログで無料で公開しています。 重要!ご購入後すぐにご連絡ください。手順とボーナスをお送りします!
Volatility Master for MetaTrader is a real-time dashboard tool that scans up to  50 symbols  to identify high-volatility , trending markets instantly. With bullish/bearish signals, customizable alerts, and a user-friendly interface, it helps you avoid range-bound conditions and focus on high-probability trades. Clarity leads to confidence. Trade confidently and protect your capital effectively with this powerful dashboard. We don't offer free or bonus indicators in exchange of reviews from you.
SIO Oscillator:自己最適化型セミバリアンス・インバランス・オシレーター インジケーターをご購入いただくと、それをベースにしたエキスパートアドバイザー(EA)を無料でお受け取りいただけます。 多くのオシレーターは、すべての価格変動を同じように扱います。SIOは上昇圧力と下降圧力を分けて捉え、その間のインバランス(不均衡)を測定することで、買い手と売り手のどちらが本当に相場を支配しているかを示します。インバランスが極値に達すると、SIOはエントリー、ストップロス(Stop Loss)、テイクプロフィット(Take Profit)の水準を伴う明確なシグナルを表示します。 SIOの大きな特長は、固定パラメーターに頼らないことです。内蔵の自己最適化機能が、現在の銘柄と時間足に適したパラメーターを継続的に探索し、使用する前に検証します。 2つのシグナルモード 平均回帰(Mean Reversion):インバランスの極値で取引し、均衡への回帰を狙います。 トレンドフォロー(Trend Following):持続的で優勢なインバランスの方向に取引します。 自動モード:最適化機能が直近のデ
多通貨対応の通貨強弱・モメンタム・インジケーター MT5 Dynamic Forex28 Navigator は、長年ご好評いただいているインジケーターの発展版で、3 つの機能を 1 つに統合したものです: Advanced Currency Strength28 Indicator (700 件のレビュー) Advanced Currency IMPULSE with ALERT (530 件のレビュー) CS28 Combo Signals(最近のボーナス) この 2 つの前身インジケーターは MQL5 Market で合計 1,200 件を超えるレビューを獲得しており、2016 年から MT4 コミュニティで定番となっています。Dynamic Forex28 Navigator MT5 は、実績ある同じロジックを引き継いでいます。 MetaTrader 5 向けに完全に再構築 – MT5 ネイティブのマルチシンボル・アーキテクチャを最大限に活かす設計です。 ユーザーマニュアル: https://www.mql5.com/en/blogs/post/758844 MT4 版をお探し
Neuro Poseidon is a new indicator by Daria Rezueva. It combines precise trading signals with adaptive TP/SL levels - creating best possible trades as a result! Message me and get  Neuro Poseidon Assistant  as a gift to automize your trading process! What makes it stand out? 1. Proven profitability on all assets and timeframes 2. Only confirmed BUY and SELL signals present on the chart 3. Adaptive TP & SL levels generated by the software for each trade 4. Easy to understand - suitable for al
AriFocus - Non-Repainting Buy/Sell Signals AriFocus - one clear signal. AriFocus marks buy and sell signals directly on the chart and suggests a stop-loss level for each one. Every signal is confirmed on bar close and never repaints. - Buy/sell arrows, confirmed on bar close - Suggested stop-loss level for every signal - Trend band and candle coloring to show direction at a glance - 10 ready-made presets, or your own settings (14 calculation methods) - Pop-up, push and email alerts with entr
通貨強さウィザードは、取引を成功させるためのオールインワン ソリューションを提供する非常に強力な指標です。このインジケーターは、複数の時間枠のすべての通貨のデータを使用して、このまたはその外国為替ペアのパワーを計算します。このデータは、使いやすい通貨インデックスと通貨パワーラインの形式で表され、特定の通貨のパワーを確認するために使用できます。 必要なのは、取引したいチャートにインジケーターを接続することだけです。インジケーターは、取引する通貨の実際の強さを示します。このインジケーターは、トレンドに合わせて取引するときに有利に利用できる売買高の圧力の極値も示します。このインジケーターには、フィボナッチに基づく可能なターゲットも表示されます。 このインジケーターは、PUSH 通知を含むあらゆるタイプのアラートを提供します。 購入後ご連絡下さい。私の取引のヒントをあなたと共有し、素晴らしいボーナスインジケーターを無料で提供します! 幸せで有益な取引をお祈りします。
Advance AI Scanner is a multi-symbol analysis indicator for MetaTrader 5. It scans Forex pairs, metals, energy, stock indices and cryptocurrencies at the same time and rates each instrument with its own self-training model. It explains in plain English what moved each market and why, and it estimates how far upcoming economic news usually moves each symbol, measured on your broker's own price history. $199 instead of $499. 10 copies left at this price. One time purchase  Installation and User
Azimuth Pro
Ottaviano De Cicco
5 (7)
Azimuth Pro V2:MT5向けシンセティック・フラクタル構造分析と確認済みエントリー 概要 Azimuth Pro は Merkava Labs によるマルチレベルスイング構造インジケーターです。4つのネストされたスイングレイヤー、スイングアンカーVWAP、ABCパターン検出、3タイムフレーム構造フィルタリング、そして確定バーでの確認済みエントリー — 1つのチャートで、ミクロスイングからマクロサイクルまでを網羅するワークフロー。 これはブラインドシグナル製品ではありません。ロケーション、コンテキスト、タイミングを重視するトレーダーのための構造ファーストワークフローです。 ハロウィンプロモーション — 35%オフ 相場が不気味に揺れても、あなたの優位性は鋭いまま。このオファーが霧の中に消える前に、35%オフで手に入れよう。 Azimuth Proが現在259 USD(通常399 USD)。 1. V2での変更点 シンセティック・マルチタイムフレームエンジン 上位タイムフレーム分析をMeridian Proと同じ独自のシンセティックアーキテクチャで一から再構築。より
SkyHammer Signal Pro Entry、SL、TP レベルを固定表示する、プロ仕様のノーリペイント・トレンドシグナルインジケーター SkyHammer Signal Pro は、明確で固定され、検証可能なシグナルを求めるトレーダー向けに設計された、構造的なトレンド・モメンタム系シグナルインジケーターです。 特に M1 と M5 などの短期時間足で最も効果を発揮します。 このインジケーターは、天井や底を予測するためのものではありません。シグナルを出す前に、確認された市場構造、トレンド方向、モメンタムの強さ、健全なボラティリティ、そしてターゲットまでの十分な値幅を確認します。 主な機能 固定シグナルメカニズム シグナルが確認されると、矢印、Entry、Stop Loss、TP1、TP2 の各レベルはチャート上に永久的に固定されます。 その後のローソク足の動きによって、シグナルが消えたり、移動したり、変更されたりすることはありません。 これにより、トレーダーは各シグナルを明確に確認でき、リアルタイム相場中にシグナルが消えるという一般的な問題を避けることができます。 完全な過去シ
作者のその他のプロダクト
Volume Spread Flow MT5 Volume alone does not tell the whole story. A high-volume candle can signal strong participation, absorption, exhaustion or simply increased activity. The real information comes from the relationship between Volume, Price Spread, Candle Structure and Market Context . Volume Spread Flow MT5 brings these elements together in one clear visual workspace, automatically analyzing every bar through a structured Volume Spread Analysis (VSA) framework. Instead of manually comparing
Market Activity Meter MT5 See market activity at a glance with a free Relative Volume and Relative Range indicator for MetaTrader 5. Market Activity Meter MT5 is a visual market activity dashboard that helps traders understand how current trading activity compares with recent historical conditions. Using a clear semicircular gauge, the indicator measures Relative Volume (RVOL) and Relative Range , allowing you to identify periods of low, normal, high, or extreme market activity directly on your
FREE
MGD Prop Risk Guard MT5 Professional Account Risk Monitoring for MetaTrader 5 — FREE MGD Prop Risk Guard MT5 is a free account risk monitoring utility designed to help traders stay informed about their daily loss limits, maximum drawdown, and available risk. Whether you trade manually, use Expert Advisors, or participate in proprietary trading firm challenges, MGD Prop Risk Guard provides a clear, real-time overview of your account's risk exposure. Monitor your trading risk directly from your MT
FREE
Gann Swing & Overbalance MT5 is a technical analysis indicator for MetaTrader 5 designed to build a confirmed swing structure and analyze Price and Time Overbalance according to Gann-inspired swing analysis principles. The indicator identifies confirmed swing highs and lows, classifies market structure as HH (Higher High), HL (Higher Low), LH (Lower High) and LL (Lower Low), and compares consecutive price and time movements to highlight potential Overbalance conditions. Main Features • Confirmed
Gann-inspired reversal pattern detector for MT5 featuring KRU/KRD, double key reversals and three-bar reversal structures. Gann Reversal Patterns MT5 is a technical analysis indicator designed to identify several price-action reversal structures commonly used in Gann-oriented market analysis. The indicator automatically detects bullish and bearish reversal formations on closed candles only , helping traders analyze potential turning points without relying on the currently forming bar. Detected
Volume Spread Flow Activity MT5 Volume tells you how much activity is taking place. Spread tells you how much price is actually moving. The relationship between the two can tell you much more. Volume Spread Flow Activity MT5 is a professional Relative Volume and Relative Spread indicator designed to reveal how current market activity compares with its recent normal behavior. Instead of displaying raw volume alone, the indicator normalizes both Volume and candle Spread around a common 1.0 baselin
フィルタ:
レビューなし
レビューに返信