Axiom RSI

Introducing Axiom RSI, a momentum and trend analysis indicator that combines advanced RSI calculations, moving-average trend detection, a color-coded histogram and rule-based BUY/SELL signals in one integrated indicator.

Axiom RSI combines RSI momentum with fast and slow moving-average channels to identify bullish, bearish and neutral market conditions. It offers multiple RSI calculation methods and customizable trend filters to adapt the analysis to different trading approaches.

When the selected conditions align, Axiom RSI identifies potential BUY and SELL opportunities through RSI pullback signals, trend-flip signals or both. It also provides automatic Entry, Stop Loss and Take Profit levels using ATR-based calculations.

Key Features:

  • Multiple RSI Methods: Choose from seven RSI calculation methods, with customizable periods, smoothing and price sources.
  • Dual Moving Average Trend System: Uses independent fast and slow moving-average channels to identify bullish and bearish market conditions.
  • Color-Coded Trend Histogram: Displays bullish, bearish and neutral trend states in the indicator window.
  • Third Moving Average Filter: Optional long-term trend filter for additional signal refinement.
  • BUY/SELL Signals: Choose RSI Pullback, Trend Flip or Both signal modes, with adjustable RSI filters and minimum signal spacing.
  • ATR-Based Trade Plan: Automatically calculates Entry, Stop Loss and Take Profit using a configurable ATR multiplier and Risk-to-Reward ratio.
  • Interactive Dashboard: Displays current trend, RSI momentum, latest signal and trade-plan information. The panel can be dragged, resized and minimized.
  • Chart Markers: Optional BUY/SELL arrows, labels, signal dots, trend arrows and vertical trend-change lines.
  • Customizable Alerts: Popup, sound, email and mobile push notifications for entry signals and trend changes.
  • Extensive Customization: Adjust RSI settings, moving averages, signal conditions, colors, markers, alerts and dashboard visibility.
  • Works on Any Symbol and Timeframe: Use Axiom RSI across Forex, metals, indices, stocks and cryptocurrencies.

Whether you focus on momentum analysis, trend direction or potential entry opportunities, Axiom RSI brings these tools together in one customizable indicator.

Specifications:

  • Platform: MetaTrader 5 (.ex5).
  • Seven RSI calculation methods.
  • Fast and slow moving-average trend channels with optional third MA filter.
  • Bullish, bearish and neutral trend histogram.
  • RSI Pullback, Trend Flip and combined BUY/SELL signals.
  • ATR-based Stop Loss and configurable Risk-to-Reward Take Profit.
  • Interactive dashboard and customizable chart markers.
  • Popup, sound, email and mobile push alerts.
  • Entry signals are evaluated on closed candles. Trend-flip alerts can optionally monitor the current, still-forming candle, where conditions may change before the candle closes.
  • Trading involves risk. Always test on a demo account first.

Contact

If you have any questions or need help, contact me via Private Message.


おすすめのプロダクト
RBreaker Gold Indicatorsは、金先物の短期日内取引戦略であり、トレンドフォローと日内反転の2つの取引手法を組み合わせたものです。トレンド相場での利益を捉えるだけでなく、相場が反転した際には迅速に利確し、その流れに沿ってポジションを反転させることができます。 この戦略は、アメリカの雑誌『Futures Truth』において、15年連続で最も収益性の高い取引戦略トップ10に選ばれた実績を持ち、非常に長いライフサイクルを誇り、現在も国内外で広く使用・研究されています。 本インディケーターは、2026年の金先物の値動きに対応し、14日間のATR指標に基づいて、ブレイクアウト係数A、観察係数B、リバーサル係数Rをより合理的な値で定義しています。非常に優れたインディケーターであり、安定的な年間収益を実現しています。ぜひおすすめします〜
What Is Trend Master Pro? Trend Master Pro   is a professional-grade trend trading indicator built for MetaTrader 5. It was designed with one goal in mind — to keep you on the right side of the market at all times by combining three powerful technical tools into a single, clean, easy-to-read display directly on your price chart. Instead of cluttering your screen with multiple separate indicators, Trend Master Pro fuses an   EMA Ribbon trend filter , a   ZigZag swing point engine , and a   breako
Caicai L&S Yield Histogram Important Notice: This indicator is an integral tool of the automated EA Caicai Long and Short Pair Trading . This indicator visually displays the percentage deviation (Yield %) of a pair's current spread relative to its own historical mean. It is an excellent tool for quickly visualizing the gross financial potential of a market distortion in Long & Short operations. Main Features: Percentage Visualization: Understand the size of the distortion in palpable percentage
The Non Repaint Buy/Sell Signals QCL MT5 Indicator is a powerful trading tool built on mathematical analysis. This software reduces chart noise avoids confusion when making trading decisions and provides clear market signals directly on MetaTrader 5 without repainting. Special launch discount price. Final price $149 Indicator User Manual User Manual Asset: XAUUSD Timeframe: 15 Minutes, We doing manual trading upon the signals sent by our Indicator Core Quantitative Architecture Adaptive Momentum
Structure King AI Signal Structure King AI Signal is a professional MetaTrader 5 trading indicator designed to help traders analyze market structure, trend direction, multi-timeframe confirmation and trade management from one clean dashboard. Key Features • Market Structure & Trend Analysis • BUY / SELL Signals • Multi-Timeframe (HTF) Confirmation • Entry Price Levels • Dynamic Stop Loss (SL) • TP1 / TP2 / TP3 Levels • ATR Volatility Analysis • ADX Trend Strength Filter • Adaptive Market Filter
Your Trend Friend
Luigi Nunes Labigalini
5 (1)
The trend is your friend! Look at the color of the indicator and trade on that direction. It does not  repaint. After each candle is closed, that's the color of the trend. You can focus on shorter faster trends or major trends, just test what's most suitable for the symbol and timeframe you trade. Simply change the "Length" parameter and the indicator will automatically adapt. You can also change the color, thickness and style of the lines. Download and give it a try! There are big movements w
ONNYX INDICATOR バージョン 1.14 MetaTrader 5 用のサプライ・デマンド分析インジケーターです。確定したスイングからゾーンを作成し、ATR で幅を調整し、品質をパーセント表示します。確定足の BUY/SELL シグナルは後から消えない設計です。 主な機能 - ゾーン内に品質パーセントを表示するサプライ・デマンドゾーン。 - 確定足で表示される大きな BUY/SELL 矢印。 - EMA トレンドフィルターとローソク足反発確認。 - トレンド、価格レベル、市場状況パネル。 - 関連する経済指標を最大5件表示。発表前は Forecast/Previous、発表後は Actual を表示。 - 60秒ごとのニュース更新とストラテジーテスター用カレンダーキャッシュ。 - ポップアップ、プッシュ、メール通知。 - iCustom 用バッファ:0=BUY価格、1=SELL価格。 使用方法 チャートに適用し、履歴の読み込みを待ってから、トレンドと有効ゾーンを確認し、確定足シグナルを独自のリスク管理と組み合わせてください。XAUUSD H1 は見やすい構造、M15 はより
Fabii Half Trend Baseline
Fabien Georges Andre Guillemaud
上位足のトレンドに逆らう取引をやめましょう。2本のベースライン、1つのチャート。リペイントなし。 どの通貨ペアでも、どの時間足でも。2分でチャートに表示。Strategy Tester で無料デモを試せます。 Get more indicators here Baselines, volatility filters and oscillators. No repaint. 必要な理由 チャート上のラインが緑になったので、あなたはエントリーします。その後、上位足を開くと、大きなトレンドは逆方向を向いています。シグナルは本物でした。しかし、その背景のトレンドはあなたの味方ではありませんでした。 大きなトレンドに逆らう取引は、そのたびにエントリーの優位性を失わせます。 得られるもの Fabii Half Trend Baseline は、現在の時間足のトレンドと上位足のトレンドを1つのチャートに表示します。ウィンドウを切り替えて全体像を確認する必要がなくなります。 上位足の2本目のベースラインがメインのラインの後ろに描かれるため、別のチャートを開かずに大きなトレンドが分かります。 ベ
PatternScope — Multi-Pattern Recognition for MT5 PatternScope is a multi-pattern recognition indicator for MetaTrader 5. It scans price action for classic chart patterns, confirms breakouts, and draws clear   Entry, Stop Loss and Take Profit   levels. A compact dashboard shows the latest pattern, bias and Risk:Reward. Patterns:   Double Top/Bottom, Triple Top/Bottom, Head and Shoulders (and inverted), Bullish & Bearish Flag, Pennant, Rising & Falling Wedge, Triangle, Rectangle, Cup and Handle —
Liquidity Order Blocks MT5 Liquidity Order Blocks MT5 is a professional visual indicator for MetaTrader 5 designed to help traders identify and monitor potential bullish and bearish liquidity areas directly on the chart. The indicator detects pivot-based order block zones and displays each zone with a structured visual breakdown of estimated bullish volume, bearish volume, relative strength and delta. Its purpose is to make liquidity areas easier to read, compare and monitor during market analys
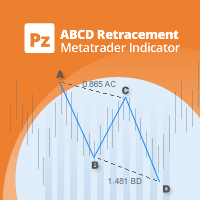
このインジケータは、AB = CDリトレースメントパターンを検出します。 AB = CDリトレースメントパターンは、初期価格セグメントが部分的にリトレースされ、プルバックの完了から等距離の動きが続く4ポイントの価格構造であり、すべての調和パターンの基本的な基盤です。 [ インストールガイド | 更新ガイド | トラブルシューティング | よくある質問 | すべての製品 ] カスタマイズ可能なパターンサイズ カスタマイズ可能なACおよびBD比率 カスタマイズ可能なブレイクアウト期間 カスタマイズ可能な線、色、サイズ CD fiboレベルに基づいてSLおよびTPレベルを表示します パターンとブレイクアウトの視覚/音声/プッシュ/メールアラート AB = CDリトレースメントは、かなり拡大して再描画できます。物事を簡単にするために、このインディケーターはひねりを実装します。トレードをシグナルする前に、正しい方向へのドンチャンブレイクアウトを待ちます。最終結果は、非常に信頼性の高い取引シグナルを備えた再描画インジケーターです。ドンチャンのブレイクアウト期間が入力として入力されます。 強
Introducing the Bollinger Flipper Indicator – Your Ultimate Trading Edge!   Are you tired of second-guessing your entries and exits? The Bollinger Flipper Indicator is here to flip the game in your favor.   Built with the power of Bollinger Bands + Level 3 Power System + ZigZag Fractals, this advanced tool is designed to spot high-probability buy & sell signals with precision. SPECIAL BONUS (VALID TILL JUNE 2026)- OUR DAILY SCALPER EA for BTCUSD and VIX75 •································
Indicator Name: Fibaction – price action candle Detector Description: Fibo Signal Boxes is a powerful Smart Money Concept (SMC)-inspired indicator that auto-detects price action candles. bullish hammers and shooting stars, then draws precise Fibonacci entry zones and multiple take-profit levels directly on the chart. as for the SL personally i use 40 pips rules  Key Features: Detects bullish hammer and shooting star reversal candles. Automatically draws Fibonacci entry and TP boxes. as
TrendPulse Signal Proは、トレンド反転を検出し、チャート上にLONGおよびSHORTエントリーを直接マークし、各シグナルに対してストップロス・エントリー・3つのテイクプロフィットレベルを自動描画する完全なシグナルエンジンです。内蔵のパフォーマンスダッシュボードは、シミュレートされた勝率、現在のトレード距離、3レイヤーリスク管理シミュレーションの結果を表示します。レイヤー1はTP1でクローズして利益を確定し、レイヤー2はTP2またはTP1ロックでクローズ、レイヤー3はTP3からトレーリングストップを実行します。すべてのシグナルは確認済みのトレンド変化に基づいており、あらゆる市場で明確でリペイントのないワークフローを提供します。 主な特徴: 確認済みトレンド反転でのLONG・SHORTラベル 自動SL・エントリー・TP1・TP2・TP3ライン 3レイヤーシミュレーション: TP1ロック、TP2クローズ、トレーリングTP3 勝率とレイヤーステータスを表示するダッシュボード ATRベースのリスク距離とトレーリング乗数 振幅、チャネル偏差、色を設定可能 設定: 振幅、チャネル
The Rainbow Dragon Indicator by Quant Atlas Creator:  https://www.quant-atlas.com/ The Rainbow Dragon is a composite signal engine that aggregates the seven Rainbow indicators — Blue, Green, Indigo, Red, Violet, Yellow, and Orange — into a single confluence-based reading. Rather than relying on any one model, it treats each Rainbow component as an independent voter and fires only when enough of them agree, giving you a diversified, multi-method read on the market instead of a single point of vie
MarketMagnet
Kelly Adediran Raymond
Are you ready to take your trading journey to new heights? Look no further than MarketMagnet, this groundbreaking indicator designed to propel your trading success with excitement and accuracy. Powered by the convergence of Momentum and CCI (Commodity Channel Index), MarketMagnet equips traders with the ultimate tool to determine direction and entry prices for a wide range of recommended currency pairs and instruments. It is designed for traders seeking to scalp for a few pips on lower timeframe
This trading indicator is non-repainting, non-redrawing, and non-lagging, making it an ideal choice for both manual and automated trading. It is a Price Action–based system that leverages price strength and momentum to give traders a real edge in the market. With advanced filtering techniques to eliminate noise and false signals, it enhances trading accuracy and potential. By combining multiple layers of sophisticated algorithms, the indicator scans the chart in real-time and translates comple
RevTech
Bashier Awny Husein Ismail Alhafy
Revtech MT5 Indicator brings together institutional concepts, market-structure logic, and classic price action patterns in one advanced trading tool. From Fair Value Gaps and Order Blocks to Head & Shoulders and Triangle formations, Revtech helps traders identify quality setups with clear chart visuals and execution levels. With dashboard monitoring, alerts, and timeframe-based strategy alignment, Revtech is designed to turn raw price action into a structured trading opportunity. The indicator
C88 Projected Candle See the Bigger Picture Before the Candle Closes C88 Projected Candle is a professional market visualization indicator that projects the current higher timeframe candle directly onto your active chart. It helps traders understand the evolving market structure without constantly switching between timeframes. Whether you trade Price Action, ICT, Smart Money Concepts (SMC), or Volume Profile, this indicator provides a cleaner and more intuitive way to read market context. Key Fe
WBS SMC Without Repaint – Ultimate XAUUSD Scalping Engine (M5 Timeframe) Take your Gold trading to the institutional level with "WBS SMC Without Repaint", a highly advanced premium indicator engineered specifically for XAUUSD (Gold) on the M5 (5-Minute) timeframe.  Built upon the core pillars of Smart Money Concepts (SMC) combined with precise algorithmic candle pattern recognition, this tool identifies high-probability institutional footprints in real-time. Best of all: 100% ABSOLUTELY
This indicator uses the metaquotes ZigZag indicator as base to plot fibonacci extension and fibonacci retracement based in the Elliot waves. A fibonacci retracement will be plotted on every wave draw by the ZigZag. A fibonacci extension will be plotted only after the 2nd wave. Both fibonacci will be updated over the same wave tendency. Supporting until 9 consecutive elliot waves. Parameters: Depth: How much the algorithm will iterate to find the lowest and highest candles Deviation: Amount of
Noize Absorption Index - is the manual trading system that measures the difference of pressure between bears forces and bulls forces. Green line - is a noize free index that showing curent situation. Zero value of index shows totally choppy/flat market.Values above zero level shows how powerfull bullish wave is and values below zero measures bearish forces.Up arrow appears on bearish market when it's ready to reverse, dn arrow appears on weak bullish market, as a result of reverse expectation.
Introduction to the Manual Backtesting Indicator on MQL5 The MetaTrader platform provides an excellent backtesting tool for evaluating Expert Advisors (EAs). However, when it comes to manually backtesting a strategy to assess its effectiveness, this tool has some limitations: You cannot manually draw zones or trend lines while in backtesting mode. You cannot switch timeframes to check time alignment. For example, if my strategy requires additional confirmation from a higher timeframe (HTF), this
Smart Support And Resistance Indicator See the Market Levels That Matter. Make your chart clearer and your technical analysis more organized with Smart Support And Resistance Indicator — a powerful trading tool designed to help traders identify important support and resistance levels directly on their MetaTrader 5 charts. Whether you trade Forex, Gold, Indices, or other available markets, this indicator helps you focus on key price areas, monitor potential market reactions, and analyze price act
SMC Indicator BOS & CHoCH analyze market structure using Smart Money Concepts The indicator combines BOS (Break of Structure), CHoCH (Change of Character), Fair Value Gaps (FVG), Liquidity Sweep logic and ATR filtering to provide a structured view of market movements and potential trading opportunities. The indicator automatically identifies swing highs and swing lows and monitors structural breaks in the market. BOS (Break of Structure) identifies potential continuation of the current market st
STRICTLY FOR BOOM INDEX ONLY!!!!! Here I bring the Maximum Trend Arrows OT1.0 MT5 indicator. This indicator is made up of a combination of different trend indicators for entries and exits, for entries an orange arrow will paint on the chart below the current market and a red flag for closing of trades and it produces buy arrows only. When the orange arrow appears, it will appear along with it's sound to notify you. The 1H timeframe is recommended, don't use it anywhere else than on the 1H timefr
TL Method — Automatic Trendline Detection & Strength Indicator Tired of drawing trendlines manually? TL Method does it for you — automatically detecting, drawing, and scoring trendlines in real time. What it does: Scans up to 1000 bars to find valid support and resistance trendlines Scores each trendline by counting confirmed anchor touches Generates buy/sell signal arrows when price approaches strong trendlines Alerts you via popup, push notification, or sound — with smart cooldown to avoid spa
CosmiCLab SMC FIBO CosmiCLab SMC FIBO is a professional trading indicator designed for traders who use Smart Money Concepts (SMC), market structure analysis and Fibonacci retracement levels. The indicator automatically detects market swings and builds Fibonacci levels based on the latest impulse movement. It also identifies market structure changes such as BOS (Break of Structure) and CHOCH (Change of Character), helping traders understand the current market direction. CosmiCLab SMC FIBO also pr
The indicator determines the state of the market: trend or flat. The state of the market is determined by taking into account volatility. The flat (trading corridor)is displayed in yellow. The green color shows the upward trend. The red color shows the downward trend. The height of the label corresponds to the volatility in the market. The indicator does not redraw . Settings History_Size   - the amount of history for calculation. Period_Candles  - the number of candles to calculate the indicat
Multi-timeframe Fibonacci and harmonic analysis for MetaTrader 5 MultiFibo Fts Zzb MultiFrame Harmonics is an interactive chart-analysis indicator for MetaTrader 5. It combines independent multi-timeframe ZigZag structure, Fibonacci levels, polarity levels, FTS PHI + phi zones, confluence areas and harmonic-pattern analysis in one floating on-chart panel. The indicator is designed for discretionary technical analysis. It does not open, modify or close trades. Why use it? View market structure fr
FREE
このプロダクトを購入した人は以下も購入しています
Trend Sniper X
Sarvarbek Abduvoxobov
4.86 (43)
Trend Sniper X は、トレードの方向性と潜在的な反転ポイントを明確かつ正確に特定するのに役立つ、MetaTrader 5 用のマルチタイムフレーム・トレンドフォロー指標です。 MT4用: https://www.mql5.com/en/market/product/193245 価格情報: 現在の価格はプロモーション価格であり、今後のアップデートや新機能のリリースに伴い変更される場合があります。 ボーナス特典: このインジケーター用の無料自動売買アシスタントEAを入手するには、購入後に an 著者(開発者)へメッセージをお送りください。 Code2Profit チャンネル マルチタイムフレーム分析で相場をマスターしよう! Trend Sniper X で勝率を最大化する方法:重要なルールとセッションのコツ 技術仕様 プラットフォーム MetaTrader 5 インジケータータイプ マルチタイムフレーム・トレンドインジケーター 操作タイムフレーム あらゆるチャートタイムフレームに対応。個別に選択可能な上位タイムフレーム (M1–MN1) を搭載 主要銘柄 FX、ゴールド (X
Entry Points Proは、注文を出す前に、どこでエントリーし、どこにストップを置き、どのロットで取引するかを示します。 矢印はローソク足の確定時に表示され、リペイントしません。設定は2つ:あなたの資金と1回のトレードあたりのリスクです。 お支払い前にご確認ください:無料デモはMT5のストラテジーテスターで動作し、2分で済みます。ご購入後は、私が個人的に設定をお手伝いします。 2019年、私はこのインジケーターの実力を世界中に示しました。そのシグナルに従って手動で、リアル口座で、公開の場でトレードしたのです。口座はMyfxbookでモニタリングされ、私はこの実験の経過をFacebookで詳しく発信していました。結果:4か月で10,000ドルが941,411ドルになりました。リスクは意図的に極端に取っていました — ドローダウンは最大54%に達しました。私たちの仕事では、利益とリスクは常に表裏一体だからです。Myfxbookのスクリーンショットは、ギャラリーの最初の画像です。 どうやら、おめでとうと申し上げてよさそうです。あなたの探求はここで終わりです。Entry Points
ULTRAは、「オールインワン」方式で機能するテクニカル指標です。市場を独自に分析し、売買シグナルを生成し、ストップロス注文を設定するための水準を表示し、利益を確定したり損失を最小限に抑えたりするためにポジションを決済すべきタイミングを提案します。 つまり、市場の分析方法や、水準(ストップロスをどこに設定すべきか)の見極め方がわからなくても、あるいは資金管理に苦労していても問題ありません。ULTRAがすべて代行してくれます! 購入者限定特典 :「ULTRA」インジケーターをご購入後、私にプライベートメッセージをお送りいただければ、「ULTRA BOT」を無料プレゼントとしてお受け取りいただけます。これは、このインジケーターからのシグナルに基づいて、オープンしたトレードを管理するのに役立つ特別なツールです(各トレードにストップロスを設定し、最適な結果が得られるよう、戦略のルールに従って自動的にトレードを決済します)。  また、インジケーターを最大限に活用できるよう、さまざまな資産向けの既成の設定も購入者の皆様に提供しています。これらの「超お得な特典」を無料で入手するには、私へダイレクトメ
Gann Made Easy   は、ミスター・ギャンの理論を使用した取引の最良の原則に基づいた、プロフェッショナルで使いやすい外国為替取引システムです。 W・D・ガン。このインジケーターは、ストップロスとテイクプロフィットレベルを含む正確な買いと売りのシグナルを提供します。 PUSH通知を利用して外出先でも取引可能です。 ご購入後、取引方法の説明と優れた追加インジケーターを無料で入手するには、私にご連絡ください! おそらく、ギャンの取引手法についてはすでに何度も聞いたことがあるでしょう。通常、ギャンの理論は初心者のトレーダーだけでなく、すでにある程度の取引経験がある人にとっても非常に複雑なものです。なぜなら、ギャンの取引手法は理論的にはそれほど簡単に適用できるものではないからです。私はその知識を磨き、最良の原則を私の外国為替インジケーターに組み込むために数年を費やしました。 このインジケーターは非常に簡単に適用できます。必要なのは、それをチャートに添付し、簡単な取引推奨事項に従うだけです。このインジケーターは常に市場分析の仕事を行い、取引の機会を探します。適切なエントリーポイントを検
M1 SNIPER は使いやすいトレーディングインジケーターシステムです。M1時間足向けに設計された矢印インジケーターです。M1時間足でのスキャルピングのためのスタンドアロンシステムとして、また既存のトレーディングシステムの一部としても使用できます。このトレーディングシステムはM1時間足での取引に特化して設計されていますが、他の時間足でも使用できます。元々、この手法はXAUUSDとBTCUSDの取引用に設計しましたが、他の市場においても役立つと考えています。 インジケーターのシグナルは、トレンドの方向と逆方向に取引できます。インジケーターのシグナルを利用して両方向に取引するのに役立つ特別な取引テクニックをご紹介します。この手法は、特別な動的なサポートとレジスタンスの価格帯を利用することに基づいています。 ご購入後、M1 SNIPER矢印インジケーターをすぐにダウンロードできます。さらに、M1 SNIPERツールのすべてのユーザーに、以下のスクリーンショットに表示されているApollo Dynamic SRインジケーターを無料で提供しています。この2つのインジケーターを組み合わせることで
Adaptive Price Action Engine インジケーターを購入すると、EAが無料に マルチタイムフレーム対応・自己最適化トレンド&ローソク足パターン分析 市場環境は常に変化しており、すべてのPrice Actionパターンが、あらゆる市場環境で同じ価値を持つわけではありません。 Adaptive Price Action Engine は、変化する市場環境への適応を目的として、 トレンド構造、マルチタイムフレーム分析、ローソク足パターン、統計的最適化 を1つの分析フレームワークに統合しています。 2つのアダプティブモード Dual Alpha Trend Mode 低い時間足と高い時間足のAlpha Trendパラメータを自動的に探索し、直近の市場動向に合わせてトレンド判定を適応させます。 Candlestick + Alpha Mode Alpha Trendによる市場レジーム判定と、 22種類の強気・弱気ローソク足パターン を組み合わせます。すべてのパターンを同じように扱うのではなく、さまざまなパターンの組み合わせを統計的に評価し、選択された市場環境において過去
Auto Optimized SpeedAngle は、継続的なウォークフォワード最適化(WFO:Walk-Forward Optimization)によりカーブフィッティング(過剰最適化)を排除した、機関投資家レベルのモメンタムベクトルシステムです。市場レジームの変化時に効果が低下する静的な入力に依存せず、アウトオブサンプル(OOS)検証を用いてパラメーターを動的に再キャリブレーションすることで、表示されるシグナルが単なる過去の偶然ではなく、確実な統計的優位性に基づいていることを保証します。 主な機関投資家向けフレームワーク ウォークフォワード最適化エンジン: ルックバック期間やしきい値の数千に及ぶ組み合わせを継続的にスキャンし、データをインサンプルとアウトオブサンプルに厳格に分離します。未検証のデータ環境において数学的優位性が証明された場合にのみ、新しいパラメーター設定を採用します。 定量的目的関数: 単なる純利益の追求ではなく、機関投資家レベルの安定性指標をターゲットとします。システム品質ナンバー(SQN)、期待値(1トレードあたりの平均Rマルチプル)、またはネットRの最適化を選
Boba Analysis Suite
Trade Ready Solutions LLC
5 (2)
Boba Analysis Suite Boba Analysis Suite は、MetaTrader 5 向けの分析インジケーターです。市場構造、重要な価格帯、相場全体の状況を、一つのチャート画面にまとめて表示します。 トレーダーおよびトレーディング指導者としての実務経験をもとに開発され、市場の方向性の評価、重要な価格水準の特定、複数の時間足を組み合わせた分析など、体系的な分析プロセスを支援します。 相場の背景を踏まえた分析 個々のシグナルの意味は、相場の状況によって変わります。Boba Analysis Suite は、現在のチャート状況をより大きな市場構造と関連付け、あらかじめ定めたルールに沿って取引アイデアを検討するための分析を支援します。 主な分析機能: トレンドと市場構造: 市場の方向性と、その背景にある構造を評価します。 重要な価格帯と価格水準: さらに分析すべき重要な領域を視覚的に表示します。 複数の時間足: 異なる時間足の情報を組み合わせ、相場全体の状況を評価します。 視覚的な分析プロセス: 分析情報をチャート上で直接確認できます。 自主的な取引判断を支援 Boba
ScalpPoint is a powerful trading companion designed to generate high-probability entry signals with dynamic TP/SL/DP levels based on volatility. Built-in performance tracking shows win/loss stats, PP1/PP2 hits, and success rates — all updated live. Key Features: Buy/Sell signals with adaptive volatility bands Real-time TP/SL/DP levels based on ATR Built-in MA Filter with optional ATR/StdDev volatility Performance stats panel (Success, Profit/Loss, PP1/PP2) Alerts via popup, sound, push, or emai
ARICoin is a powerful trading companion designed to generate high-probability entry signals with dynamic TP/SL/DP levels based on volatility. Built-in performance tracking shows win/loss stats, PP1/PP2 hits, and success rates all updated live. Key Features: Buy/Sell signals with adaptive volatility bands Real-time TP/SL/DP levels based on ATR Built-in MA Filter with optional ATR/StdDev volatility Performance stats panel (Success, Profit/Loss, PP1/PP2) Alerts via popup, sound, push, or email Cust
「Scalper Vault」は、デイトレードで安定した成果を目指すトレーダーのために設計された、強力かつ充実した機能を備えたトレーディングシステムです。 この高精度なインジケーターは、それ単体で完結するトレーディングシステムとして機能し、FXやバイナリーオプションのトレーダーに、機関投資家レベルの分析を提供します。 ご購入後、ぜひご連絡ください。 トレードのヒントに加え、豪華なボーナスをプレゼントいたします! 「Scalper Vault」を活用すれば、勘に頼った判断や複雑な手動分析は不要です。使いやすいトレード手法に集中し、純粋に「エントリー・決済」という実行フェーズに専念できます。 高精度なトレンドフォロー・シグナル:中核となるアルゴリズムが市場構造を分析し、主要なトレンド方向に沿った高確率なシグナルを提示します。これにより、誤ったエントリーを大幅に削減できます。 精度の高い天井・底の検知:市場の勢いが尽きたポイントをスキャンし、反転の可能性が高いゾーンを特定します。 ギャン(Gann)理論に基づく売買ゾーン:数学的な「ギャン・レベル」を自動的にチャート上に描画します。機関投資
Azimuth Pro
Ottaviano De Cicco
5 (7)
Azimuth Pro V2:MT5向けシンセティック・フラクタル構造分析と確認済みエントリー 概要 Azimuth Pro は Merkava Labs によるマルチレベルスイング構造インジケーターです。4つのネストされたスイングレイヤー、スイングアンカーVWAP、ABCパターン検出、3タイムフレーム構造フィルタリング、そして確定バーでの確認済みエントリー — 1つのチャートで、ミクロスイングからマクロサイクルまでを網羅するワークフロー。 これはブラインドシグナル製品ではありません。ロケーション、コンテキスト、タイミングを重視するトレーダーのための構造ファーストワークフローです。 ハロウィンプロモーション — 35%オフ 相場が不気味に揺れても、あなたの優位性は鋭いまま。このオファーが霧の中に消える前に、35%オフで手に入れよう。 Azimuth Proが現在259 USD(通常399 USD)。 1. V2での変更点 シンセティック・マルチタイムフレームエンジン 上位タイムフレーム分析をMeridian Proと同じ独自のシンセティックアーキテクチャで一から再構築。より
Volatility Master for MetaTrader is a real-time dashboard tool that scans up to  50 symbols  to identify high-volatility , trending markets instantly. With bullish/bearish signals, customizable alerts, and a user-friendly interface, it helps you avoid range-bound conditions and focus on high-probability trades. Clarity leads to confidence. Trade confidently and protect your capital effectively with this powerful dashboard. We don't offer free or bonus indicators in exchange of reviews from you.
Apex Patterns PRO インジケーターをご購入いただくと、それに基づいたExpert Advisorを無料でご提供します。 自己最適化するチャートパターンおよびブレイクアウト分析システム 従来のパターンスキャナーは固定のパラメータに依存しているため、市場のボラティリティや構造が変化するとパフォーマンスが低下することがよくあります。 Apex Patterns PROは、構造的なチャートパターン認識、モメンタムフィルタリング、および統計的な自己最適化を単一の分析フレームワークに統合することで、変化する市場環境に適応するように設計されています。 適応型スキャンエンジン 自己最適化パターンモード 最近の履歴データから適切なパターンパラメータを自動的に検索し、静的な設定を使用するのではなく、現在の市場の動きに合わせてインジケーターの構造検出を適応させます。 スマートブレイクアウトフィルタリング 古典的なパターン認識と、モメンタム、ボリューム、プライスアクションの指標を組み合わせます。すべてのブレイクアウトを同じように扱うのではなく、システムが根底にある市場構造を評価し、現在の統計
Neuro Poseidon is a new indicator by Daria Rezueva. It combines precise trading signals with adaptive TP/SL levels - creating best possible trades as a result! Message me and get  Neuro Poseidon Assistant  as a gift to automize your trading process! What makes it stand out? 1. Proven profitability on all assets and timeframes 2. Only confirmed BUY and SELL signals present on the chart 3. Adaptive TP & SL levels generated by the software for each trade 4. Easy to understand - suitable for al
SIO Oscillator:自己最適化型セミバリアンス・インバランス・オシレーター インジケーターをご購入いただくと、それをベースにしたエキスパートアドバイザー(EA)を無料でお受け取りいただけます。 多くのオシレーターは、すべての価格変動を同じように扱います。SIOは上昇圧力と下降圧力を分けて捉え、その間のインバランス(不均衡)を測定することで、買い手と売り手のどちらが本当に相場を支配しているかを示します。インバランスが極値に達すると、SIOはエントリー、ストップロス(Stop Loss)、テイクプロフィット(Take Profit)の水準を伴う明確なシグナルを表示します。 SIOの大きな特長は、固定パラメーターに頼らないことです。内蔵の自己最適化機能が、現在の銘柄と時間足に適したパラメーターを継続的に探索し、使用する前に検証します。 2つのシグナルモード 平均回帰(Mean Reversion):インバランスの極値で取引し、均衡への回帰を狙います。 トレンドフォロー(Trend Following):持続的で優勢なインバランスの方向に取引します。 自動モード:最適化機能が直近のデ
通貨強さウィザードは、取引を成功させるためのオールインワン ソリューションを提供する非常に強力な指標です。このインジケーターは、複数の時間枠のすべての通貨のデータを使用して、このまたはその外国為替ペアのパワーを計算します。このデータは、使いやすい通貨インデックスと通貨パワーラインの形式で表され、特定の通貨のパワーを確認するために使用できます。 必要なのは、取引したいチャートにインジケーターを接続することだけです。インジケーターは、取引する通貨の実際の強さを示します。このインジケーターは、トレンドに合わせて取引するときに有利に利用できる売買高の圧力の極値も示します。このインジケーターには、フィボナッチに基づく可能なターゲットも表示されます。 このインジケーターは、PUSH 通知を含むあらゆるタイプのアラートを提供します。 購入後ご連絡下さい。私の取引のヒントをあなたと共有し、素晴らしいボーナスインジケーターを無料で提供します! 幸せで有益な取引をお祈りします。
AriFocus - Non-Repainting Buy/Sell Signals AriFocus - one clear signal. AriFocus marks buy and sell signals directly on the chart and suggests a stop-loss level for each one. Every signal is confirmed on bar close and never repaints. - Buy/sell arrows, confirmed on bar close - Suggested stop-loss level for every signal - Trend band and candle coloring to show direction at a glance - 10 ready-made presets, or your own settings (14 calculation methods) - Pop-up, push and email alerts with entr
Advance AI Scanner is a multi-symbol analysis indicator for MetaTrader 5. It scans Forex pairs, metals, energy, stock indices and cryptocurrencies at the same time and rates each instrument with its own self-training model. It explains in plain English what moved each market and why, and it estimates how far upcoming economic news usually moves each symbol, measured on your broker's own price history. $199 instead of $499. 10 copies left at this price. One time purchase  Installation and User
SkyHammer Signal Pro Entry、SL、TP レベルを固定表示する、プロ仕様のノーリペイント・トレンドシグナルインジケーター SkyHammer Signal Pro は、明確で固定され、検証可能なシグナルを求めるトレーダー向けに設計された、構造的なトレンド・モメンタム系シグナルインジケーターです。 特に M1 と M5 などの短期時間足で最も効果を発揮します。 このインジケーターは、天井や底を予測するためのものではありません。シグナルを出す前に、確認された市場構造、トレンド方向、モメンタムの強さ、健全なボラティリティ、そしてターゲットまでの十分な値幅を確認します。 主な機能 固定シグナルメカニズム シグナルが確認されると、矢印、Entry、Stop Loss、TP1、TP2 の各レベルはチャート上に永久的に固定されます。 その後のローソク足の動きによって、シグナルが消えたり、移動したり、変更されたりすることはありません。 これにより、トレーダーは各シグナルを明確に確認でき、リアルタイム相場中にシグナルが消えるという一般的な問題を避けることができます。 完全な過去シ
発見が困難で頻度が少ないため、分岐は最も信頼できる取引シナリオの1つです。このインジケーターは、お気に入りのオシレーターを使用して、通常の隠れた分岐点を自動的に見つけてスキャンします。 [ インストールガイド | 更新ガイド | トラブルシューティング | よくある質問 | すべての製品 ] 取引が簡単 通常の隠れた発散を見つけます 多くのよく知られている発振器をサポート ブレイクアウトに基づいて取引シグナルを実装します 適切なストップロスおよび利益レベルを表示します 設定可能なオシレーターパラメーター カスタマイズ可能な色とサイズ バー単位でサイズ別に分岐をフィルタリング パフォーマンス統計を実装します 電子メール/音声/視覚アラートを実装します 幅広い市場の見通しを提供するために、異なるオシレーターを使用して、干渉なしで同じチャートにインジケーターを何度もロードできます。このインジケーターは、次のオシレーターをサポートしています。 RSI CCI MACD オスマ 確率的 勢い 素晴らしい発振器 加速器発振器 ウィリアムズパーセントレンジ 相対活力指数 特に外国為替市場では、
Apollo SR Master は、サポート/レジスタンスゾーンを利用した取引をより容易かつ確実にする特別な機能を備えたサポート/レジスタンスインジケーターです。このインジケーターは、ローカル価格の高値と安値を検出することで、タイムラグなしでリアルタイムにサポート/レジスタンスゾーンを計算します。そして、新たに形成されたSRゾーンを確認するために、インジケーターは特別なシグナルを表示します。このシグナルは、SRゾーンを実際の売りまたは買いシグナルとして考慮して使用できることを示します。この場合、SRゾーンの強度が高まり、SRエリアからの取引が成功する確率も高まります。これがこのインジケーターの基本的な考え方です。 SRゾーンは、ストップロスとテイクプロフィットの設定を容易にします。シグナルの方向に応じて、SRゾーンの上または下のスペースをストップロスとして設定できます。さらに、反対側のSRゾーンは、潜在的なテイクプロフィットエリアとして設定できます。 また、Apollo SRマスターインジケーターをご利用のすべてのユーザーには、「Apollo Price Action System」
このインジケーターを購入された方には、以下の特典を 無料 で提供しています: 各トレードを自動で管理し、ストップロスとテイクプロフィットを設定し、戦略ルールに基づいてポジションを決済する補助ツール 「Bomber Utility」 様々な銘柄に合わせたインジケーターの設定ファイル(セットファイル) 「最小リスク」、「バランスリスク」、「待機戦略」 の3つのモードで使用できる Bomber Utility 用の設定ファイル このトレーディング戦略をすぐに導入・設定・開始できる ステップバイステップのビデオマニュアル ご注意: 上記の特典を受け取るには、MQL5のプライベートメッセージシステムを通じて販売者にご連絡ください。 オリジナルのカスタムインジケーター 「Divergence Bomber(ダイバージェンス・ボンバー)」 をご紹介します。これは、MACDのダイバージェンス(乖離)戦略に基づいた 「オールインワン」型のトレーディングシステム です。 このテクニカルインジケーターの主な目的は、価格とMACDインジケーターの間に発生するダイバージェンスを検出 し、将来の価格の動きを示
多通貨対応の通貨強弱・モメンタム・インジケーター MT5 Dynamic Forex28 Navigator は、長年ご好評いただいているインジケーターの発展版で、3 つの機能を 1 つに統合したものです: Advanced Currency Strength28 Indicator (700 件のレビュー) Advanced Currency IMPULSE with ALERT (530 件のレビュー) CS28 Combo Signals(最近のボーナス) この 2 つの前身インジケーターは MQL5 Market で合計 1,200 件を超えるレビューを獲得しており、2016 年から MT4 コミュニティで定番となっています。Dynamic Forex28 Navigator MT5 は、実績ある同じロジックを引き継いでいます。 MetaTrader 5 向けに完全に再構築 – MT5 ネイティブのマルチシンボル・アーキテクチャを最大限に活かす設計です。 ユーザーマニュアル: https://www.mql5.com/en/blogs/post/758844 MT4 版をお探し
SUPERHEROインジケーターは、「オールインワン」方式に基づいて設計された多通貨対応の取引システムです。このインジケーターは市場を独自に分析し、取引の開始および終了のタイミングに関するシグナルを提供します。ストップロス注文とテイクプロフィット注文を使用します。R:R比率は1:1です。 このシステムはスマートフォンにプッシュ通知を送信できるため、PCに縛られることなく「外出先」からでも取引を行うことができます。自己勘定取引を行う企業に最適です。 すべてのお客様への特典: このインジケーターをご購入いただいたすべてのお客様に、私から特別なユーティリティをプレゼントいたします。その内容は以下の通りです: 自動的にストップロス注文とテイクプロフィット注文を発注します 価格が目標水準に達すると、自動的に取引を決済します 指値注文による取引に対応しています 平均化取引モードに対応しています この優れた、しかも非常に便利なユーティリティをプレゼントとして受け取りたい場合は、SUPERHEROインジケーターをご購入後、直ちにMQL5プラットフォームのプライベートメッセージを通じて私までご連絡くださ
トレンドラインプロ   市場の真の方向転換点を理解するのに役立ちます。この指標は、真のトレンド反転と主要プレーヤーが再び参入するポイントを示します。 分かりますか     BOSライン   複雑な設定や不要なノイズなしに、より長い時間足でのトレンドの変化と重要なレベルを把握できます。シグナルは再描画されず、バーが閉じた後もチャート上に残ります。 VERSION MT 4     -     RFI LEVELS PRO インジケーター と組み合わせることで、その潜在能力を最大限に発揮します。 インジケーターが示す内容: 本当の変化   トレンド(BOSライン) 一度シグナルが現れたら、それは有効です!これは、リペイント機能を持つインジケーターとの重要な違いです。リペイント機能を持つインジケーターは、シグナルを発した後、それを変更し、資金の損失につながる可能性があります。これにより、より高い確率と精度で市場に参入できます。また、矢印が現れた後、目標値(利益確定)に達するか、反転シグナルが現れるまで、ローソク足の色を変更する機能もあります。 繰り返しエントリ       主要プレーヤーの
FootPrint Chart MT5
Gayathiri Gopalakrishnan
5 (1)
Turn every candle into a bid x ask footprint built from real tick data. See who is actually trading at each price, with delta, volume profile, imbalance zones and a scored setup engine that prints entry, stop and target Order Flow Footprint Chart Pro Most indicators tell you what price did. This one tells you who did it. Order Flow Footprint Chart Pro rebuilds every candle on your chart from raw tick data and shows you the volume that traded at each individual price inside it, split into the am
The Oracle Pro
Ottaviano De Cicco
5 (1)
The Oracle Pro:MT5向け合成マルチタイムフレーム・バイアスエンジン ハロウィンプロモーション — 35%オフ 相場が不気味に揺れても、あなたの優位性は鋭いまま。このオファーが霧の中に消える前に、35%オフで手に入れよう。 The Oracle Proが現在194 USD(通常299 USD)。 The Oracle Pro は、要求の高いプロのトレーダーのために作られた MetaTrader 5 向けのプレミアム・マルチタイムフレーム バイアスエンジン です。ひとつの問いに規律をもって答えます。すなわち、各タイムフレームの現在の方向バイアスは何か、その強さはどれほどか、そしてタイムフレーム同士はどれだけ一致しているか。すべては確定足のみで計算され、リペイントはありません。 The Oracle Pro はマルチファクター・コンセンサス・システムです。独自のインジケーターと最適化されたアルゴリズムを単一の高度なコンセンサス・ベクトルに統合し、それを単一のインジケーター・インスタンス内で現在足と上位足のスタックにわたって読み取ります。複数のチャートにばらばらのツール
Quantum TrendPulse を ご紹介します。これは、   SuperTrend   、   RSI   、および Stochastic のパワーを 1 つの包括的なインジケーターに組み合わせて、取引の可能性を最大限に引き出す究極の取引ツールです。精度と効率を求めるトレーダー向けに設計されたこのインジケーターは、市場のトレンド、勢いの変化、最適なエントリー ポイントとエグジット ポイントを自信を持って特定するのに役立ちます。 主な特徴: SuperTrend 統合: 現在の市場動向に簡単に追従し、収益性の波に乗ることができます。 RSI精度: 買われすぎと売られすぎのレベルを検出し、市場の反転のタイミングに最適で、SuperTrendのフィルターとして使用されます。 確率的精度: 確率的振動を活用して、変動の激しい市場で隠れたチャンスを見つけます。SuperTrend のフィルターとして使用されます。 マルチタイムフレーム分析:   M5 から H1 または H4 まで、さまざまなタイムフレームで市場を常に把握します。 カスタマイズ可能なアラート: カスタム取引条件が満たされ
現在33%オフ 初心者にもエキスパートトレーダーにも最適なソリューション このインジケーターは独自の機能と新しい公式を多数内蔵しており、ユニークで高品質かつ手頃な取引ツールです。このアップデートでは、2つの時間枠ゾーンを表示できるようになります。より長いTFだけでなく、チャートTFとより長いTF(ネストゾーンを表示)の両方を表示できます。すべてのSupply Demandトレーダーの皆さんのお気に召すはずです。:) 重要情報の公開 Advanced Supply Demandの可能性を最大化するには、 https://www.mql5.com/ja/blogs/post/720245 にアクセスしてください。   エントリーまたはターゲットの正確なトリガーポイントを正確に特定できれば取引がどのように改善されるか想像してみてください。新しい基盤となるアルゴリズムに基づいて構築されているため、買い手と売り手の間の潜在的な不均衡をさらに簡単に特定できます。これは、最も強い需要と供給のゾーンと、過去のパフォーマンス(古いゾーンを表示)がグラフィカルに表現されるためです。これらの機能は、最適な
作者のその他のプロダクト
Introducing Meridian Signal, a trend-following signal indicator that turns every trend reversal into a clear, ready-to-use trade plan. Meridian tracks the market's direction with an adaptive trend line built from price channels, short moving averages, and ATR volatility. When the trend reverses, it marks the signal on your chart and instantly calculates your Entry, Stop Loss, and Take Profit. Everything you need to plan a trade is in one place, helping you spend less time analyzing and more tim
Obsidian Trend: Trend Reversal Signals with a Live Dashboard Obsidian Trend is a trend-following indicator that displays the market's direction as a single step-style trend line. When the trend reverses, it marks the change with an arrow and a BUY/SELL tag displaying the signal price. A live dashboard panel on the chart shows the current trend, the latest signal, and how price has moved since the signal appeared. The trend line follows the market using recent highs and lows over an adjustable A
Introducing Helix Ribbon, a trend-following ribbon indicator that turns every trend crossover into a clear, ready-to-read signal. Helix tracks the market's direction with two moving averages: a fast Triple Exponential Moving Average (TEMA) and a slow Hull Moving Average. The space between them is drawn as a flowing, color-shifting ribbon with thin strands inside it. When the fast line crosses the slow line, the ribbon twists and Helix marks the new trend on your chart with an arrow and a BUY/SEL
Introducing Vantage Bands, a multi-layer trend indicator that combines a Natural Moving Average, an anchored VWAP, a Bollinger cloud and a Kalman-smoothed Hull crossover into one clean chart overlay. Vantage reads the market in layers. The Natural Moving Average (NMA) shows the main trend and changes color with its slope. The anchored VWAP shows where the session's volume-weighted price sits. The Bollinger cloud shows how stretched price is. Two Kalman-filtered Hull lines, a Hull Trend line and
Zygos TDI
Muhammad Okasha Razaq
Introducing Zygos TDI, a Traders Dynamic Index indicator that turns RSI momentum, volatility and trend into one clear, ready-to-read window. Zygos builds on the classic TDI idea. It smooths the RSI into a fast price line and a slower signal line, then wraps them in volatility bands and a colour-changing baseline. When the price line crosses the signal line, Zygos marks the exact bar with an arrow. The bands show how stretched the market is, the baseline shows which way momentum is leaning, and t
Themis SMC
Muhammad Okasha Razaq
Introducing Themis SMC, a Smart Money Concepts indicator that puts market structure, order blocks, liquidity, fair value gaps, premium and discount zones and rule-based entry signals on one clean chart overlay. Themis reads the market in layers. Internal and swing structure show every Break of Structure (BOS) and Change of Character (CHoCH). Order blocks mark the zones where price is likely to react. Equal highs and lows show resting liquidity. Fair value gaps show imbalance. The premium and di
Introducing Nova Exhaustion , a trend exhaustion indicator that finds the bar where a move runs out of steam. It combines a 9-count setup, a filled SuperTrend and automatic support and resistance levels, all on one clean chart overlay. Nova Exhaustion counts consecutive closes against the close four bars earlier. Nine closes in a row below it mark selling exhaustion and a BUY. Nine closes in a row above it mark buying exhaustion and a SELL. The counts at 7 and 8 warn you early that a 9 is close.
Introducing Vortex Anchor , a multi-level market structure and Anchored VWAP indicator that brings swing analysis, trend bias, key price levels and entry signals together in one chart. Vortex Anchor tracks market structure through four independent ZigZag swing levels, each designed to highlight a different degree of price movement. From small local swings to major structural turning points, every level has its own marker, making it easier to distinguish short-term movements from broader market d
Introducing Trinity Nexus , a multi-indicator trend analysis tool that combines Flux, Core Trend, Pulse, and Anchor to identify market direction and generate aligned BUY/SELL signals. Trinity Nexus evaluates the selected indicators together, generating signals when all enabled components agree on market direction. It also offers configurable signal modes, trend-strength analysis, and an interactive dashboard for monitoring market conditions. Key Features: Four Indicator Components: Combines Flu
Lumen Trend
Muhammad Okasha Razaq
Introducing Lumen Trend , a multi-component trend analysis indicator that combines MACD momentum, RSI conditions, Wave Trend confirmation, and moving-average trend detection to identify potential BUY and SELL opportunities. Lumen Trend uses three configurable trend meters alongside two additional moving-average trend bars to assess market direction. When all three primary meters align, the indicator generates a potential BUY or SELL signal, with optional Wave Trend crossover confirmation to refi
Helios Flux
Muhammad Okasha Razaq
Introducing Helios Flux , a SuperTrend-based trend analysis and trading signal indicator that combines ATR bands, EMA bias, RSI momentum and candle confirmation to identify potential trend reversals and pullback opportunities. Helios Flux detects trend changes using an ATR-based SuperTrend engine and applies optional EMA, RSI and candle filters to validate entries. It also supports pullback re-entry signals, BUY/SELL markers, trade plan previews, customizable alerts and an interactive dashboard.
Introducing Kestrel Trail , a SuperTrend-based trend-following indicator that combines ATR trailing levels with optional RSI, ADX and EMA filters to identify potential BUY/SELL opportunities. Kestrel Trail uses ATR-based calculations to establish dynamic trailing levels and detects trend reversals when price crosses the trail. Optional confirmation filters help validate entries through momentum, trend strength and EMA direction, providing a structured approach to trend analysis. Key Features: Dy
Introducing Halcyon Channel , a Keltner Channel-based trend and trading signal indicator that combines EMA, ATR bands and optional RSI confirmation to identify potential BUY/SELL opportunities. Halcyon Channel builds dynamic price channels using an EMA basis and ATR-based upper and lower bands. It offers three entry modes: Breakout, Basis Cross and Band Re-entry, with optional RSI confirmation to validate signals. A trend-coloured basis, chart markers, live dashboard and customizable alerts prov
Introducing Eclipse Valkyrie , a relative volume and momentum-based trading indicator that combines RVOL analysis, EMA trend confirmation and price breakouts to identify potential BUY/SELL opportunities. Eclipse Valkyrie compares current volume against historical averages to classify market activity as Surge, Normal or Dormant. It combines EMA alignment, candle strength, breakout confirmation and minimum relative volume requirements to identify potential entries, supported by clear chart signal
Introducing Argent Aegis , a market-structure and fractal breakout indicator that combines confirmed fractal levels with HH, HL, LH and LL analysis to identify potential BUY/SELL opportunities. Argent Aegis identifies confirmed swing highs and lows, analyzes market structure and generates BUY signals when price closes above the latest upper fractal with higher-low confirmation, and SELL signals when price closes below the latest lower fractal with lower-high confirmation. It combines breakout co
Introducing Ambrosia Pulse , a momentum-based trading indicator that combines momentum strength and PPO confirmation to identify potential BUY/SELL opportunities. Ambrosia Pulse analyzes market momentum using a configurable momentum oscillator and PPO histogram, generating signals when both align and momentum strengthens. With clear chart labels, a live dashboard and customizable alerts, it provides a structured approach to identifying potential market entries. Key Features: Momentum Analysis:  
Introducing Moira Threads, a multi-factor trend analysis indicator that combines multiple market indicators to identify market direction, measure trend strength and detect potential trading opportunities. Moira evaluates market conditions using RSI, multi-timeframe EMA alignment, Bollinger Bands and relative strength against a configurable benchmark. These components contribute to a weighted score ranging from -100 to +100, which is used to determine the current trend state and generate trading
DynaRatchet
Muhammad Okasha Razaq
DynaRatchet is an automated trading tool that locks in your profits while giving your trades room to breathe. Much like a mechanical ratchet that only turns one way, this tool moves your safety floor forward as the market goes in your favor, but completely locks in place during temporary pullbacks. This removes the guesswork and emotion from deciding exactly when to exit a trade. Instead of using a rigid, fixed distance, it automatically studies the market's current speed. It widens during wild
フィルタ:
レビューなし
レビューに返信