Axiom RSI

Introducing Axiom RSI, a momentum and trend analysis indicator that combines advanced RSI calculations, moving-average trend detection, a color-coded histogram and rule-based BUY/SELL signals in one integrated indicator.

Axiom RSI combines RSI momentum with fast and slow moving-average channels to identify bullish, bearish and neutral market conditions. It offers multiple RSI calculation methods and customizable trend filters to adapt the analysis to different trading approaches.

When the selected conditions align, Axiom RSI identifies potential BUY and SELL opportunities through RSI pullback signals, trend-flip signals or both. It also provides automatic Entry, Stop Loss and Take Profit levels using ATR-based calculations.

Key Features:

  • Multiple RSI Methods: Choose from seven RSI calculation methods, with customizable periods, smoothing and price sources.
  • Dual Moving Average Trend System: Uses independent fast and slow moving-average channels to identify bullish and bearish market conditions.
  • Color-Coded Trend Histogram: Displays bullish, bearish and neutral trend states in the indicator window.
  • Third Moving Average Filter: Optional long-term trend filter for additional signal refinement.
  • BUY/SELL Signals: Choose RSI Pullback, Trend Flip or Both signal modes, with adjustable RSI filters and minimum signal spacing.
  • ATR-Based Trade Plan: Automatically calculates Entry, Stop Loss and Take Profit using a configurable ATR multiplier and Risk-to-Reward ratio.
  • Interactive Dashboard: Displays current trend, RSI momentum, latest signal and trade-plan information. The panel can be dragged, resized and minimized.
  • Chart Markers: Optional BUY/SELL arrows, labels, signal dots, trend arrows and vertical trend-change lines.
  • Customizable Alerts: Popup, sound, email and mobile push notifications for entry signals and trend changes.
  • Extensive Customization: Adjust RSI settings, moving averages, signal conditions, colors, markers, alerts and dashboard visibility.
  • Works on Any Symbol and Timeframe: Use Axiom RSI across Forex, metals, indices, stocks and cryptocurrencies.

Whether you focus on momentum analysis, trend direction or potential entry opportunities, Axiom RSI brings these tools together in one customizable indicator.

Specifications:

  • Platform: MetaTrader 5 (.ex5).
  • Seven RSI calculation methods.
  • Fast and slow moving-average trend channels with optional third MA filter.
  • Bullish, bearish and neutral trend histogram.
  • RSI Pullback, Trend Flip and combined BUY/SELL signals.
  • ATR-based Stop Loss and configurable Risk-to-Reward Take Profit.
  • Interactive dashboard and customizable chart markers.
  • Popup, sound, email and mobile push alerts.
  • Entry signals are evaluated on closed candles. Trend-flip alerts can optionally monitor the current, still-forming candle, where conditions may change before the candle closes.
  • Trading involves risk. Always test on a demo account first.

Contact

If you have any questions or need help, contact me via Private Message.


Önerilen ürünler
RBreaker
Zhong Long Wu
RBreaker Gold Indicators is a short-term intraday trading strategy for gold futures that combines trend following and intraday reversal approaches. It not only captures profits during trending markets but also enables timely profit-taking and counter-trend trading during market reversals. This strategy has been ranked among the top ten most profitable trading strategies by the American magazine   Futures Truth   for 15 consecutive years. It boasts a long lifecycle and remains widely used and st
What Is Trend Master Pro? Trend Master Pro   is a professional-grade trend trading indicator built for MetaTrader 5. It was designed with one goal in mind — to keep you on the right side of the market at all times by combining three powerful technical tools into a single, clean, easy-to-read display directly on your price chart. Instead of cluttering your screen with multiple separate indicators, Trend Master Pro fuses an   EMA Ribbon trend filter , a   ZigZag swing point engine , and a   breako
Caicai L&S Yield Histogram Important Notice: This indicator is an integral tool of the automated EA Caicai Long and Short Pair Trading . This indicator visually displays the percentage deviation (Yield %) of a pair's current spread relative to its own historical mean. It is an excellent tool for quickly visualizing the gross financial potential of a market distortion in Long & Short operations. Main Features: Percentage Visualization: Understand the size of the distortion in palpable percentage
The Non Repaint Buy/Sell Signals QCL MT5 Indicator is a powerful trading tool built on mathematical analysis. This software reduces chart noise avoids confusion when making trading decisions and provides clear market signals directly on MetaTrader 5 without repainting. Special launch discount price. Final price $149 Indicator User Manual User Manual Asset: XAUUSD Timeframe: 15 Minutes, We doing manual trading upon the signals sent by our Indicator Core Quantitative Architecture Adaptive Momentum
Structure King AI Signal Structure King AI Signal is a professional MetaTrader 5 trading indicator designed to help traders analyze market structure, trend direction, multi-timeframe confirmation and trade management from one clean dashboard. Key Features • Market Structure & Trend Analysis • BUY / SELL Signals • Multi-Timeframe (HTF) Confirmation • Entry Price Levels • Dynamic Stop Loss (SL) • TP1 / TP2 / TP3 Levels • ATR Volatility Analysis • ADX Trend Strength Filter • Adaptive Market Filter
Your Trend Friend
Luigi Nunes Labigalini
5 (1)
The trend is your friend! Look at the color of the indicator and trade on that direction. It does not  repaint. After each candle is closed, that's the color of the trend. You can focus on shorter faster trends or major trends, just test what's most suitable for the symbol and timeframe you trade. Simply change the "Length" parameter and the indicator will automatically adapt. You can also change the color, thickness and style of the lines. Download and give it a try! There are big movements w
ONNYX INDICATOR sürüm 1.14 MetaTrader 5 için onaylanmış ve yeniden boyanmayan sinyallere sahip arz-talep göstergesidir. Onaylı salınımları belirler, bölge genişliğini ATR ile ayarlar, kaliteyi yüzde olarak gösterir ve kapanmış mumlarda BUY/SELL okları çizer. TEMEL ÖZELLİKLER - Bölge içinde yüzde kalite puanı bulunan arz-talep bölgeleri. - Mum kapanışından sonra büyütülmüş BUY/SELL okları. - İsteğe bağlı EMA trend filtresi ve mum reddi onayı. - Trend, fiyat seviyeleri ve piyasa bağlamı paneli. -
Fabii Half Trend Baseline
Fabien Georges Andre Guillemaud
Üst zaman diliminin trendine karşı işlem yapmayı bırakın. İki baseline, tek grafik. Repaint yok. Her parite, her zaman dilimi. 2 dakikada grafiğinizde. Strategy Tester içinde ücretsiz demo. Get more indicators here Baselines, volatility filters and oscillators. No repaint. Neden ihtiyacınız var Grafiğinizde bir çizgi yeşile döndüğü için işleme girersiniz. Sonra üst zaman dilimini açarsınız ve daha büyük trendin ters yönde olduğunu görürsünüz. Sinyal gerçekti. Ama arkasındaki trend sizin taraf
PatternScope — Multi-Pattern Recognition for MT5 PatternScope is a multi-pattern recognition indicator for MetaTrader 5. It scans price action for classic chart patterns, confirms breakouts, and draws clear   Entry, Stop Loss and Take Profit   levels. A compact dashboard shows the latest pattern, bias and Risk:Reward. Patterns:   Double Top/Bottom, Triple Top/Bottom, Head and Shoulders (and inverted), Bullish & Bearish Flag, Pennant, Rising & Falling Wedge, Triangle, Rectangle, Cup and Handle —
Liquidity Order Blocks MT5
Johan Adrian Nieto Resendiz
Liquidity Order Blocks MT5 Liquidity Order Blocks MT5 is a professional visual indicator for MetaTrader 5 designed to help traders identify and monitor potential bullish and bearish liquidity areas directly on the chart. The indicator detects pivot-based order block zones and displays each zone with a structured visual breakdown of estimated bullish volume, bearish volume, relative strength and delta. Its purpose is to make liquidity areas easier to read, compare and monitor during market analys
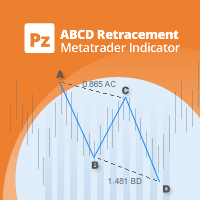
Identify precise entry and exit points with AB=CD patterns This indicator finds AB=CD retracement patterns. The AB=CD Retracement pattern is a 4-point price structure where the initial price segment is partially retraced and followed by an equidistant move from the completion of the pullback, and is the basic foundation for all harmonic patterns. [ Installation Guide | Update Guide | Troubleshooting | FAQ | All Products  ] Customizable pattern sizes Customizable AC and BD ratios Customizable b
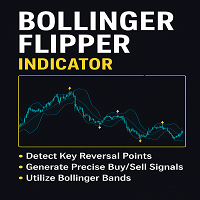
Introducing the Bollinger Flipper Indicator – Your Ultimate Trading Edge!   Are you tired of second-guessing your entries and exits? The Bollinger Flipper Indicator is here to flip the game in your favor.   Built with the power of Bollinger Bands + Level 3 Power System + ZigZag Fractals, this advanced tool is designed to spot high-probability buy & sell signals with precision. SPECIAL BONUS (VALID TILL JUNE 2026)- OUR DAILY SCALPER EA for BTCUSD and VIX75 •································
Fibaction
Abdelkhalek Orabi
Indicator Name: Fibaction – price action candle Detector Description: Fibo Signal Boxes is a powerful Smart Money Concept (SMC)-inspired indicator that auto-detects price action candles. bullish hammers and shooting stars, then draws precise Fibonacci entry zones and multiple take-profit levels directly on the chart. as for the SL personally i use 40 pips rules  Key Features: Detects bullish hammer and shooting star reversal candles. Automatically draws Fibonacci entry and TP boxes. as
TrendPulse Signal Pro, trend dönüşlerini algılayan, grafikte LONG ve SHORT girişlerini doğrudan işaretleyen ve her sinyal için otomatik olarak Stop Loss, Giriş ve üç Take Profit seviyesi çizen eksiksiz bir sinyal motorudur. Yerleşik performans paneli, simüle edilen kazanma oranınızı, mevcut işlem mesafesini ve 3 katmanlı risk yönetimi simülasyonunun sonucunu gösterir: birinci katman TP1'de kapanır ve kâr kilitlenir, ikinci katman TP2 veya TP1 kilidinde kapanır, üçüncü katman TP3'ten itibaren tra
The Rainbow Dragon Indicator by Quant Atlas Creator:  https://www.quant-atlas.com/ The Rainbow Dragon is a composite signal engine that aggregates the seven Rainbow indicators — Blue, Green, Indigo, Red, Violet, Yellow, and Orange — into a single confluence-based reading. Rather than relying on any one model, it treats each Rainbow component as an independent voter and fires only when enough of them agree, giving you a diversified, multi-method read on the market instead of a single point of vie
MarketMagnet
Kelly Adediran Raymond
Are you ready to take your trading journey to new heights? Look no further than MarketMagnet, this groundbreaking indicator designed to propel your trading success with excitement and accuracy. Powered by the convergence of Momentum and CCI (Commodity Channel Index), MarketMagnet equips traders with the ultimate tool to determine direction and entry prices for a wide range of recommended currency pairs and instruments. It is designed for traders seeking to scalp for a few pips on lower timeframe
This trading indicator is non-repainting, non-redrawing, and non-lagging, making it an ideal choice for both manual and automated trading. It is a Price Action–based system that leverages price strength and momentum to give traders a real edge in the market. With advanced filtering techniques to eliminate noise and false signals, it enhances trading accuracy and potential. By combining multiple layers of sophisticated algorithms, the indicator scans the chart in real-time and translates comple
RevTech
Bashier Awny Husein Ismail Alhafy
Revtech MT5 Indicator brings together institutional concepts, market-structure logic, and classic price action patterns in one advanced trading tool. From Fair Value Gaps and Order Blocks to Head & Shoulders and Triangle formations, Revtech helps traders identify quality setups with clear chart visuals and execution levels. With dashboard monitoring, alerts, and timeframe-based strategy alignment, Revtech is designed to turn raw price action into a structured trading opportunity. The indicator
C88 Projected Candle See the Bigger Picture Before the Candle Closes C88 Projected Candle is a professional market visualization indicator that projects the current higher timeframe candle directly onto your active chart. It helps traders understand the evolving market structure without constantly switching between timeframes. Whether you trade Price Action, ICT, Smart Money Concepts (SMC), or Volume Profile, this indicator provides a cleaner and more intuitive way to read market context. Key Fe
WBS SMC Without Repaint – Ultimate XAUUSD Scalping Engine (M5 Timeframe) Take your Gold trading to the institutional level with "WBS SMC Without Repaint", a highly advanced premium indicator engineered specifically for XAUUSD (Gold) on the M5 (5-Minute) timeframe.  Built upon the core pillars of Smart Money Concepts (SMC) combined with precise algorithmic candle pattern recognition, this tool identifies high-probability institutional footprints in real-time. Best of all: 100% ABSOLUTELY
This indicator uses the metaquotes ZigZag indicator as base to plot fibonacci extension and fibonacci retracement based in the Elliot waves. A fibonacci retracement will be plotted on every wave draw by the ZigZag. A fibonacci extension will be plotted only after the 2nd wave. Both fibonacci will be updated over the same wave tendency. Supporting until 9 consecutive elliot waves. Parameters: Depth: How much the algorithm will iterate to find the lowest and highest candles Deviation: Amount of
Noize Absorption Index - is the manual trading system that measures the difference of pressure between bears forces and bulls forces. Green line - is a noize free index that showing curent situation. Zero value of index shows totally choppy/flat market.Values above zero level shows how powerfull bullish wave is and values below zero measures bearish forces.Up arrow appears on bearish market when it's ready to reverse, dn arrow appears on weak bullish market, as a result of reverse expectation.
Introduction to the Manual Backtesting Indicator on MQL5 The MetaTrader platform provides an excellent backtesting tool for evaluating Expert Advisors (EAs). However, when it comes to manually backtesting a strategy to assess its effectiveness, this tool has some limitations: You cannot manually draw zones or trend lines while in backtesting mode. You cannot switch timeframes to check time alignment. For example, if my strategy requires additional confirmation from a higher timeframe (HTF), this
Smart Support And Resistance Indicator See the Market Levels That Matter. Make your chart clearer and your technical analysis more organized with Smart Support And Resistance Indicator — a powerful trading tool designed to help traders identify important support and resistance levels directly on their MetaTrader 5 charts. Whether you trade Forex, Gold, Indices, or other available markets, this indicator helps you focus on key price areas, monitor potential market reactions, and analyze price act
SMC Indicator BOS & CHoCH analyze market structure using Smart Money Concepts The indicator combines BOS (Break of Structure), CHoCH (Change of Character), Fair Value Gaps (FVG), Liquidity Sweep logic and ATR filtering to provide a structured view of market movements and potential trading opportunities. The indicator automatically identifies swing highs and swing lows and monitors structural breaks in the market. BOS (Break of Structure) identifies potential continuation of the current market st
STRICTLY FOR BOOM INDEX ONLY!!!!! Here I bring the Maximum Trend Arrows OT1.0 MT5 indicator. This indicator is made up of a combination of different trend indicators for entries and exits, for entries an orange arrow will paint on the chart below the current market and a red flag for closing of trades and it produces buy arrows only. When the orange arrow appears, it will appear along with it's sound to notify you. The 1H timeframe is recommended, don't use it anywhere else than on the 1H timefr
AutoTrend Pro
Aram Hussein Mohammed
TL Method — Automatic Trendline Detection & Strength Indicator Tired of drawing trendlines manually? TL Method does it for you — automatically detecting, drawing, and scoring trendlines in real time. What it does: Scans up to 1000 bars to find valid support and resistance trendlines Scores each trendline by counting confirmed anchor touches Generates buy/sell signal arrows when price approaches strong trendlines Alerts you via popup, push notification, or sound — with smart cooldown to avoid spa
CosmiCLab SMC FIBO CosmiCLab SMC FIBO is a professional trading indicator designed for traders who use Smart Money Concepts (SMC), market structure analysis and Fibonacci retracement levels. The indicator automatically detects market swings and builds Fibonacci levels based on the latest impulse movement. It also identifies market structure changes such as BOS (Break of Structure) and CHOCH (Change of Character), helping traders understand the current market direction. CosmiCLab SMC FIBO also pr
The indicator determines the state of the market: trend or flat. The state of the market is determined by taking into account volatility. The flat (trading corridor)is displayed in yellow. The green color shows the upward trend. The red color shows the downward trend. The height of the label corresponds to the volatility in the market. The indicator does not redraw . Settings History_Size   - the amount of history for calculation. Period_Candles  - the number of candles to calculate the indicat
Multi-timeframe Fibonacci and harmonic analysis for MetaTrader 5 MultiFibo Fts Zzb MultiFrame Harmonics is an interactive chart-analysis indicator for MetaTrader 5. It combines independent multi-timeframe ZigZag structure, Fibonacci levels, polarity levels, FTS PHI + phi zones, confluence areas and harmonic-pattern analysis in one floating on-chart panel. The indicator is designed for discretionary technical analysis. It does not open, modify or close trades. Why use it? View market structure fr
FREE
Bu ürünün alıcıları ayrıca şunları da satın alıyor
Trend Sniper X
Sarvarbek Abduvoxobov
4.86 (43)
Trend Sniper X , tüccarların trend yönünü ve olası dönüş noktalarını netlik ve hassasiyetle belirlemelerine yardımcı olan MetaTrader 5 için çoklu zaman dilimli bir trend takip göstergesidir. MT4 için: https://www.mql5.com/en/market/product/193245 Fiyat Bilgisi: Mevcut fiyat tanıtım amaçlıdır ve gelecek güncellemeler ile yeni özellikler yayınlandıkça değişebilir. Bonus Fırsatı: Bu indikatör için ÜCRETSİZ Oto-Trade Assistant EA'yı almak için lütfen satın aldıktan sonra yazara mesaj gönderin. Code
2019'da bu indikatörün neler yapabildiğini tüm dünyaya gösterdim. Sinyallerine göre elle, gerçek hesapta ve herkesin gözü önünde işlem yaptım — hesap Myfxbook'ta izleniyordu ve bu deneyi Facebook'ta ayrıntılı olarak paylaştım. Sonuç: 10.000 dolar dört ayda 941.411 dolara dönüştü. Risk bilinçli olarak aşırıydı — drawdown %54'e kadar çıktı, çünkü mesleğimizde kâr ve risk her zaman el ele gider. Myfxbook ekran görüntüsü galerideki ilk resimdir. Görünen o ki sizi tebrik edebilirim: arayışınız sona e
Gann Made Easy , bay teorisini kullanarak ticaretin en iyi ilkelerine dayanan, profesyonel ve kullanımı kolay bir Forex ticaret sistemidir. WD Gann. Gösterge, Zararı Durdur ve Kâr Al Seviyeleri dahil olmak üzere doğru SATIN AL ve SAT sinyalleri sağlar. PUSH bildirimlerini kullanarak hareket halindeyken bile işlem yapabilirsiniz. Satın alma işleminden sonra, alım satım talimatlarını ve harika ek göstergeleri ücretsiz olarak almak için lütfen benimle iletişime geçin! Muhtemelen Gann ticaret yöntem
M1 Sniper MT5
Oleg Rodin
5 (7)
M1 SNIPER   kullanımı kolay bir işlem göstergesi sistemidir. M1 zaman dilimi için tasarlanmış bir ok göstergesidir. Gösterge, M1 zaman diliminde scalping için bağımsız bir sistem olarak kullanılabilir ve mevcut işlem sisteminizin bir parçası olarak kullanılabilir. Bu işlem sistemi özellikle M1'de işlem yapmak için tasarlanmış olsa da, diğer zaman dilimleriyle de kullanılabilir. Başlangıçta bu yöntemi XAUUSD ve BTCUSD ticareti için tasarladım. Ancak bu yöntemi diğer piyasalarda işlem yaparken de
Ultra Indicator
Ihor Otkydach
5 (1)
ULTRA, “hepsi bir arada” prensibiyle çalışan bir teknik göstergedir; piyasayı bağımsız olarak analiz eder, işlem sinyalleri üretir, stop-loss emirlerinin verileceği seviyeleri gösterir ve kârı garantilemek ya da zararı en aza indirmek için işlemlerin ne zaman kapatılması gerektiğini önerir. Başka bir deyişle, piyasayı nasıl analiz edeceğinizi bilmeseniz, seviyeleri (stop-loss'unuzu nereye koyacağınızı) belirleyemeseniz ya da para yönetimi konusunda zorluk yaşasanız da fark etmez. ULTRA tüm bunla
Adaptive Price Action Engine Göstergeyi al, EA'sı (Uzman Danışman) bedava gelsin Kendi Kendini Optimize Eden Multi-Timeframe Trend ve Mum Formasyonu Analizi Piyasalar sürekli değişir ve her Price Action formasyonu her piyasa koşulunda aynı değere sahip değildir. Adaptive Price Action Engine , değişen piyasa koşullarına uyum sağlamak amacıyla trend yapısını, Multi-Timeframe analizini, mum formasyonlarını ve istatistiksel optimizasyonu tek bir analiz sistemi içerisinde birleştirir. İki Adaptif Mod
ARICoins
Temirlan Kdyrkhan
ARICoin is a powerful trading companion designed to generate high-probability entry signals with dynamic TP/SL/DP levels based on volatility. Built-in performance tracking shows win/loss stats, PP1/PP2 hits, and success rates all updated live. Key Features: Buy/Sell signals with adaptive volatility bands Real-time TP/SL/DP levels based on ATR Built-in MA Filter with optional ATR/StdDev volatility Performance stats panel (Success, Profit/Loss, PP1/PP2) Alerts via popup, sound, push, or email Cust
Boba Analysis Suite
Trade Ready Solutions LLC
5 (2)
Boba Analysis Suite Boba Analysis Suite, MetaTrader 5 için geliştirilmiş bir analiz göstergesidir. Piyasa yapısını, önemli fiyat bölgelerini ve genel piyasa bağlamını tek bir grafik görünümünde bir araya getirir. Trader ve trading eğitmeni olarak edinilen uygulamalı deneyimden yola çıkarak geliştirilmiştir. Piyasanın yönünü değerlendirme, önemli seviyeleri belirleme ve birden fazla zaman dilimini birlikte inceleme gibi adımlardan oluşan sistematik bir analiz sürecini destekler. Piyasa Bağlamını
ScalpPoint
Temirlan Kdyrkhan
ScalpPoint is a powerful trading companion designed to generate high-probability entry signals with dynamic TP/SL/DP levels based on volatility. Built-in performance tracking shows win/loss stats, PP1/PP2 hits, and success rates — all updated live. Key Features: Buy/Sell signals with adaptive volatility bands Real-time TP/SL/DP levels based on ATR Built-in MA Filter with optional ATR/StdDev volatility Performance stats panel (Success, Profit/Loss, PP1/PP2) Alerts via popup, sound, push, or emai
Zain Gold Scalping
Ahmed Gamal Abdel Nasser Mohamed
A complete price-action analysis tool built around dual independent entry logic, each confirmed against a volatility band, combined with a configurable set of nine optional confirmation filters that let you shape exactly how conservative or aggressive the tool's signals behave. Core Strategy Two independent entry setups, each triggering only when price moves outside a dynamic volatility band — giving two distinct ways to spot potential reversal points, which can be used together or separately.
Azimuth Pro
Ottaviano De Cicco
5 (7)
Azimuth Pro V2: Synthetic Fractal Structure and Confirmed Entries for MT5 Overview Azimuth Pro is a multi-level swing structure indicator by Merkava Labs . Four nested swing layers, swing-anchored VWAP, ABC pattern detection, three-timeframe structural filtering, and closed-bar confirmed entries — one chart, one workflow from micro-swings to macro-cycles. This is not a blind signal product. It is a structure-first workflow for traders who care about location, context, and timing. Halloween P
Auto Optimized SpeedAngle , sürekli İleriye Dönük Optimizasyon (Walk-Forward Optimization, WFO) yoluyla eğri uydurmayı (curve-fitting) ortadan kaldıran kurumsal düzeyde bir momentum vektörleme sistemidir. Piyasa rejimleri değiştiğinde etkinliğini yitiren statik girdilere güvenmek yerine, gösterge, örneklem dışı (Out-of-Sample, OOS) doğrulama kullanarak parametrelerini dinamik olarak yeniden kalibre eder ve böylece gösterilen sinyallerin geçmişteki rastgele anomalileri değil, gerçek bir istatisti
Superhero
Ihor Otkydach
5 (3)
SUPERHERO göstergesi, "her şeyi kapsayan" bir temele dayalı olarak tasarlanmış çoklu para birimli bir işlem sistemidir. Gösterge, piyasayı bağımsız olarak analiz eder ve işlemlerin ne zaman açılıp kapatılacağına dair sinyaller verir. Stop Loss ve Take Profit emirlerini kullanır. R:R oranı 1:1'dir. Bu sistem akıllı telefonunuza anlık bildirimler gönderebilir; böylece bir bilgisayara bağlı kalmanıza gerek kalmadan "hareket halindeyken" işlem yapabilirsiniz. Bu, özel ticaret şirketleri için idealdi
Çoklu Para Birimi Güç ve Momentum Göstergesi MT5 Dynamic Forex28 Navigator, uzun süredir popüler olan göstergelerimizin gelişmiş halidir ve üç aracın gücünü tek bir araçta birleştirir: Advanced Currency Strength28 Indicator (700 değerlendirme) Advanced Currency IMPULSE with ALERT (530 değerlendirme) CS28 Combo Signals (güncel bonus) İki önceki gösterge MQL5 Market'te birlikte 1.200'den fazla değerlendirme aldı ve 2016'dan bu yana MT4 topluluğunun vazgeçilmez araçlarından biri. Dynamic Forex28 Na
Volatility Master for MetaTrader is a real-time dashboard tool that scans up to  50 symbols  to identify high-volatility , trending markets instantly. With bullish/bearish signals, customizable alerts, and a user-friendly interface, it helps you avoid range-bound conditions and focus on high-probability trades. Clarity leads to confidence. Trade confidently and protect your capital effectively with this powerful dashboard. We don't offer free or bonus indicators in exchange of reviews from you.
Apex Patterns PRO İndikatörü Satın Alın - Üzerine Kurulu Expert Advisor'a ÜCRETSİZ Sahip Olun. Kendini Optimize Eden Grafik Formasyonu ve Kırılım Zekası Geleneksel formasyon tarayıcıları sabit girdilere dayanır ve piyasa volatilitesi ile yapıları değiştiğinde genellikle düşük performans gösterir. Apex Patterns PRO, yapısal grafik formasyon tanımayı, momentum filtrelemeyi ve istatistiksel kendi kendini optimizasyonu tek bir analitik çerçevede birleştirerek değişen piyasa koşullarına uyum sağlama
Neuro Poseidon MT5
Daria Rezueva
4.68 (53)
Neuro Poseidon is a new indicator by Daria Rezueva. It combines precise trading signals with adaptive TP/SL levels - creating best possible trades as a result! Message me and get  Neuro Poseidon Assistant  as a gift to automize your trading process! What makes it stand out? 1. Proven profitability on all assets and timeframes 2. Only confirmed BUY and SELL signals present on the chart 3. Adaptive TP & SL levels generated by the software for each trade 4. Easy to understand - suitable for al
SIO Oscillator: Kendi Kendini Optimize Eden Yarı Varyans Dengesizlik Osilatörü İndikatörü satın alın, ona dayalı Uzman Danışmanı (EA) ÜCRETSİZ edinin. Çoğu osilatör, tüm fiyat hareketlerini aynı şekilde değerlendirir. SIO ise yükseliş ve düşüş baskısını birbirinden ayırır ve aralarındaki dengesizliği ölçerek piyasayı gerçekte kimin kontrol ettiğini gösterir: alıcılar mı, satıcılar mı. Dengesizlik bir uç noktaya ulaştığında SIO, giriş, Stop Loss ve Take Profit seviyeleriyle birlikte net bir sinya
Currency Strength Wizard , başarılı ticaret için size hepsi bir arada çözüm sağlayan çok güçlü bir göstergedir. Gösterge, birden çok zaman dilimindeki tüm para birimlerinin verilerini kullanarak şu veya bu forex çiftinin gücünü hesaplar. Bu veriler, şu veya bu para biriminin gücünü görmek için kullanabileceğiniz, kullanımı kolay para birimi endeksi ve para birimi güç hatları biçiminde temsil edilir. İhtiyacınız olan tek şey, işlem yapmak istediğiniz tabloya göstergeyi eklemektir ve gösterge size
AriFocus
Temirlan Kdyrkhan
AriFocus - Non-Repainting Buy/Sell Signals AriFocus - one clear signal. AriFocus marks buy and sell signals directly on the chart and suggests a stop-loss level for each one. Every signal is confirmed on bar close and never repaints. - Buy/sell arrows, confirmed on bar close - Suggested stop-loss level for every signal - Trend band and candle coloring to show direction at a glance - 10 ready-made presets, or your own settings (14 calculation methods) - Pop-up, push and email alerts with entr
SkyHammer Signal Pro Entry, SL ve TP seviyeleri kilitlenen profesyonel no-repaint trend sinyal indikatörü SkyHammer Signal Pro, net, sabit ve doğrulanabilir sinyaller isteyen yatırımcılar için tasarlanmış yapılandırılmış bir trend ve momentum sinyal indikatörüdür. En iyi M1 ve M5 gibi düşük zaman dilimlerinde çalışır. İndikatör piyasanın tepe veya dip noktalarını tahmin etmeye çalışmaz. Bunun yerine sinyal üretmeden önce onaylanmış piyasa yapısı, trend yönü, momentum gücü, sağlıklı volatilite ve
Unlock hidden profits: accurate divergence trading for all markets Tricky to find and scarce in frequency, divergences are one of the most reliable trading scenarios. This indicator finds and scans for regular and hidden divergences automatically using your favourite oscillator. [ Installation Guide | Update Guide | Troubleshooting | FAQ | All Products  ] Easy to trade Finds regular and hidden divergences Supports many well known oscillators Implements trading signals based on breakouts Displays
PainX GainX Blue Spike Fusion AI Synthetic Index Spike Analysis Indicator for MetaTrader 5 Overview PainX GainX Blue Spike Fusion AI is a technical analysis indicator for MetaTrader 5, designed to help traders monitor potential spike setups on compatible synthetic indices. The indicator combines signal monitoring, market-condition analysis, chart markers, notifications, and an on-chart information panel. It presents relevant market information in an organized format to help traders evaluate pote
Apollo SR Master , Destek/Direnç bölgelerinde alım satımı daha kolay ve güvenilir hale getiren özelliklere sahip bir Destek/Direnç göstergesidir. Gösterge, yerel fiyat zirvelerini ve diplerini tespit ederek Destek/Direnç bölgelerini herhangi bir gecikme olmadan gerçek zamanlı olarak hesaplar. Ardından, yeni oluşan Destek/Direnç bölgesini doğrulamak için, Destek/Direnç bölgesinin dikkate alınabileceğini ve gerçek bir SAT veya AL sinyali olarak kullanılabileceğini gösteren özel bir sinyal gösterir
Scalper Vault, gün içi işlemlerde istikrar yakalamak isteyen yatırımcılar için tasarlanmış, güçlü ve tam donanımlı bir alım satım sistemidir. Bu yüksek hassasiyetli gösterge; hem Forex hem de İkili Opsiyon yatırımcıları için kurumsal düzeyde analizler sunan, bağımsız ve eksiksiz bir alım satım sistemi işlevi görür. SATIN ALIM İŞLEMİNDEN SONRA BENİMLE İLETİŞİME GEÇİN; ALIM SATIM İPUÇLARIMI VE HARİKA BİR BONUSU ALIN! Tahmin yürütme zorunluluğunu ve karmaşık manuel analiz süreçlerini ortadan kaldı
The Oracle Pro
Ottaviano De Cicco
5 (1)
The Oracle Pro: Synthetic Multi-Timeframe Bias Engine for MT5 Halloween Promo — 35% OFF The market gets spooky. Your edge stays sharp. Save 35% before this offer fades into the mist. The Oracle Pro is now USD 194 (regular USD 299). The Oracle Pro is a premium multi-timeframe bias engine for MetaTrader 5, built for demanding and professional traders. It answers one question with discipline: what is the directional bias on each timeframe right now, how strong is it, and how much do the timefra
Divergence Bomber
Ihor Otkydach
4.89 (94)
Bu göstergeyi satın alan herkese aşağıdaki ekstra içerikler ücretsiz olarak sunulmaktadır: Her işlemi otomatik olarak yöneten, Stop Loss ve Take Profit seviyelerini ayarlayan ve işlemleri strateji kurallarına göre kapatan özel yardımcı araç: "Bomber Utility" Göstergenin farklı varlıklar üzerinde kullanılmasına yönelik ayar dosyaları (set dosyaları) Bomber Utility için 3 farklı modda kullanım sunan ayar dosyaları: "Minimum Risk", "Dengeli Risk" ve "Bekle-Gör Stratejisi" Bu ticaret stratejisini
TREND ÇİZGİLERİ PRO     Piyasanın gerçek yön değişimini anlamaya yardımcı olur. Gösterge, gerçek trend dönüşlerini ve büyük oyuncuların piyasaya yeniden girdiği noktaları gösterir. Anlıyorsun     BOS hatları  Daha yüksek zaman dilimlerindeki trend değişiklikleri ve önemli seviyeler, karmaşık ayarlar veya gereksiz gürültü olmadan gösterilir. Sinyaller yeniden çizilmez ve çubuk kapandıktan sonra grafikte kalır. VERSION MT 4     -    RFI LEVELS PRO  göstergesiyle birlikte kullanıldığında maksimum p
FootPrint Chart MT5
Gayathiri Gopalakrishnan
5 (1)
Turn every candle into a bid x ask footprint built from real tick data. See who is actually trading at each price, with delta, volume profile, imbalance zones and a scored setup engine that prints entry, stop and target Order Flow Footprint Chart Pro Most indicators tell you what price did. This one tells you who did it. Order Flow Footprint Chart Pro rebuilds every candle on your chart from raw tick data and shows you the volume that traded at each individual price inside it, split into the am
Quantum TrendPulse
Bogdan Ion Puscasu
5 (26)
SuperTrend   ,   RSI   ve   Stochastic'in   gücünü tek bir kapsamlı göstergede birleştirerek işlem potansiyelinizi en üst düzeye çıkaran nihai işlem aracı olan   Quantum TrendPulse'u   tanıtıyoruz. Hassasiyet ve verimlilik arayan yatırımcılar için tasarlanan bu gösterge, piyasa trendlerini, momentum değişimlerini ve en uygun giriş ve çıkış noktalarını güvenle belirlemenize yardımcı olur. Temel Özellikler: SuperTrend Entegrasyonu:   Güncel piyasa trendlerini kolayca takip edin ve karlılık dalgası
Yazarın diğer ürünleri
Meridian Signal
Muhammad Okasha Razaq
Introducing Meridian Signal, a trend-following signal indicator that turns every trend reversal into a clear, ready-to-use trade plan. Meridian tracks the market's direction with an adaptive trend line built from price channels, short moving averages, and ATR volatility. When the trend reverses, it marks the signal on your chart and instantly calculates your Entry, Stop Loss, and Take Profit. Everything you need to plan a trade is in one place, helping you spend less time analyzing and more tim
Obsidian Trend
Muhammad Okasha Razaq
Obsidian Trend: Trend Reversal Signals with a Live Dashboard Obsidian Trend is a trend-following indicator that displays the market's direction as a single step-style trend line. When the trend reverses, it marks the change with an arrow and a BUY/SELL tag displaying the signal price. A live dashboard panel on the chart shows the current trend, the latest signal, and how price has moved since the signal appeared. The trend line follows the market using recent highs and lows over an adjustable A
Helix Ribbon
Muhammad Okasha Razaq
Introducing Helix Ribbon, a trend-following ribbon indicator that turns every trend crossover into a clear, ready-to-read signal. Helix tracks the market's direction with two moving averages: a fast Triple Exponential Moving Average (TEMA) and a slow Hull Moving Average. The space between them is drawn as a flowing, color-shifting ribbon with thin strands inside it. When the fast line crosses the slow line, the ribbon twists and Helix marks the new trend on your chart with an arrow and a BUY/SEL
Vantage Bands
Muhammad Okasha Razaq
Introducing Vantage Bands, a multi-layer trend indicator that combines a Natural Moving Average, an anchored VWAP, a Bollinger cloud and a Kalman-smoothed Hull crossover into one clean chart overlay. Vantage reads the market in layers. The Natural Moving Average (NMA) shows the main trend and changes color with its slope. The anchored VWAP shows where the session's volume-weighted price sits. The Bollinger cloud shows how stretched price is. Two Kalman-filtered Hull lines, a Hull Trend line and
Zygos TDI
Muhammad Okasha Razaq
Introducing Zygos TDI, a Traders Dynamic Index indicator that turns RSI momentum, volatility and trend into one clear, ready-to-read window. Zygos builds on the classic TDI idea. It smooths the RSI into a fast price line and a slower signal line, then wraps them in volatility bands and a colour-changing baseline. When the price line crosses the signal line, Zygos marks the exact bar with an arrow. The bands show how stretched the market is, the baseline shows which way momentum is leaning, and t
Themis SMC
Muhammad Okasha Razaq
Introducing Themis SMC, a Smart Money Concepts indicator that puts market structure, order blocks, liquidity, fair value gaps, premium and discount zones and rule-based entry signals on one clean chart overlay. Themis reads the market in layers. Internal and swing structure show every Break of Structure (BOS) and Change of Character (CHoCH). Order blocks mark the zones where price is likely to react. Equal highs and lows show resting liquidity. Fair value gaps show imbalance. The premium and di
Nova Exhaustion
Muhammad Okasha Razaq
Introducing Nova Exhaustion , a trend exhaustion indicator that finds the bar where a move runs out of steam. It combines a 9-count setup, a filled SuperTrend and automatic support and resistance levels, all on one clean chart overlay. Nova Exhaustion counts consecutive closes against the close four bars earlier. Nine closes in a row below it mark selling exhaustion and a BUY. Nine closes in a row above it mark buying exhaustion and a SELL. The counts at 7 and 8 warn you early that a 9 is close.
Vortex Anchor
Muhammad Okasha Razaq
Introducing Vortex Anchor , a multi-level market structure and Anchored VWAP indicator that brings swing analysis, trend bias, key price levels and entry signals together in one chart. Vortex Anchor tracks market structure through four independent ZigZag swing levels, each designed to highlight a different degree of price movement. From small local swings to major structural turning points, every level has its own marker, making it easier to distinguish short-term movements from broader market d
Trinity Nexus
Muhammad Okasha Razaq
Introducing Trinity Nexus , a multi-indicator trend analysis tool that combines Flux, Core Trend, Pulse, and Anchor to identify market direction and generate aligned BUY/SELL signals. Trinity Nexus evaluates the selected indicators together, generating signals when all enabled components agree on market direction. It also offers configurable signal modes, trend-strength analysis, and an interactive dashboard for monitoring market conditions. Key Features: Four Indicator Components: Combines Flu
Lumen Trend
Muhammad Okasha Razaq
Introducing Lumen Trend , a multi-component trend analysis indicator that combines MACD momentum, RSI conditions, Wave Trend confirmation, and moving-average trend detection to identify potential BUY and SELL opportunities. Lumen Trend uses three configurable trend meters alongside two additional moving-average trend bars to assess market direction. When all three primary meters align, the indicator generates a potential BUY or SELL signal, with optional Wave Trend crossover confirmation to refi
Helios Flux
Muhammad Okasha Razaq
Introducing Helios Flux , a SuperTrend-based trend analysis and trading signal indicator that combines ATR bands, EMA bias, RSI momentum and candle confirmation to identify potential trend reversals and pullback opportunities. Helios Flux detects trend changes using an ATR-based SuperTrend engine and applies optional EMA, RSI and candle filters to validate entries. It also supports pullback re-entry signals, BUY/SELL markers, trade plan previews, customizable alerts and an interactive dashboard.
Kestrel Trail
Muhammad Okasha Razaq
Introducing Kestrel Trail , a SuperTrend-based trend-following indicator that combines ATR trailing levels with optional RSI, ADX and EMA filters to identify potential BUY/SELL opportunities. Kestrel Trail uses ATR-based calculations to establish dynamic trailing levels and detects trend reversals when price crosses the trail. Optional confirmation filters help validate entries through momentum, trend strength and EMA direction, providing a structured approach to trend analysis. Key Features: Dy
Halcyon Channel
Muhammad Okasha Razaq
Introducing Halcyon Channel , a Keltner Channel-based trend and trading signal indicator that combines EMA, ATR bands and optional RSI confirmation to identify potential BUY/SELL opportunities. Halcyon Channel builds dynamic price channels using an EMA basis and ATR-based upper and lower bands. It offers three entry modes: Breakout, Basis Cross and Band Re-entry, with optional RSI confirmation to validate signals. A trend-coloured basis, chart markers, live dashboard and customizable alerts prov
Eclipse Valkyrie
Muhammad Okasha Razaq
Introducing Eclipse Valkyrie , a relative volume and momentum-based trading indicator that combines RVOL analysis, EMA trend confirmation and price breakouts to identify potential BUY/SELL opportunities. Eclipse Valkyrie compares current volume against historical averages to classify market activity as Surge, Normal or Dormant. It combines EMA alignment, candle strength, breakout confirmation and minimum relative volume requirements to identify potential entries, supported by clear chart signal
Argent Aegis
Muhammad Okasha Razaq
Introducing Argent Aegis , a market-structure and fractal breakout indicator that combines confirmed fractal levels with HH, HL, LH and LL analysis to identify potential BUY/SELL opportunities. Argent Aegis identifies confirmed swing highs and lows, analyzes market structure and generates BUY signals when price closes above the latest upper fractal with higher-low confirmation, and SELL signals when price closes below the latest lower fractal with lower-high confirmation. It combines breakout co
Ambrosia Pulse
Muhammad Okasha Razaq
Introducing Ambrosia Pulse , a momentum-based trading indicator that combines momentum strength and PPO confirmation to identify potential BUY/SELL opportunities. Ambrosia Pulse analyzes market momentum using a configurable momentum oscillator and PPO histogram, generating signals when both align and momentum strengthens. With clear chart labels, a live dashboard and customizable alerts, it provides a structured approach to identifying potential market entries. Key Features: Momentum Analysis:  
Moira Threads
Muhammad Okasha Razaq
Introducing Moira Threads, a multi-factor trend analysis indicator that combines multiple market indicators to identify market direction, measure trend strength and detect potential trading opportunities. Moira evaluates market conditions using RSI, multi-timeframe EMA alignment, Bollinger Bands and relative strength against a configurable benchmark. These components contribute to a weighted score ranging from -100 to +100, which is used to determine the current trend state and generate trading
DynaRatchet
Muhammad Okasha Razaq
DynaRatchet is an automated trading tool that locks in your profits while giving your trades room to breathe. Much like a mechanical ratchet that only turns one way, this tool moves your safety floor forward as the market goes in your favor, but completely locks in place during temporary pullbacks. This removes the guesswork and emotion from deciding exactly when to exit a trade. Instead of using a rigid, fixed distance, it automatically studies the market's current speed. It widens during wild
Filtrele:
Değerlendirme yok
Değerlendirmeye yanıt