IBI Volume Profile
- インディケータ
-
Brahim Eljaziri
 IBI-System
Trader since 2008, specialized in developing indicators and Expert Advisors for MetaTrader.
Focus: order flow tools based on real exchange data (footprint, imbalance, delta, CVD).
Educational tools only — not financial advice. - バージョン: 1.50
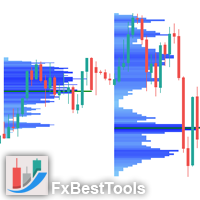
IBI Volume Profile shows, for each session, how much real exchange volume traded at every price — calculated trade by trade from the real trades of the exchange.
What you see
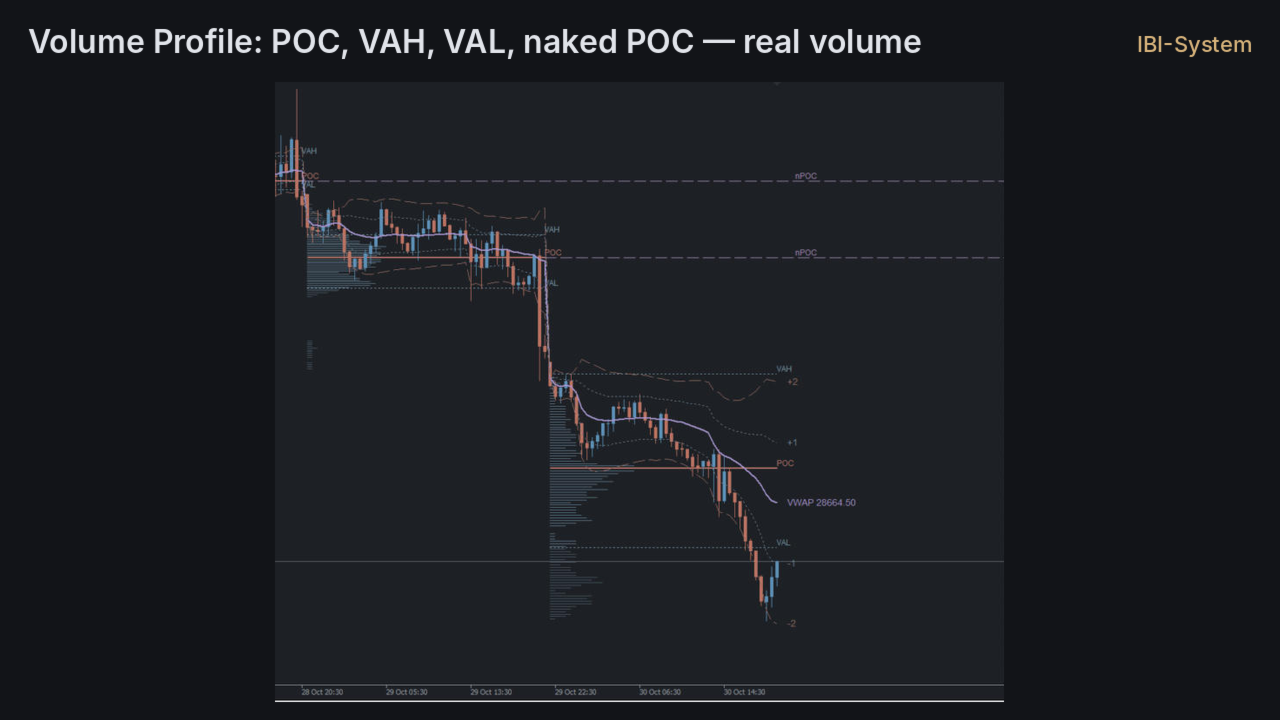
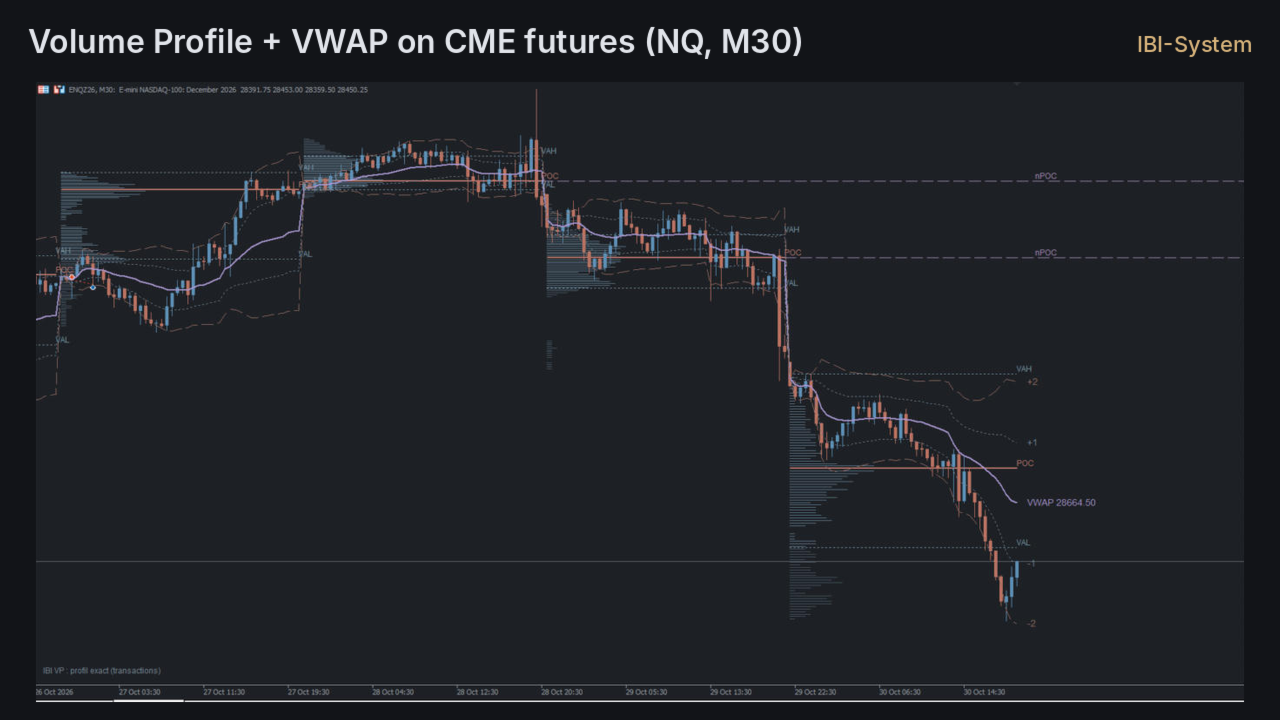
- Volume profile of each session: one thin horizontal line per price level. The longer the line, the more contracts traded at that price — you see at a glance where the market accepted price (high volume) and where it rejected it (low volume).
- POC (Point of Control): the price with the highest traded volume of the session.
- VAH / VAL (Value Area): the zone holding 70% of the session volume, built outward from the POC.
- nPOC (naked POCs): POCs of past sessions that price has not revisited yet, extended to the right until touched — they often act as price magnets.
- Small status text: trades load in the background without freezing the chart, then "exact profile (trades)" is shown.
Sessions
- CME: 6 pm → 5 pm New York time (full futures session)
- New York: 9:30 am → 4 pm
- Tokyo: 9 am → 3 pm
Server time is detected automatically.
Requirements
- CME futures only (MNQ, NQ, MES, ES, CL, GC…): real exchange volume is required. A broker such as AMP Global USA provides this data, even on a free demo account.
- Does not work on CFDs / Forex: there is no real exchange volume — the indicator draws nothing and shows "CME futures required".
Main inputs
- Session type, number of sessions, row height in ticks (0 = automatic), Value Area % (default 70), maximum profile length, volume bar thickness (1 = thin).
- Show/hide naked POCs and labels; soft, eye-friendly colours, all adjustable.
- Recommended timeframes: M5 to H1.
Made by IBI-System. Free tool for education. It does not trade and gives no buy/sell advice. Trading involves risk.