IBI Imbalance
- インディケータ
-
Brahim Eljaziri
 IBI-System
Trader since 2008, specialized in developing indicators and Expert Advisors for MetaTrader.
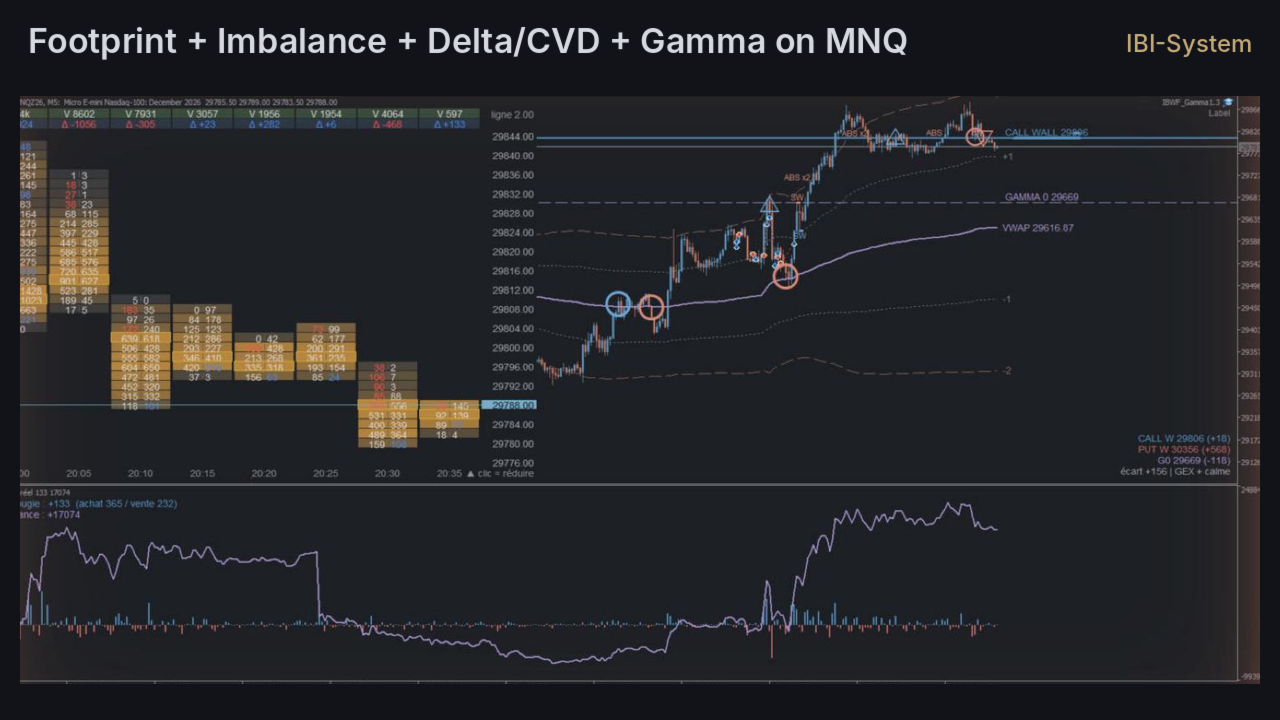
Focus: order flow tools based on real exchange data (footprint, imbalance, delta, CVD).
Educational tools only — not financial advice. - バージョン: 2.40
IBI Imbalance shows who is in control — buyers or sellers — directly on the price chart, from the real trades of the exchange.
What you see
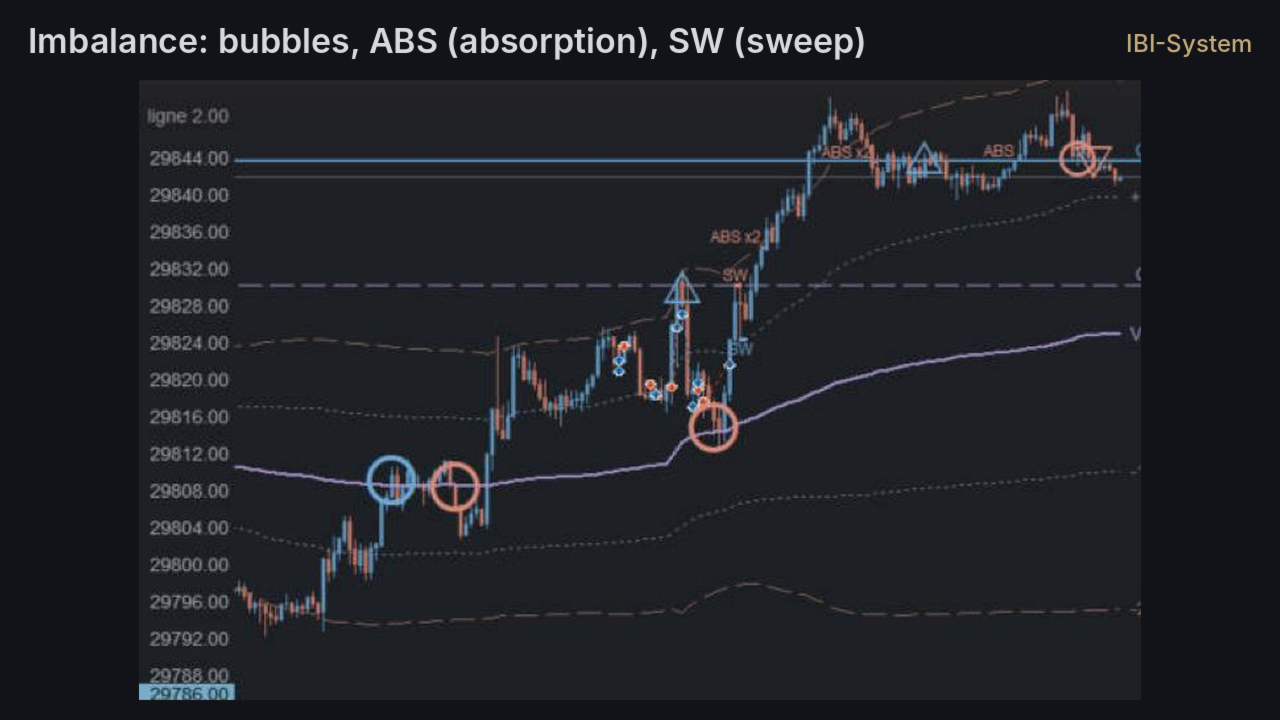
- Bubbles: buy imbalances (blue) and sell imbalances (red), read diagonally like a footprint. Bigger bubble = more volume; stacked imbalances = stronger signal. A large live imbalance pulses.
- Large aggressive orders reconstructed from the trades (triangles).
- ABS (absorption): heavy aggressive volume that does not move the price.
- SW (sweep): several large orders on the same side climbing the book quickly, then price comes back.
- Filter: all signals, only the strongest, only near levels (VWAP ±1/±2 computed on real volume, Gamma levels when IBI Gamma Levels is on the chart), or strongest + levels (default).
Requirements: real exchange data (CME futures such as MNQ / NQ / MES; e.g. AMP Global USA, free demo account). On CFD / Forex symbols the indicator shows a message and stays inactive.
Main inputs: days of history, level size, minimum ratio (250 %), minimum volume, large-order size, absorption and sweep settings, signal filter, soft colors.
Free tool for education. It does not trade and gives no buy/sell advice. Trading involves risk.