Regime Scope MT5
- インディケータ
-
Damir Ikinic
 🔷 VELTIS — プロフェッショナル・アルゴリズム取引システム
VELTISでは、体系的なリサーチ、規律あるリスク管理、堅牢なソフトウェアエンジニアリングを基盤としたプロフェッショナルな自動売買システムを開発しています。単にできるだけ多く取引するEAや、人為的に高く見せた勝率を宣伝することは目的としていません。私たちは、リスク、リターン、ドローダウン、長期的な期待値の関係全体を重視しています。
🔷 リスク管理は戦略の一部です - バージョン: 1.41
VELTIS RegimeScope
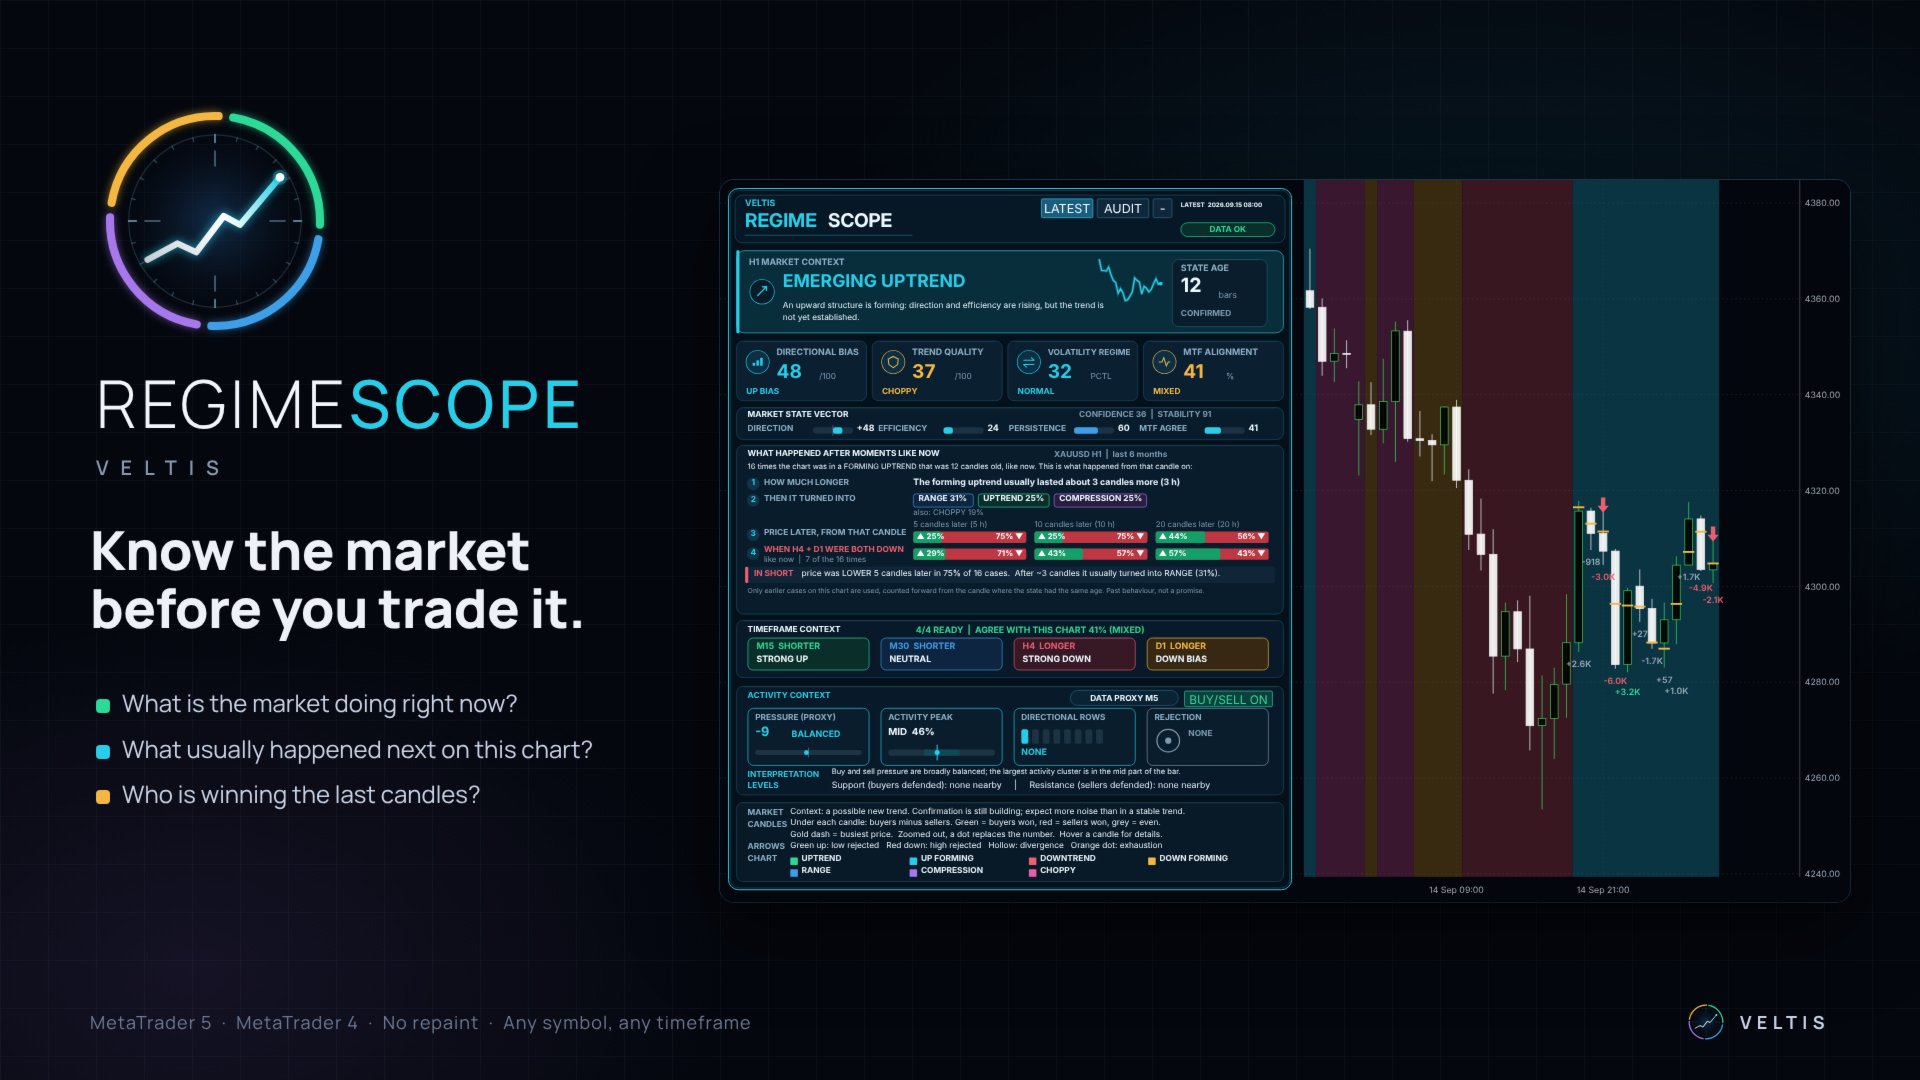
RegimeScope is an analysis panel for MetaTrader 5. It shows what kind of market the chart is in, whether the other timeframes agree with it, and how price moved after similar situations in the history of the same symbol and timeframe. The indicator does not open trades and does not give buy or sell signals. It is meant as context for your own trading decisions.
A step-by-step user manual with every element of the panel explained is available in the author's blog: [LINK TO BLOG POST]
Questions and suggestions are welcome in the comments section or by private message.
Free for the first 100 downloads. $129 after the free licenses have been exhausted
Main features
- Market state. Every closed candle receives one of seven states: uptrend, forming uptrend, downtrend, forming downtrend, range, compression and choppy. The states are derived from swing highs and lows. A new move starts when price turns by about two average candle sizes. It is shown as forming until it breaks the previous swing high or low, and as a trend after that. Range, compression and choppy describe sideways markets with normal, unusually low and unusually high volatility.
- State age and early warning. The panel shows how many candles the current state has lasted. When price moves back against the current move, the panel shows in percent how much of the distance needed to turn the move has already been covered.
- What happened after similar moments. The indicator searches the chart history for earlier candles with the same state and the same age. For these cases it shows how many more candles the state lasted, which state followed, and how often price was higher or lower 5, 10 and 20 candles later. The number of cases is always shown, and figures appear only when enough cases exist.
- Higher timeframe filter. A second row shows the same figures only for the earlier cases in which the two higher timeframes pointed in the same direction as now. A summary line states whether one direction occurred clearly more often or whether there was no clear difference.
- Timeframe overview. The two lower and the two higher timeframes next to the chart timeframe are read automatically. The panel shows the direction of each one and a percentage for how much they agree with the chart.
- Buying and selling activity. Under the last closed candles the indicator shows the difference between buying and selling activity, marks the main activity level of each candle, and marks candles where a push to the high or to the low was rejected. Moving the mouse over a marked candle opens a breakdown of the activity inside that candle.
- Support and resistance. Price levels where one side was clearly rejected are drawn as bands with a label. Only levels close to the current price are shown.
- Audit mode. Click any past candle to see the panel exactly as it was when that candle closed. The chart then marks how price moved 5, 10 and 20 candles later, so you can compare the statistics with what really happened.
- Attach the indicator to a chart. H1 is a good timeframe to start with. No settings are required.
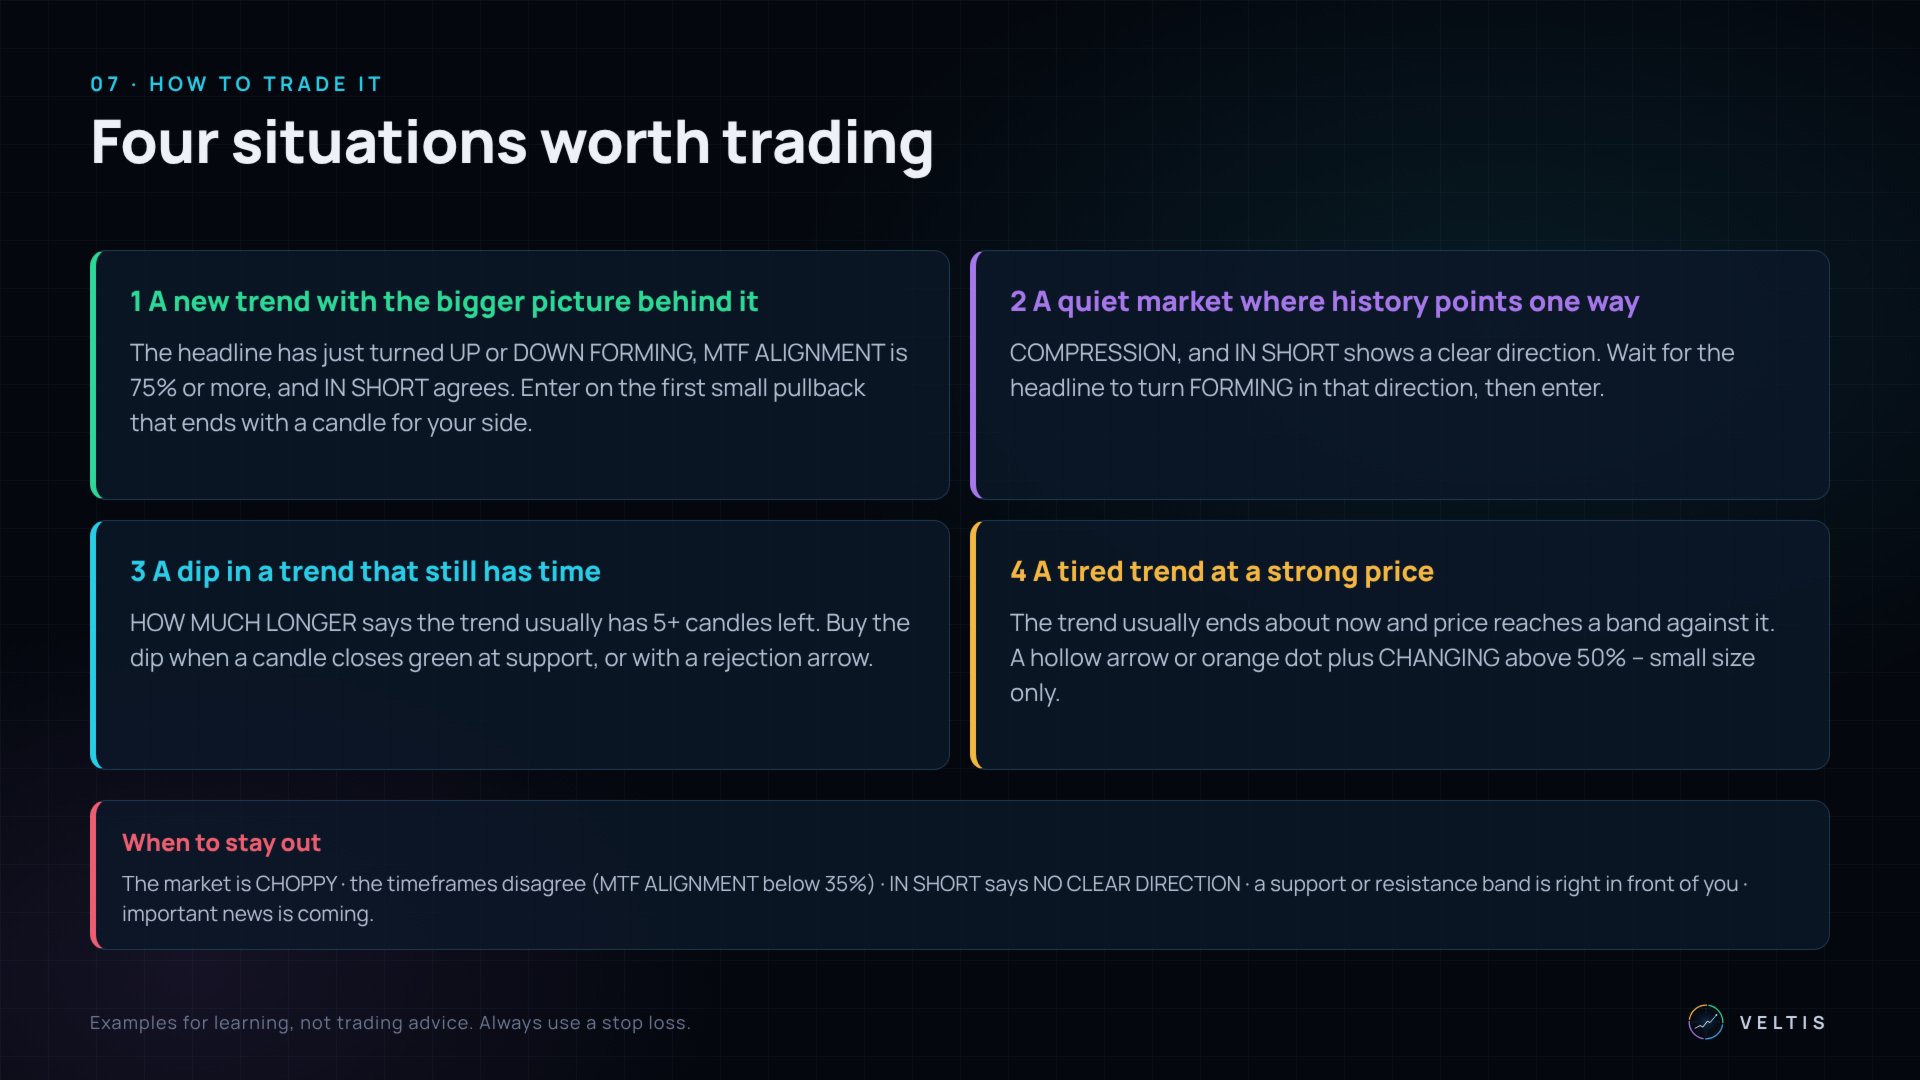
- Read the market state and its age.
- Check whether the other timeframes agree with the chart.
- Look at what happened after similar moments and at the summary line.
- Use the candle marks and the support and resistance levels for timing. Entry, stop loss and position size remain your own decision.
RegimeScope is intended for discretionary traders who want to check the market conditions before they use their own method, for example to avoid using a trend method in a sideways market. It works on all symbols and timeframes. On H1 and higher timeframes the statistics usually contain more cases than on very low timeframes.
Settings
- Market state: reaction speed (balanced or steady) and the number of candles used for the history.
- Timeframes: automatic selection of the two lower and two higher timeframes, or four timeframes of your choice.
- Chart: background colouring by state, candle marks and the number of marked candles, support and resistance with a maximum distance from price, font size.
- Panel: corner, position, size, opacity, start minimised.
- Alerts: pop-up, push notification or e-mail when the market state changes.
All calculations use closed candles only, and values shown for past candles do not change afterwards. The statistics describe the past behaviour of the chart and are not a forecast. Where a symbol has no real volume data, buying and selling activity is estimated from lower timeframe candles and tick volume, and the panel indicates this. Expert Advisors can read the market state and the main values through the indicator buffers. Trading involves risk.