Regime Scope MT5
- Indicateurs
-
Damir Ikinic
 🔷 VELTIS — SYSTÈMES PROFESSIONNELS DE TRADING ALGORITHMIQUE
- Version: 1.41
VELTIS - REGIMESCOPE
WHAT IS REGIMESCOPE?
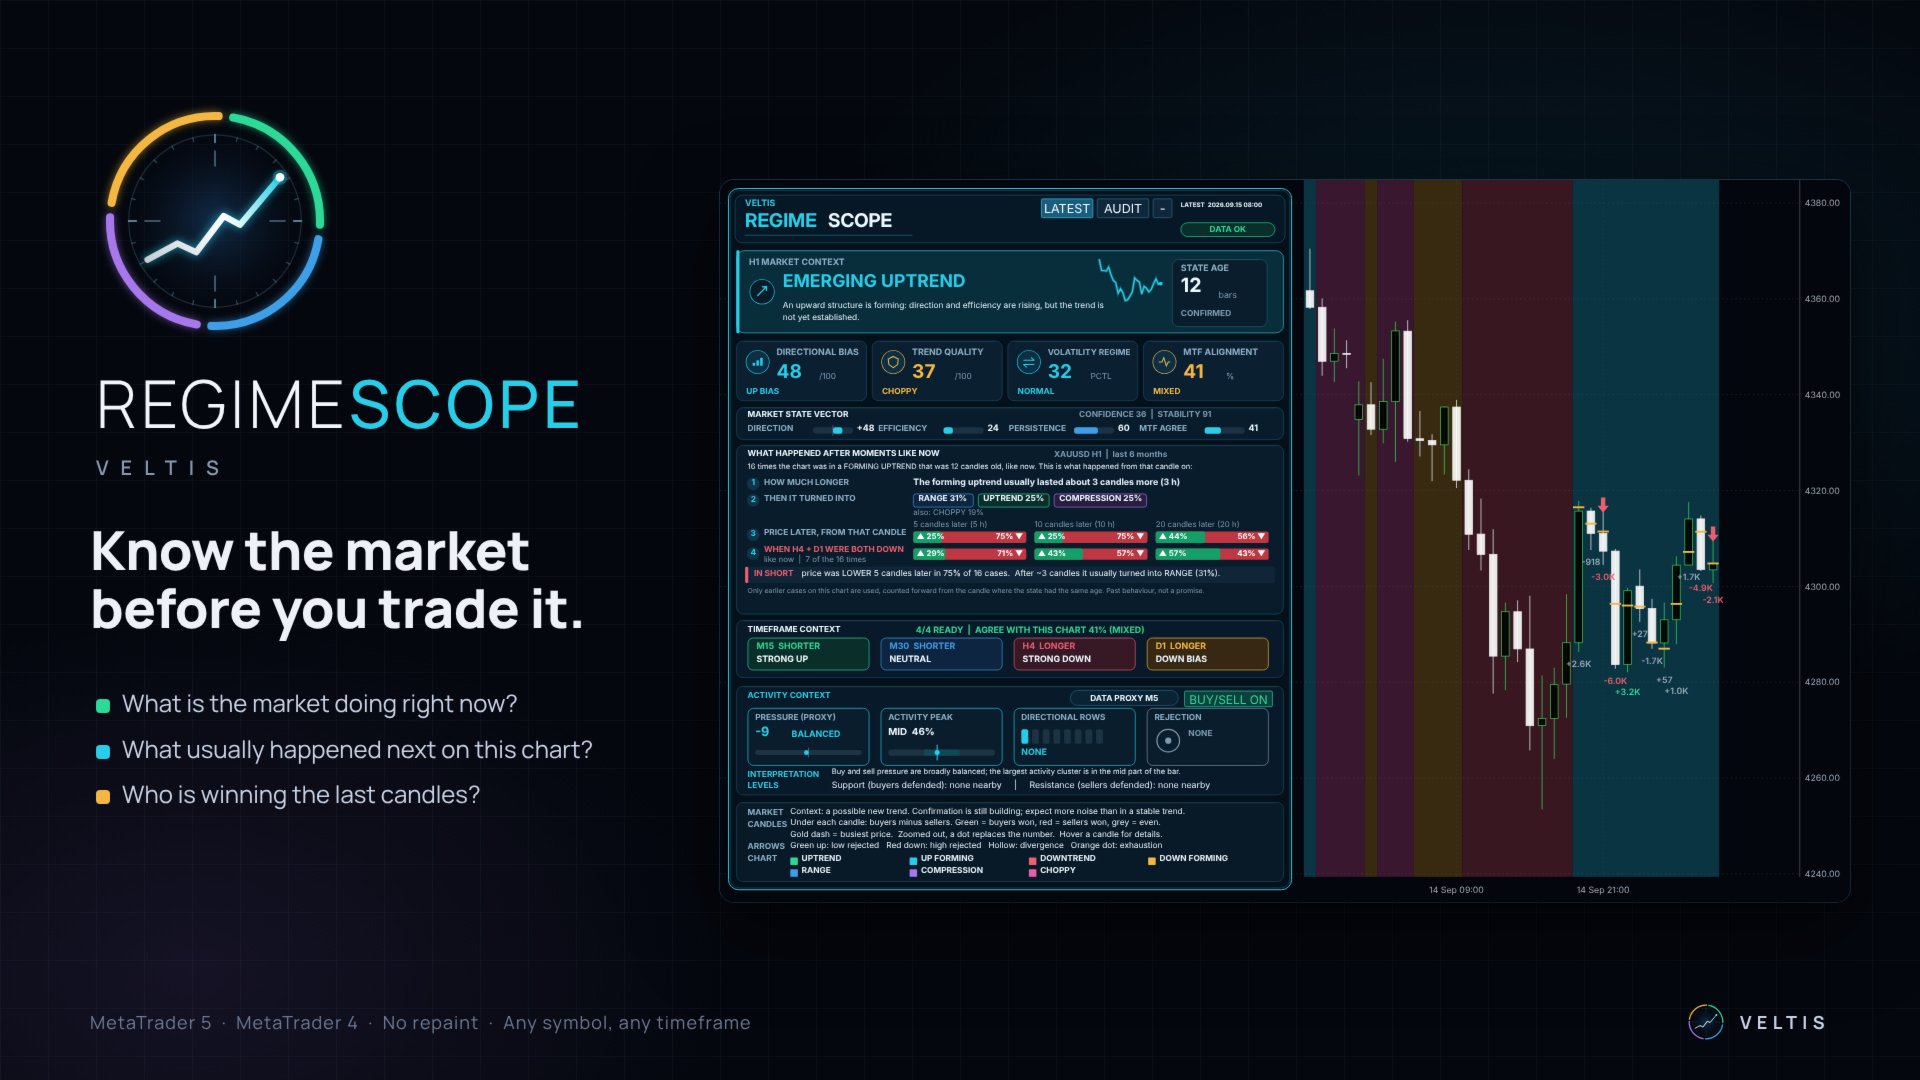
RegimeScope is a panel that sits on your chart and helps you decide whether a trade is a good idea - before you take it.
It does three things:
- It tells you what the market is doing right now - going up, going down, moving sideways, very quiet, or wild without direction.
- It shows you what usually happened next. It looks back at the history of your chart, finds every earlier moment that looked like now, and checks whether price went up or down afterwards.
- It shows you who is winning right now - buyers or sellers - on each of the last candles, and where buyers or sellers defended a price.
WHY THIS HELPS
Most traders don't lose because their strategy is bad. They lose because they use it in the wrong market. A strategy that follows trends loses money when the market is just moving sideways. A strategy that waits for breakouts loses when nothing is moving.
RegimeScope tells you which kind of market you are in, so you can use the right approach - or stay out.
GETTING STARTED
- Open the chart you want to trade. H1 (1 hour) is the best place to start.
- Drag VELTIS RegimeScope onto the chart. The panel opens in the top-left corner.
- The first time, wait a few seconds. The indicator loads the bigger and smaller timeframes in the background.
THE PANEL, FROM TOP TO BOTTOM
1. The top bar
- LATEST - the normal mode. The panel always shows the newest finished candle.
- AUDIT - a mode for checking the past. Press it, then click any old candle on the chart, and the panel shows what it said at that moment - and what really happened afterwards. More about this further below.
- The small - button - makes the panel small, so it covers less of your chart. Press + to make it big again.
- Date and time - which candle the panel is talking about.
- DATA OK - everything has loaded. If it says PARTIAL MTF or similar, some timeframes are still loading. The main information already works.
The big coloured headline is the most important part. It always shows one of seven market states:
- STABLE UPTREND (green) - price is going up and has broken above its last high. What to do: look for buys, ideally after a small dip. Don't try to sell the top.
- EMERGING UPTREND (light blue) - price has started to go up, but hasn't broken its last high yet. A new uptrend may be starting. What to do: a possible early buy, but expect more back-and-forth.
- STABLE DOWNTREND (red) - price is going down and has broken below its last low. What to do: look for sells, ideally after a small bounce. Don't try to catch the bottom.
- EMERGING DOWNTREND (orange) - price has started to go down, but hasn't broken its last low yet. What to do: a possible early sell, with care.
- BALANCED RANGE (blue) - price is moving sideways. Neither buyers nor sellers are winning. What to do: trend trades rarely work here. Wait, or trade only very carefully.
- COMPRESSION (purple) - the market is unusually quiet; the candles are much smaller than normal. What to do: get ready. A quiet market often ends with a big move - but the direction isn't decided yet.
- CHOPPY EXPANSION (pink) - big candles up and down, but price goes nowhere. What to do: the hardest market to trade. Best to stay out.
How does RegimeScope decide? It reads the chart the way an experienced trader does - from the highs and lows of the moves:
- A new move starts when price turns around by about 2 average candles from its last high or low. Smaller dips don't count.
- If the move breaks the last high (going up) or the last low (going down), it is a TREND. A move of 5 average candles or more also counts as a trend.
- If it hasn't broken it yet, it is FORMING.
- If price makes no new high or low for 12 candles, or neither side can break through while the moves stay small, the market is sideways. How busy it is decides the name: COMPRESSION when very quiet, CHOPPY when very wild, otherwise RANGE.
CONFIRMED or CHANGING (under STATE AGE) is your early warning:
- CONFIRMED - the current move is intact.
- CHANGING 70% TO DOWN FORMING - price has already come back 70% of the way needed to turn the move around. At 100% the headline changes. When you are in a trade and this number climbs, the move is in danger.
- DIRECTIONAL BIAS - how strongly price is pushing one way. STRONG UP or STRONG DOWN: a clear push. UP BIAS or DOWN BIAS: a small lean. NEUTRAL: no direction.
- TREND QUALITY - how clean the move is. MATURE: clean and steady. DEVELOPING: getting cleaner. MIXED or CHOPPY: lots of back-and-forth - harder to trade.
- VOLATILITY REGIME - how big the candles are compared with normal for this chart. COMPRESSION or QUIET: unusually calm. NORMAL. EXPANSION or HIGH EXPANSION: unusually busy - use a wider stop or a smaller position.
- MTF ALIGNMENT - do the other timeframes agree with your chart? ALIGNED (75% or more): yes, the bigger picture supports you. PARTIAL or MIXED: some do, some don't. DIVERGENT (below 35%): they point different ways - be careful.
These four bars show why the indicator chose the headline. You don't need them to trade, but they help you understand it:
- DIRECTION - which way the current move goes and how far it has come since it started. Plus means up, minus means down. Around 50: the move has just started. 90 or more: a big move.
- EFFICIENCY - how straight the move is. High means price went almost straight; low means lots of zig-zag.
- PERSISTENCE - how many candles of the move went in its direction. High means steady.
- MTF AGREE - the same as MTF ALIGNMENT.
- CONFIDENCE - how clearly the market fits the headline.
- STABILITY - how settled the state is. Low right after a change, higher the longer it lasts.
This is the heart of RegimeScope.
Imagine the market has been in an emerging uptrend for 5 candles. RegimeScope searches your chart's history for every earlier time the market had also been in an emerging uptrend for 5 candles. Then it checks what happened next each time.
At the top you read how many such moments it found, for example: "20 times the chart was in a FORMING UPTREND that was 5 candles old, like now." On H1 it looks back about 6 months.
Then come four rows:
Row 1 - HOW MUCH LONGER. How many more candles this state usually lasted. Example: "The forming uptrend usually lasted about 3 candles more." What it tells you: if only a few candles are usually left, a late entry is risky.
Row 2 - THEN IT TURNED INTO. What the market usually did next, for example "RANGE 30%, COMPRESSION 30%, CHOPPY 15%". The small line below lists the rest. All numbers together make 100%.
Row 3 - PRICE LATER. Three coloured bars: 5, 10 and 20 candles later. The green part shows how often price was higher than at that moment, the red part how often it was lower. Example: "▲ 40% ▼ 60%" means price was lower 6 out of 10 times.
Row 4 - WHEN H4 + D1 WERE BOTH DOWN (or BOTH UP, or DISAGREED). The same three bars, but only for the times when the bigger timeframes looked like they do right now. This row is very useful when your chart and the bigger timeframes point in different directions. The small line under it says how many cases that was.
IN SHORT - one sentence that sums everything up. Example: "With H4 + D1 down, price was LOWER 5 candles later in 62% of 8 cases. After ~3 candles it usually turned into RANGE."
- A green bar on the left means price usually went higher.
- A red bar means price usually went lower.
- Amber with "NO CLEAR DIRECTION" means up and down happened about equally often. Then the history doesn't help - don't rely on it.
- 58% or more in one direction counts as a real advantage. Between 42% and 58% it is close to a coin flip.
- More cases are more reliable. 65% from 50 cases means more than 65% from 8 cases. If there are too few cases, RegimeScope says "not enough cases yet" instead of showing a misleading number.
- 60% is not 100%. If price went lower 60 times out of 100, it went higher 40 times. That happens often. The numbers show you which side had the advantage - not what will happen this time.
- Only the history of the chart you are looking at is used - your symbol, your timeframe.
Four small boxes for the two smaller and two bigger timeframes around your chart. On an H1 chart these are M15, M30, H4 and D1. Each box says which way that timeframe is going: STRONG UP, UP BIAS, NEUTRAL, DOWN BIAS or STRONG DOWN. NOT READY means it is still loading.
The line above them says how much they agree with your chart, for example "AGREE WITH THIS CHART 75% (ALIGNED)".
What it tells you: trades in the direction of the bigger timeframes (the boxes marked LONGER) work more often than trades against them.
7. Activity context: who won the last candle?
- PRESSURE - buyers against sellers in the last finished candle, from -100 (only sellers) to +100 (only buyers). BUYING or SELLING: one side clearly won. BALANCED: about even.
- ACTIVITY PEAK - where in the candle most of the trading happened: near the top (UPPER), in the middle (MID) or near the bottom (LOWER).
- DIRECTIONAL ROWS - the candle is split into 12 price levels. This shows whether one side won several levels in a row. BULL x4: buyers won 4 levels in a row. NONE: no clear winner.
- REJECTION - did one side push to the edge of the candle and get pushed back? BULLISH: sellers pushed down and were rejected - good for buyers. BEARISH: buyers pushed up and were rejected - good for sellers.
- INTERPRETATION - all of this in one sentence.
- LEVELS - the nearest support (a price where buyers defended) and resistance (a price where sellers defended).
- DATA - where the numbers come from. Most forex and CFD brokers don't publish real trading volume, so buying and selling are estimated from smaller candles. Where real trade data exists, the panel says REAL TRADES.
- BUY/SELL ON / OFF - switches the numbers and arrows on the chart on or off.
- MARKET - what the current state means for your trading, in one sentence.
- CANDLES and ARROWS - a short key to the marks on the chart.
- CHART - the colour key, shown when you switch on the coloured chart background.
The candles themselves are never covered.
Numbers under the last 12 candles. Each number shows buyers minus sellers in that candle. Green: buyers won. Red: sellers won. Grey: about even. "K" means thousand, so -8.3K means sellers were 8,300 ahead. When you zoom far out, the numbers turn into small coloured dots.
Gold dash on a candle. The price where most trading happened in that candle.
Green arrow up, under a candle. Sellers pushed the price down hard, but the candle closed well above its low. Sellers were rejected - a good sign for buyers.
Red arrow down, above a candle. Buyers pushed the price up hard, but the candle closed well below its high. Buyers were rejected - a good sign for sellers.
Hollow arrow. A warning: price made a new low but buyers were stronger (hollow arrow up), or a new high but sellers were stronger (hollow arrow down). The move may be running out of energy.
Orange dot. A very busy candle where neither side won. This often appears near the end of a move.
Info card. Move your mouse over a marked candle and a card opens: how much buying and selling there was, who won, what any arrow means, and a small picture of where inside the candle the buying (green) and selling (red) happened.
Support and resistance lines. A red band with the text "Resistance ... - sellers defended here" marks a price where buyers pushed up and were pushed back. Expect sellers there again. A green band "Support ... - buyers defended here" marks a price where sellers were pushed back. Only levels close to the current price are shown, so the chart stays clean. Move your mouse over a band to see when it was created.
Coloured background (optional). In the settings you can switch on "Colour the chart background by state". Then every part of the chart is coloured by the market state at that time. It is off by default.
AUDIT MODE: CHECK IT YOURSELF
Want to know if you can trust RegimeScope? Check it on your own chart:
- Press AUDIT on the panel.
- Click any finished candle in the past.
- The panel now shows exactly what it said when that candle closed.
- On the chart you see AUDIT above that candle and the labels +5, +10 and +20 above the candles 5, 10 and 20 later - for example "+5 ▲ +$38.12". Green means price was higher than at your candle, red means lower.
- In the panel, the line THIS TIME shows how long the state still lasted and how far price moved. Under IN SHORT you see which side it turned out to be, for example "This time: HIGHER - the 40% case".
- Press LATEST to go back.
HOW TO TRADE WITH IT
RegimeScope tells you which situation you are in. Your entry and your stop loss come from the chart.
Which timeframe?
- H4 and D1 - for the big picture: which direction to trade.
- H1 - the main chart for your decisions.
- M15 and M5 - to fine-tune your entry in the direction of H1.
- Headline - what kind of market is it? Avoid CHOPPY.
- HOW MUCH LONGER - does the move usually still have some candles left?
- MTF ALIGNMENT - 75% or more is good. Below 35%, stay out.
- IN SHORT - green for a buy, red for a sell? Amber means no advantage.
- The last candles - are the numbers and arrows showing your side winning? Is a support or resistance line in the way?
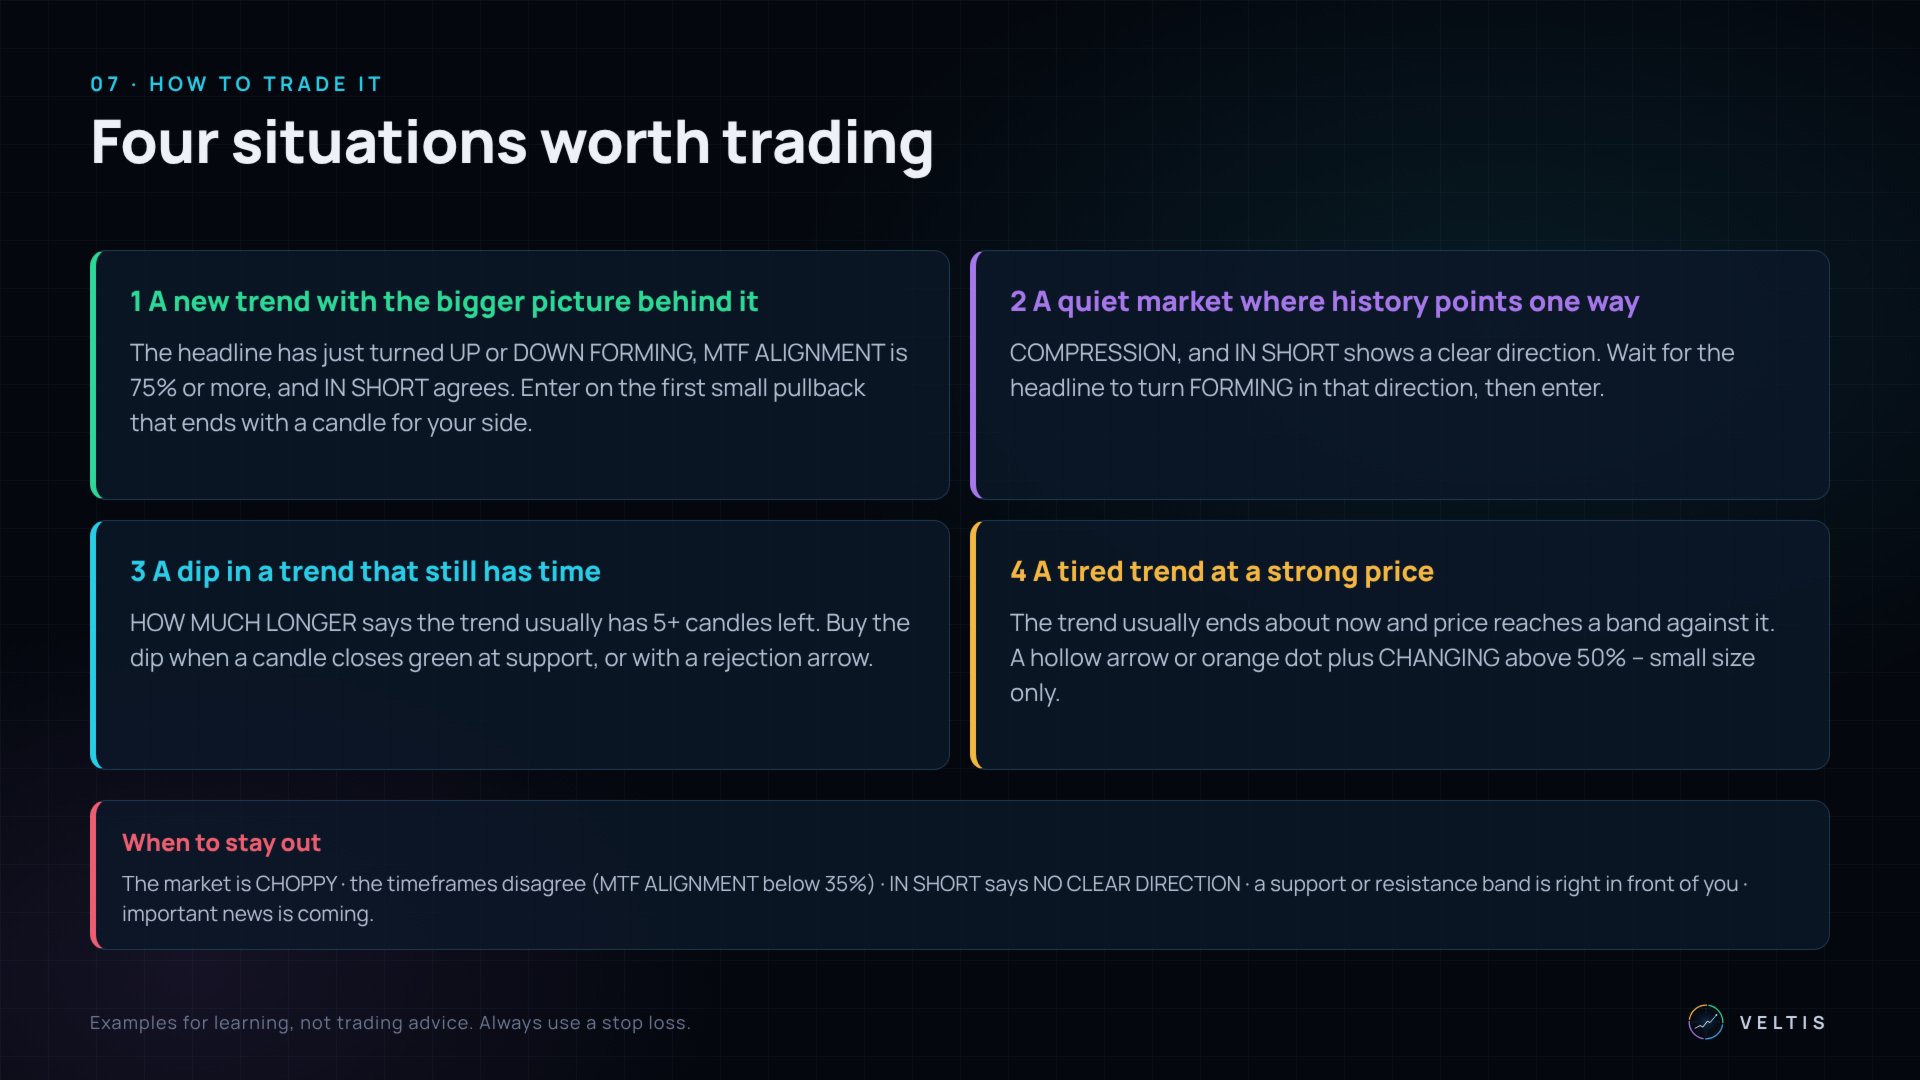
When: the headline has just changed to EMERGING UPTREND or EMERGING DOWNTREND, MTF ALIGNMENT is 75% or more, and IN SHORT points the same way.
Entry: wait for a small move against the trend (1 to 3 candles). Enter when a candle closes with a number for your side - green for a buy, red for a sell.
Stop loss: beyond the end of that small counter-move.
Exit: when CHANGING climbs above about 70% against you, or the headline turns sideways.
Example: gold H1. The headline changes from RANGE to EMERGING DOWNTREND after two big red candles. H4 and D1 are down, MTF ALIGNMENT is 80%, IN SHORT says LOWER. Two small candles bounce up, then a candle closes with a red number and a red arrow. Sell at the close, stop above the bounce.
Setup 2 - A quiet market where history points one way
When: the headline is COMPRESSION and IN SHORT shows a clear direction (60% or more).
Entry: wait until the headline changes to EMERGING UPTREND or EMERGING DOWNTREND in that direction, then enter.
Stop loss: back inside the quiet area.
Skip it if the market breaks out the other way.
Setup 3 - A dip in a trend that still has time
When: STABLE UPTREND or STABLE DOWNTREND, HOW MUCH LONGER says at least 5 more candles, MTF ALIGNMENT 60% or more.
Entry: after a few candles against the trend, enter when a candle closes with a number for the trend side - ideally at a support line (buy) or resistance line (sell), or with a rejection arrow.
Stop loss: beyond the end of the dip.
Setup 4 - A tired trend at a strong price (for experienced traders)
When: HOW MUCH LONGER says the trend usually ends about now, and price reaches a support or resistance line against the trend.
Entry: after a hollow arrow, a rejection arrow or an orange dot, when CHANGING climbs above 50%. Use a small position - this trade goes against the trend.
When to stay out
- The market is CHOPPY.
- MTF ALIGNMENT is below 35%.
- IN SHORT says NO CLEAR DIRECTION, or there are not enough cases.
- A support or resistance line is right in front of your trade.
- Important news is coming.
Switch on "Alert when the confirmed state changes" in the settings and choose a pop-up, a push notification to your phone, or an e-mail. You get one message each time the market state changes.
SETTINGS
Everything works with the default settings. If you want to change something:
- Reaction speed - Balanced: a move counts as turned after about 2 average candles. Steady: after about 3 - fewer changes, but later.
- History used, in candles - how far back the indicator looks (3,000 candles). More history means more past examples.
- Timeframes - automatic (the two smaller and two bigger timeframes) or your own choice.
- Chart - the coloured background, the numbers and arrows under the candles, the support and resistance lines, and the font size.
- Panel - corner, position, size, transparency, and whether it starts small.
- Alerts - pop-up, phone or e-mail.
- It does not repaint. It only uses finished candles. What it showed for a finished candle never changes - you can check this with AUDIT.
- It is honest. When there is no clear answer, it says so instead of guessing.
- It works on everything: forex, gold, silver, indices, oil, crypto, stocks - on every timeframe. It works best on H1 and higher.
- No extra files. No DLLs, no internet connection, nothing else to install.
- For EA builders: an Expert Advisor can read the market state and the other values with iCustom. The user manual lists them.
- MetaTrader 5, any broker
- Any symbol and any timeframe
RegimeScope shows what the market is doing and what happened on your chart in the past. It does not predict the future and does not place trades. The setups are examples, not trading advice. Test everything on a demo account first and always use a stop loss.