A Event Radar

Advanced Event Radar:

  • Designed by an experienced trader and web performance engineer.
  • Developed and built with performance, speed and optimization in mind.
  • Uses unique clean outline of events, even when there are multiple events.
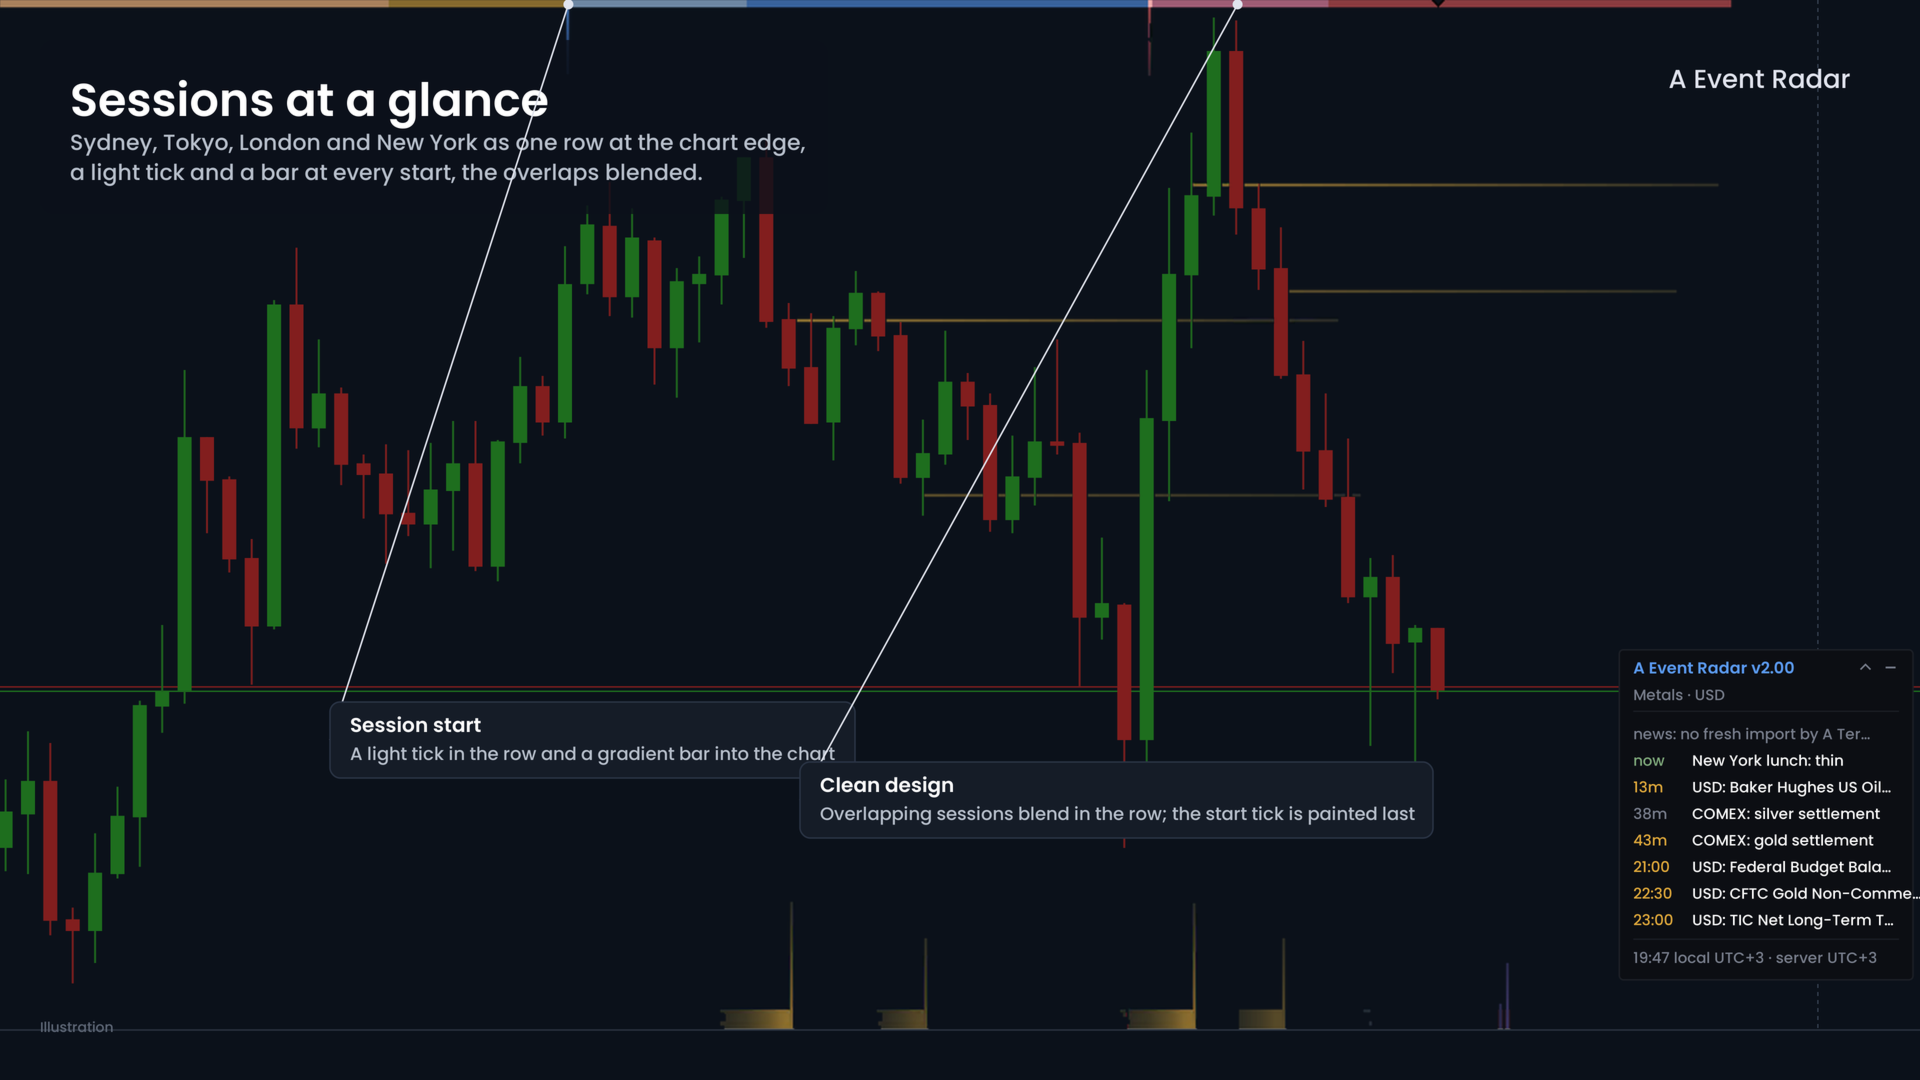
  • Displays an overlapping, semi-transparent, minimalist row of sessions.
  • Shows minimalist yet configurable bands of scheduled market events.
  • Covers fixes, settlements, sessions, data, central banks and inventories.
  • Reads your terminal's economic calendar and your own list of events.
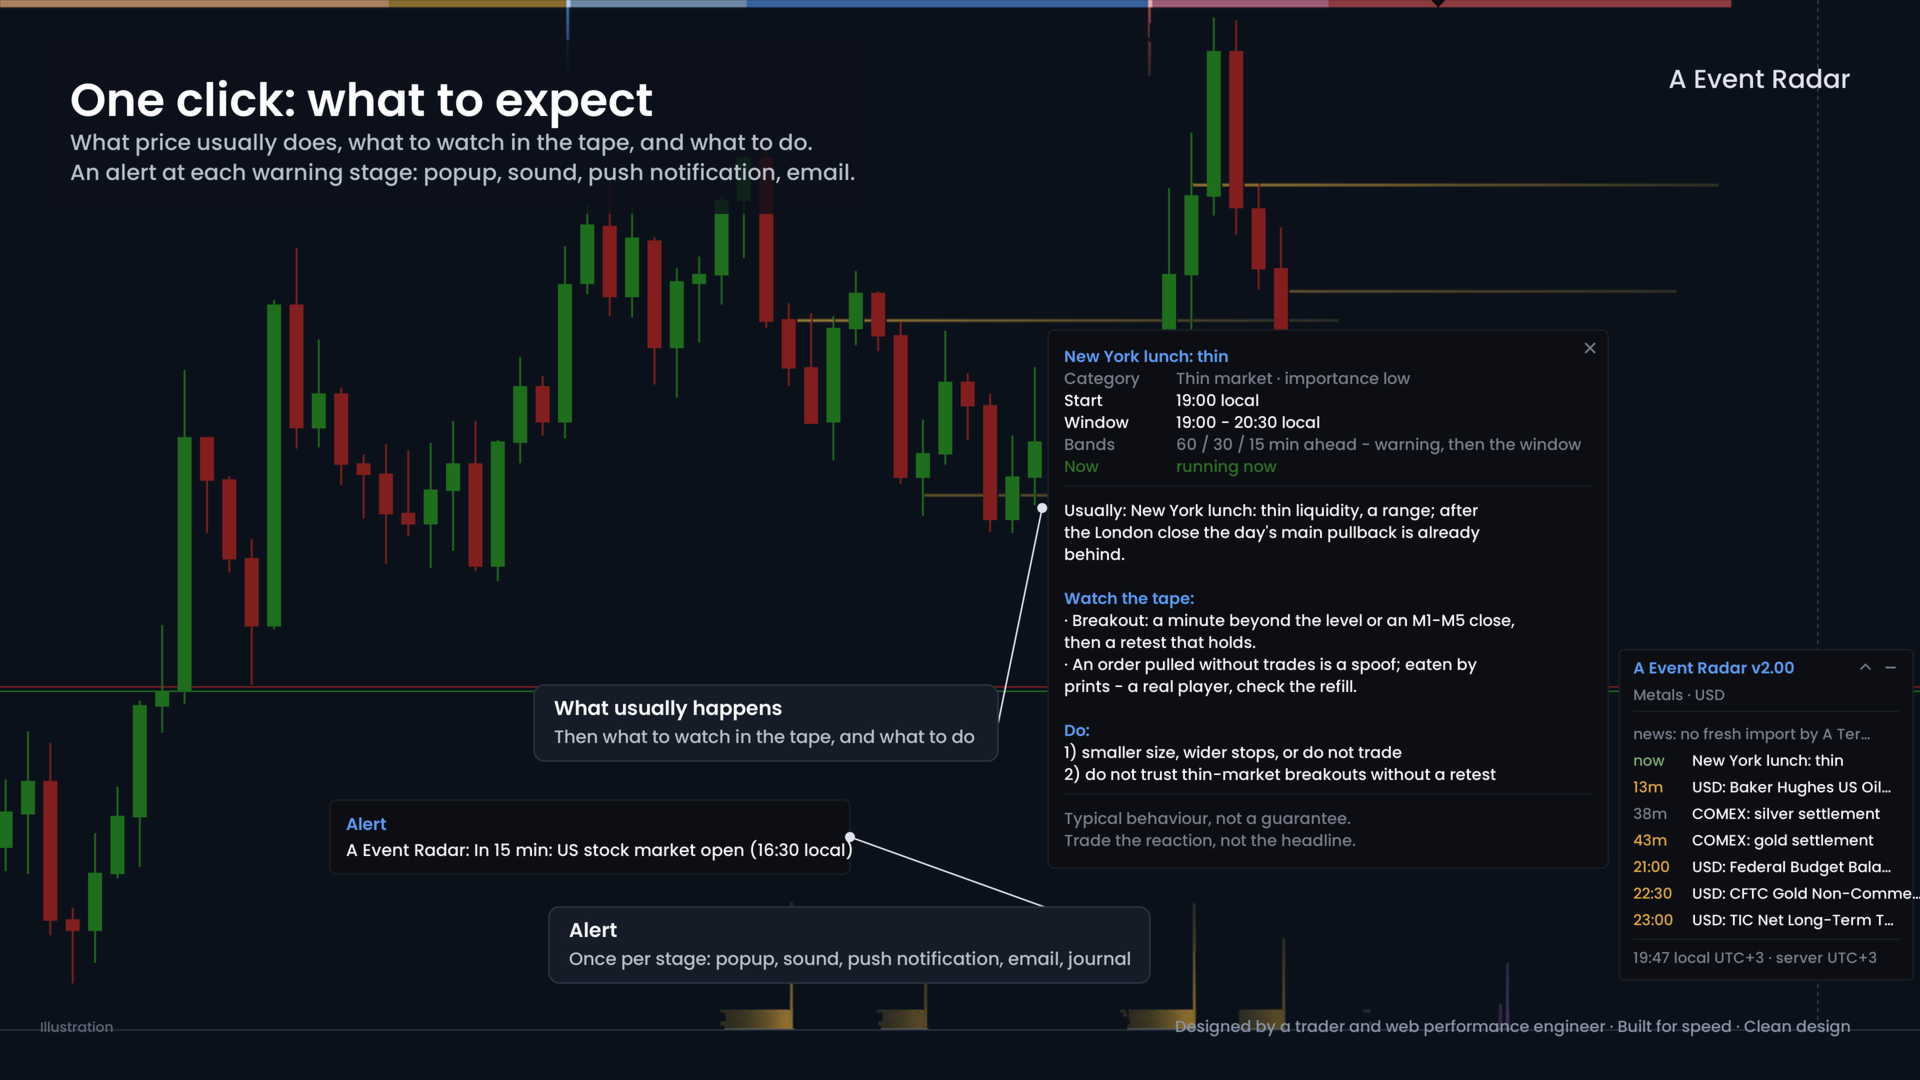
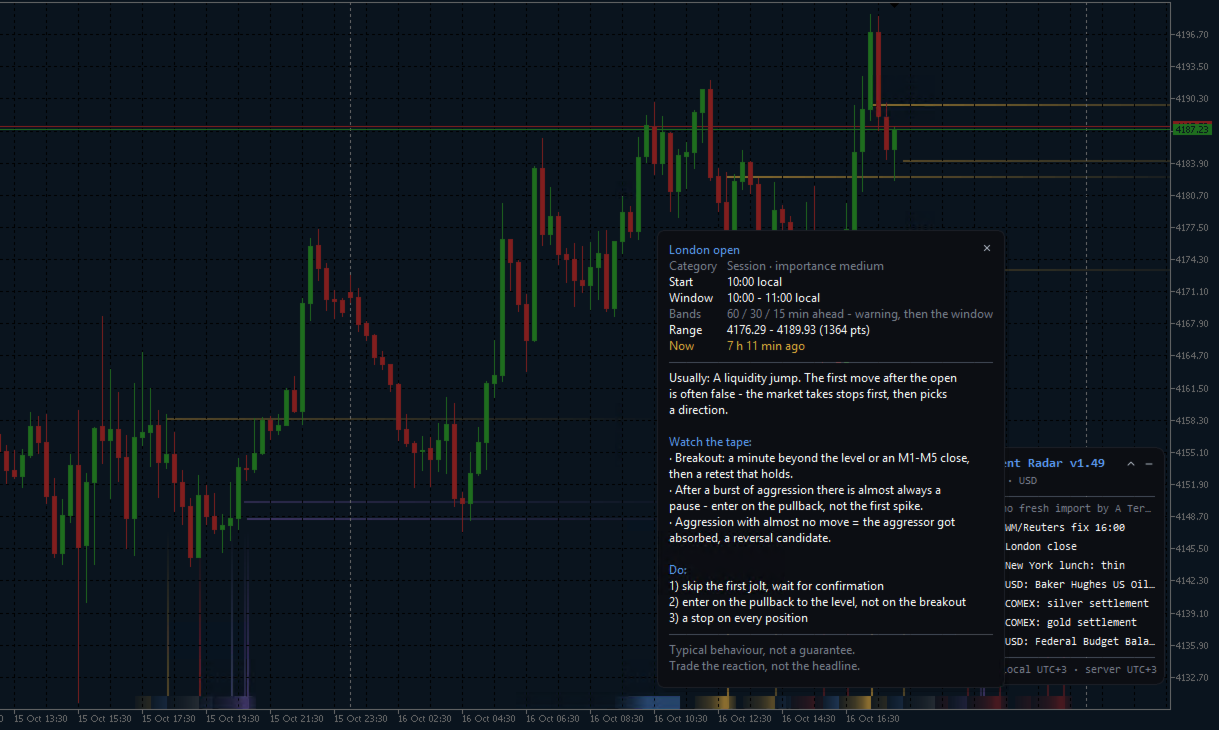
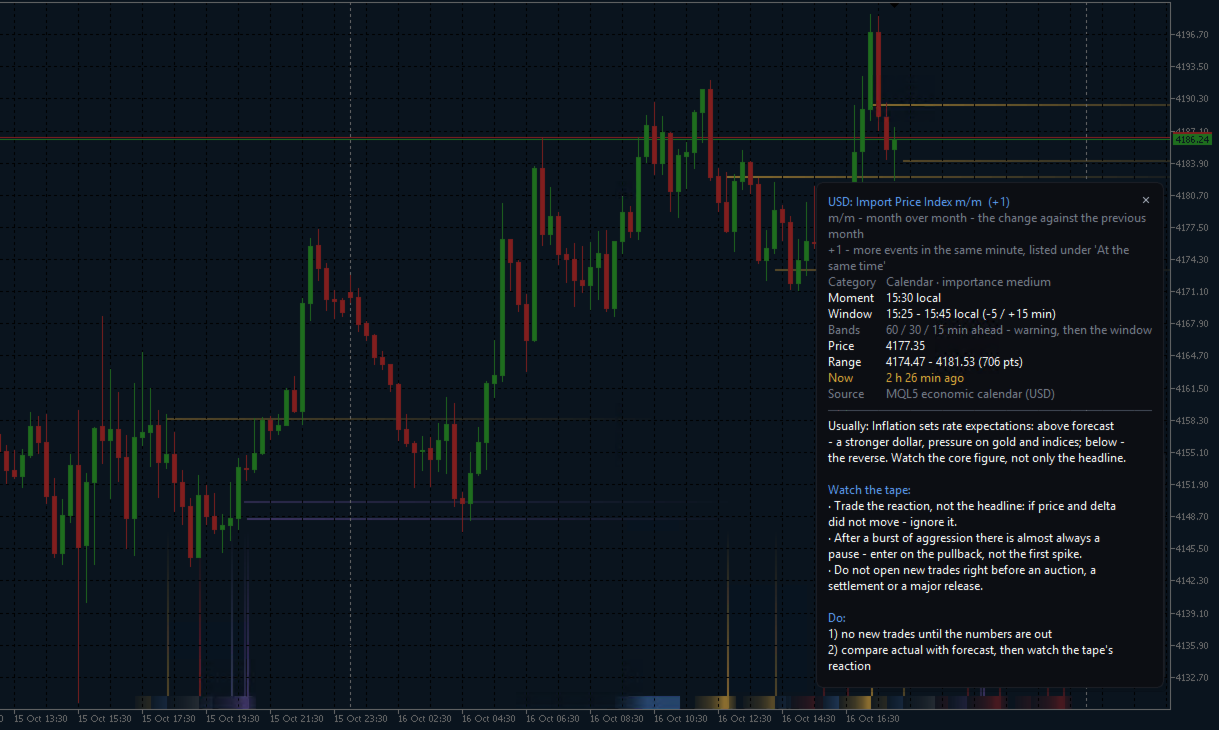
  • Opens a card on click with what price usually does and what to watch for.
  • Keeps every time in your own time zone, with daylight saving handled per event.
  • Alerts you at each warning stage and at the start, by popup, sound or email.


The situation

You are in a trade on gold at ten to five, London time. The afternoon fix is minutes away, and the quiet market you entered is about to change. You did not have the fixing time in mind, and the calendar you keep open shows news releases, not fixes.

The same happens with the settlement on crude oil, the stock market open, the funding time on a perpetual contract, and the week when Europe and the United States change their clocks on different Sundays. These moments are known in advance, but they are spread over many sources and many time zones.


The idea

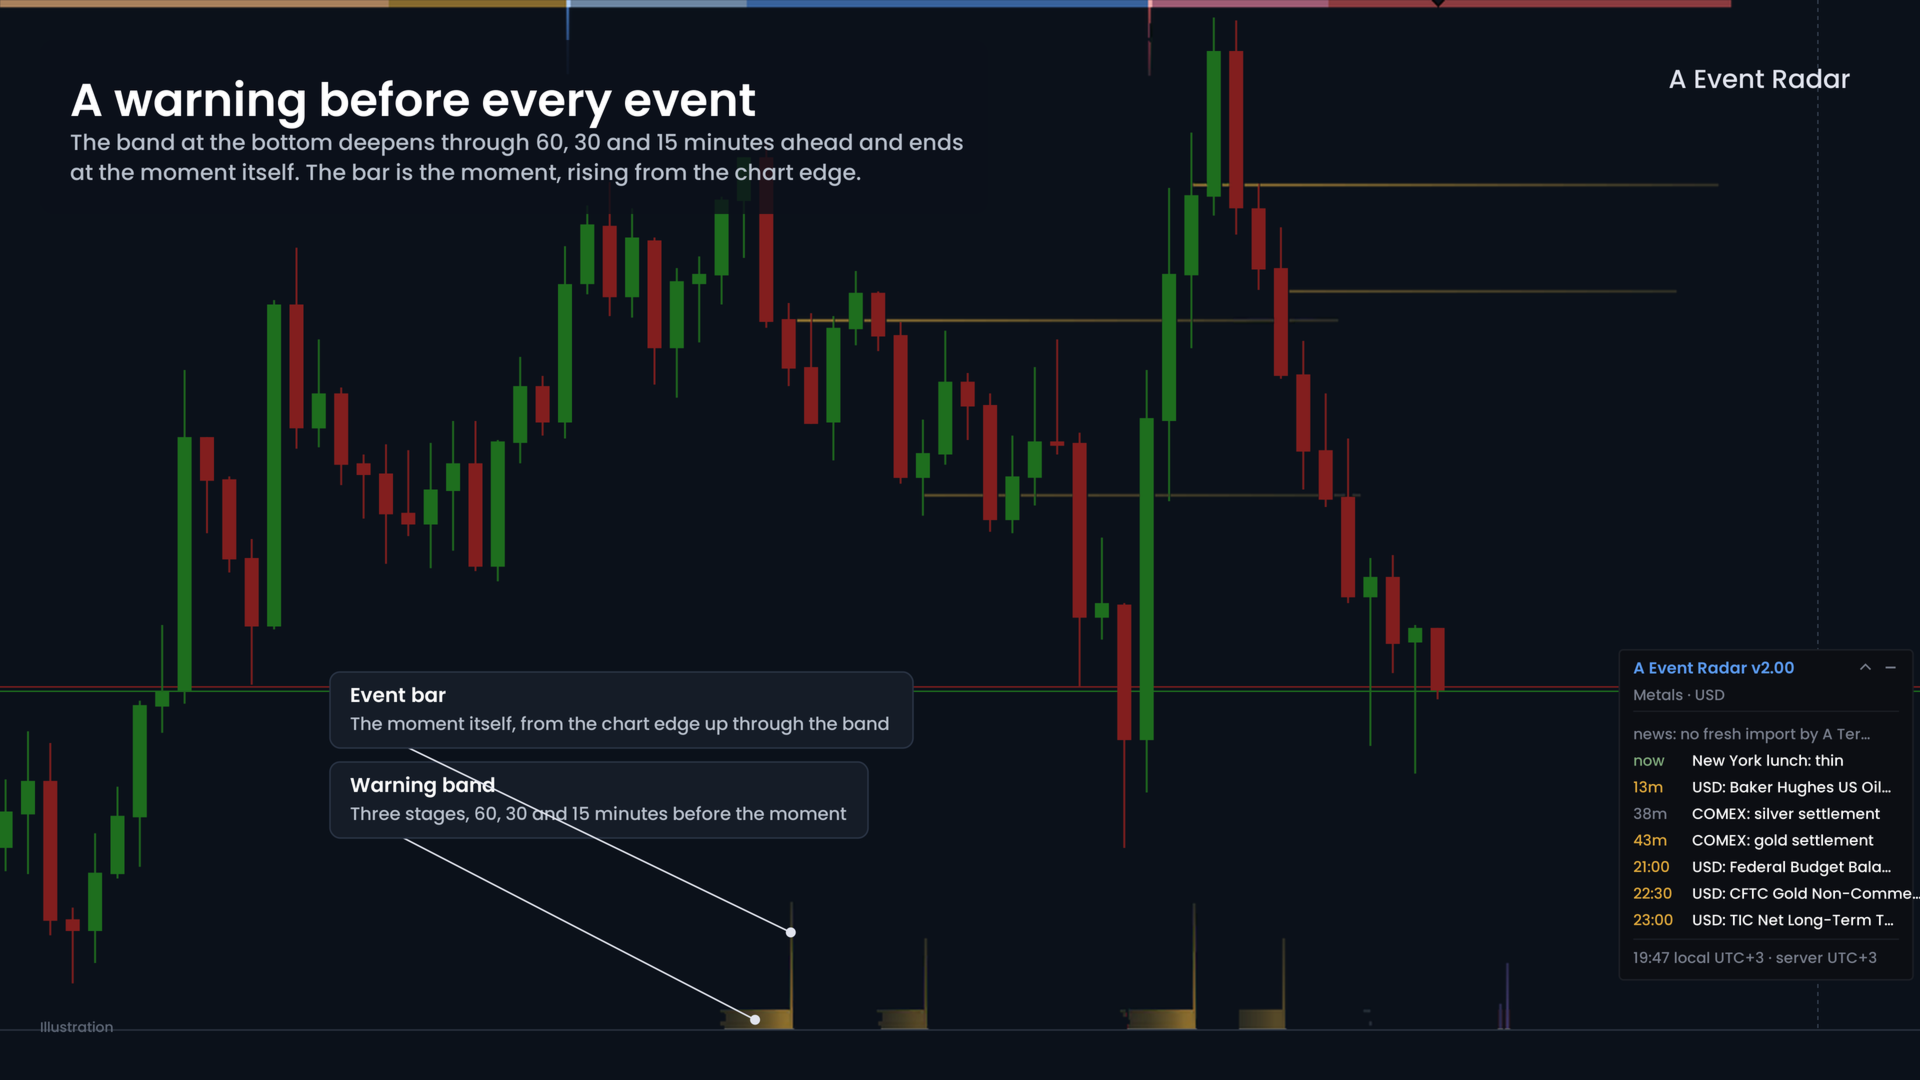
Put the whole schedule on the chart itself, in your own time, and warn before each moment rather than at it. A band that deepens as the event comes closer tells you at a glance how much time you have. A click tells you what that event usually does to price.


What Advanced Event Radar does

Warning bands and event lines

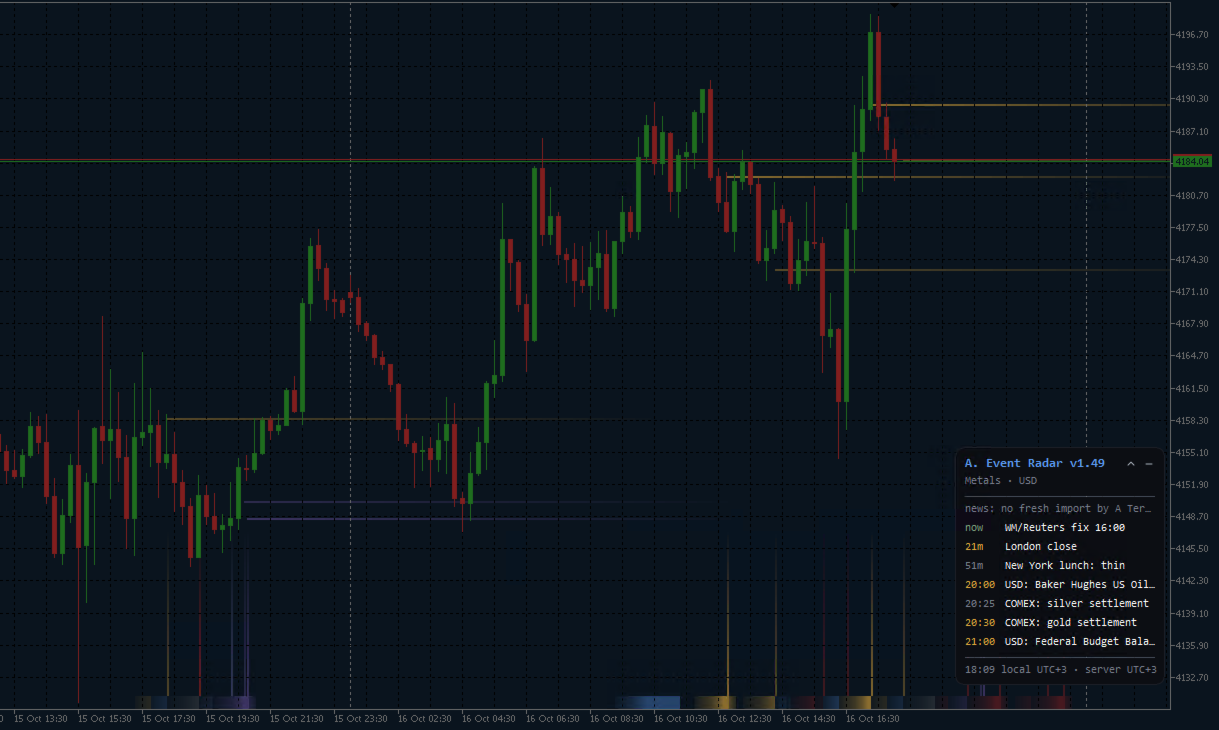
Before each event a band climbs through three stages, by default sixty, thirty and fifteen minutes ahead, into the event window. You choose where the band sits: a strip at the top or bottom of the chart, or full-height vertical bands behind the candles. Each point event also gets a line, either a short gradient bar from the chart edge or a full-height line.


A schedule that fits the chart

The indicator detects the symbol class from its name and shows only the events that matter for it. A gold chart gets the London gold and silver fixes and the COMEX session and settlement. An oil chart gets the weekly inventory reports and the NYMEX and Brent settlements. A currency pair gets the central banks of its two currencies and the London and New York fixes. An index gets the cash session open and close. A crypto chart gets the funding times and the weekend window. You can set the class by hand.


The economic calendar and your own events

The terminal's economic calendar is read for the chart's currencies, with forecast, previous and actual values on the card. You can add your own events in the settings or in a text file, with a time zone, weekdays, a window length and a note of your own.


The card

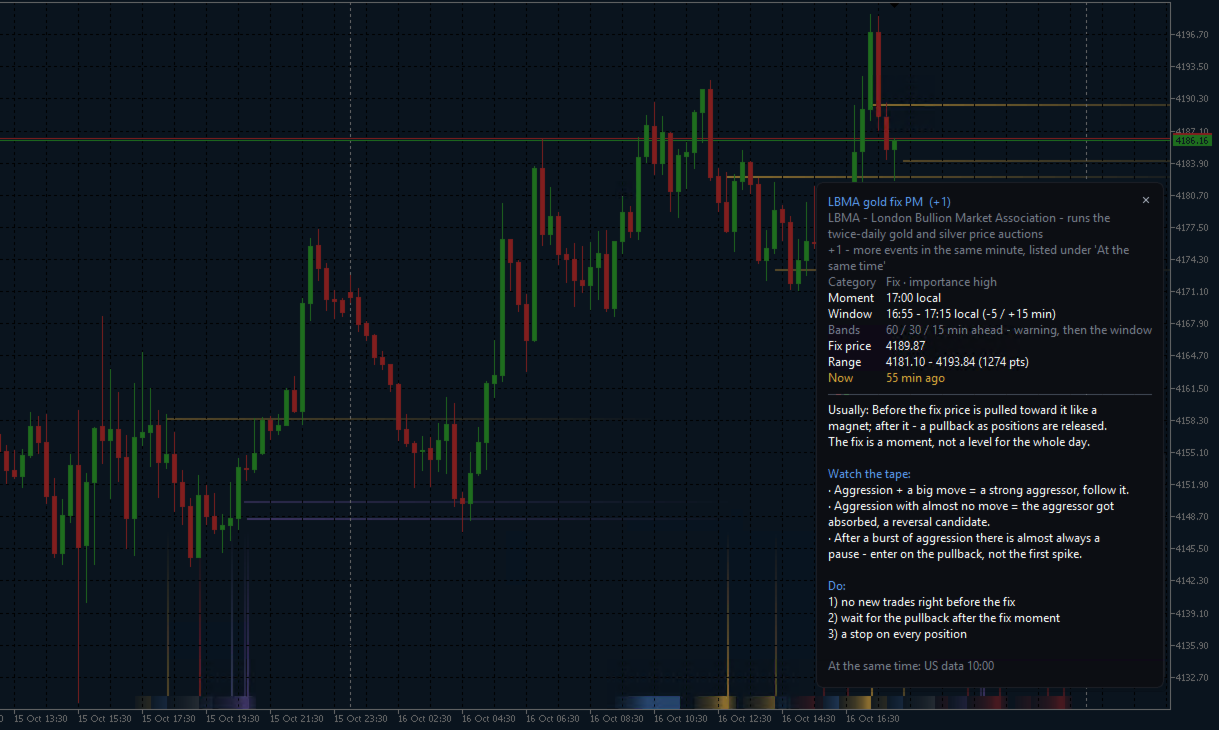
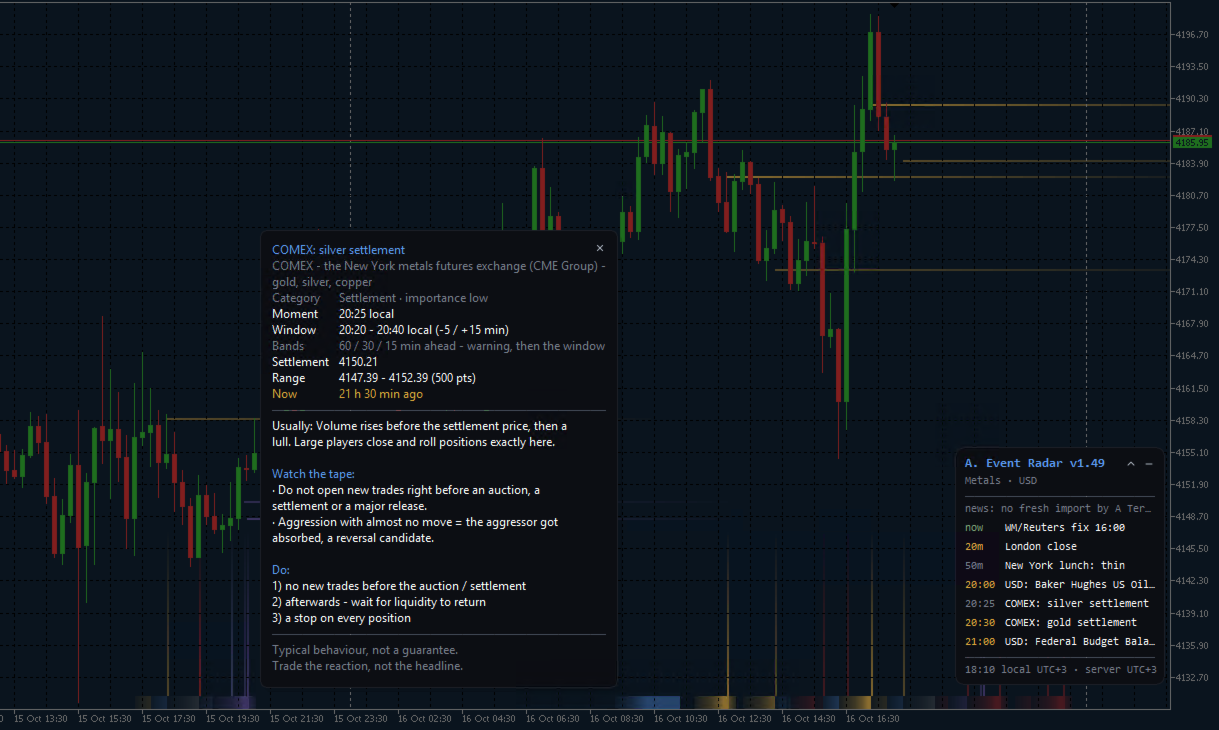
Click a band, a line or a panel row and a card opens: the category and importance, the moment and the window, how long until it starts, and for a past fix or settlement the price of that minute and the range of the window. Below that, three short sections: what usually happens around this event, what to watch for in the order flow, and what to do. Abbreviations in event names are spelled out on the card.


The panel

A small panel in a corner of your choice lists the next events with a countdown, your local time and the broker's server offset. Click its title to fold it.


Time handled per event

Every time on the chart is shown in your computer's time zone. The broker's server offset is measured, not typed in. Each event is defined in its own zone and converted for its own date, so the weeks when Europe and the United States are on different clocks come out right.


Alerts

One alert per warning stage and one at the start of the event, each fired once: popup, sound, push notification, email or journal line, as you choose. You can limit alerts to medium or high importance. The alert text names the event and its time in your zone.


Six languages

The texts on the chart, the card and the panel are available in English, Russian, Ukrainian, German, Spanish and French. English is the default.


A signal for your Expert Advisor

If you write your own Expert Advisors, the indicator can publish its state in terminal global variables: whether a warning stage or an event window is running, the importance of that event, and the minutes to the next one.


How to start

  1. Attach Advanced Event Radar to any chart. The symbol class is detected and the schedule is drawn.
  2. In the inputs, choose where the bands sit, the panel corner and your language.
  3. Turn on the alerts you want and set the warning stages to your own minutes.

From then on, every scheduled moment that can move your symbol is on the chart before it happens.
おすすめのプロダクト
Relative Volume RVOL
Alberto Gauer Borrego
4.75 (4)
Relative Volume or RVOL   is an indicator that averages the volume of X amount of days, making it easy to compare sessions volumes. The histogram only has 3 colors: Green - Above average volume Yellow - Average volume Red - Below average volume The default setting is 20 days, which corresponds more or less to a month of trading. In this version is possible to choose between tick and real volumes (if you are using a broker which offers future contracts) With the data obtained from this in
FREE
LIVE TRADES CHARTS – MQL5 INDICATOR DESCRIPTION Live Trades Charts is a MetaTrader 5 indicator that displays active trading positions directly on the chart. The indicator reads open trades and shows basic trade and account information in real time. It updates on every tick. FUNCTIONS Displays open trades on chart Per trade information: Symbol Lot size Direction (Buy or Sell) Floating profit or loss Trade duration Account information: Total floating profit/loss Number of open trades Balanc
FREE
Session Sync MT5
Mohammadreza Faghanimakrani
Session Sync MT5 displays the Tokyo, London, New York and Sydney trading sessions directly on your chart. Each session uses its own regional daylight-saving rules and is converted to your broker's server time. The active broker time model is shown on the chart, so you can see exactly what the indicator is using. What you get • Tokyo, London, New York and Sydney session boxes • Session High/Low calculated from M1 data, independent of chart timeframe • Historical sessions loaded automatically
FREE
This simple indicator paints with a darker color on the volume bar when the quantity traded is above the average of select number of periods of the volume itself, highlighting the moments when there was a large volume of deals above the average. It is also possible to use a configuration of four colors where the color tone shows a candle volume strength. The indicator defaults to the simple average of 20 periods, but it is possible to change to other types of averages and periods. If you like t
FREE
Theme Switcher
Andres Felipe Carvajal Rodriguez
テーマスイッチャー - 取引ターミナルをカスタマイズ 概要 テーマスイッチャー は、MetaTrader 5 のチャートの配色を素早く変更できるインタラクティブなパネルです。快適でパーソナライズされた視覚環境を求めるトレーダーのために設計されたこのインジケーターは、ブランド、映画、プロフェッショナルなデザインにインスパイアされた様々なテーマスタイルを提供します。 使用方法 パネルを開く : インジケーターをチャートに追加するだけで、異なるテーマのボタンが表示されたウィンドウが現れます。 テーマを選択 : 利用可能なスタイルをクリックすると、チャートが瞬時に変更されます。 閉じて完了 : 好みのテーマを選択したら、 X をクリックしてパネルを閉じ、快適で自分のスタイルに合った視覚環境でテクニカル分析を続けます。 利用可能なスタイル AMD : ゲーマーやテクノロジーの美学にインスパイアされた、鮮やかなコントラスト。 Batman (バットマン) : ダークでエレガントなデザインで、豪華さと洗練された雰囲気が漂います。 Bloomberg Dark (ブルームバーグダーク) : プロのトレ
FREE
TraderStart Structure Break Alerts Track recent market structure breaks across multiple timeframes in one clean on-chart panel. TraderStart Structure Break Alerts is a free MetaTrader 5 indicator that helps you monitor the latest market structure break on up to three configurable timeframes. It reports the most recent BOS (Break of Structure) or CHoCH (Change of Character), shows the break level, how many bars ago it occurred, and summarises the current structure bias and alignment. The indi
FREE
The "Power of Three" (PO3) is a concept developed by the Inner Circle Trader (ICT) to illustrate a three-stage approach used by smart money in the markets:   Accumulation, Manipulation, and Distribution . ICT traders view this as a foundational pattern that can explain the formation of any candle on a price chart. In simple terms, this concept is effective for any time frame, as long as there's a defined start, highest point, lowest point, and end. MT4 -  https://www.mql5.com/en/market/product/1
FREE
Gina Dual TPO — Brief MQL5 indicator TPO + Volume profile overlaid on chart — fast, scalable, and beginner-friendly. Built for traders who read market structure by POC and Value Area. What it is An MQL5 indicator that overlays dual market profiles—Time-at-Price (TPO) and Volume-at-Price (VPO)—directly on your chart. It’s fast (pixel-based drawing), scalable, and beginner-friendly. Who it’s for Intraday and swing traders who read market structure via POC (Point of Control) and Value Area to spot
FREE
The Hammer and Doji Scanner is a powerful technical analysis tool designed for MetaTrader platforms, such as MetaTrader 4 (MT4) and MetaTrader 5 (MT5), to detect and highlight key candlestick patterns, specifically the Hammer and Doji . These patterns are widely used by traders to identify potential trend reversals or periods of indecision in the market. Hammer: The Hammer is a bullish reversal candlestick pattern that appears after a downtrend. It is characterized by a small body near the top o
FREE
Helper utility that does the following important actions: Shows or hides various groups of symbols - Forex, CFD, Futurex, Bonds and all others. Shows or hides symbols that have or do not have trade restrictions. Shows or hides symbols that currently have a trading/quoting session active. Shows or hides symbols that contain the specified words in their names. Closes or deleted all market or pending orders. Closes orders by type - Buy/Sell. Clears stop loss and take profit values. Downloads histor
FREE
TimeFrameLow milliseconds
Israel Goncalves Moraes De Souza
O indicador mostra o preço ou volume em milissegundos, ótimo para identificar padrões de entrada por agressão de preço ou volume e escalpelamento rápido. Características Período de tempo do WPR em milissegundos Oscilador de agressão de preço Tela personalizável O indicador pode indicar movimentos de entrada, como: Cruzamento da linha 0.0 Identificando padrões de onda A velocidade de exibição do gráfico dependerá do seu hardware, quanto menores os milissegundos, mais serão necessários do hardwar
FREE
Neon Profile
Manuel Fernandez Barranco
XBK Neon Profile MT5 Developed by XBK Systems. XBK Neon Profile is an advanced technical indicator for MetaTrader 5 that combines smoothed trend analysis and a dynamic volume profile within a single chart window. The indicator is designed to provide a clear view of market structure and significant volume levels without cluttering the screen. Key Features Smoothed Trend Bands (Neon Trend Bands) Identifies the current trend direction using a custom smoothing algorithm designed to filter out market
FREE
This indicator uses a different approach from the previous version to get it's trendlines. This method is derived from Orchard Forex, and the process of making the indicator is demonstrated in there video   https://www.youtube.com/watch?v=mEaiurw56wY&t=1425s . The basic idea behind this indicator is it draws a   tangent line   on the highest levels and lowest levels of the bars used for calculation, while ensuring that the lines don't intersect with the bars in review (alittle confusing? I know
FREE
概要 MetaTrader 5専用に設計された、超軽量・高性能なボリュームディストリビューションインジケーター「Anchored Volume Profile」で、プロフェッショナルなオーダーフロー分析を体験してください。生のメモリキャンバス(Canvas)メカニズムを使用してゼロから構築されたこのインジケーターは、標準的な長方形オブジェクト型プロファイルで頻繁に発生する大幅なCPUラグ、UIのちらつき、チャートのフリーズを完全に排除します。 ターミナル固有のティックボリュームを方向性マトリックスに処理することにより、市場のオークション構造を視覚的に美しく、ピクセルパーフェクトなレイアウトで提供し、大口投資家(インスティテューショナル)のサポート、レジスタンス、主要な流動性プールを絶対的な精度でピンポイントに特定できます。 主なプロフェッショナル機能: キャンバスエンジン(Canvas Engine): プロファイル配列全体をフラットなスクリーンスペースのメモリビットマップに直接描画します。新しいティックが発生すると、シングルスレッドサイクル内でレイアウトが瞬時に更新され、画面の遅
FREE
SETTINGS Make sure to select Chart shift option in the chart.   (Right click in the chart ---> Properties (dialog box) ----> Select Chart Shift) Kindly rate and comment about the product for upgradation & Support When using candlestick timers, keep in mind that the timing of candlestick patterns can play a crucial role in your trading strategy. For instance, different timeframes (such as 1-minute, 5-minute, hourly, ) can provide varying insights into price movements and trends. Make sure to i
FREE
Plus FlowProfile
Leonel Alberto Jose Quintana
Plus FlowProfile — MT5 用 BUY / SELL 方向別ゾーン Plus FlowProfile は、従来のプロファイル分析を拡張し、買いと売りの方向別ステージに分けて分析します。 単独で使用する場合、コンパクトな FLOW BUY / FLOW SELL ボタンによって、下側の買いプロファイルと上側の売りプロファイルを素早く切り替えることができます。Indicator Center または EA Assistant と統合した場合、状態はシステムのコントロールから直接管理されます。 主な特徴: BUY および SELL の方向別モード; 単独使用時の切り替えボタン; 自動または手動で設定可能な上位時間足によるオプション分析; 方向別 POC; HVN および LVN ゾーン; 重要な領域をインテリジェントに強調表示; Flow Score、信頼度、品質、リージョン DNA を設定可能; 視覚的なエントリーゾーン; 買いと売りで独立したカラー設定; リアルチャートおよびストラテジーテスターのビジュアルモードに対応; Indicator Center および EA
FREE
Quantora Fair Value Gap Pro MT5 is a MetaTrader 5 indicator that detects bullish and bearish Fair Value Gap zones created by price imbalances. Detected zones are displayed on the chart and can be extended until the selected mitigation condition is met. The indicator tracks active, mitigated and fully filled zones according to its input settings. Fair Value Gap Detection Bullish and bearish Fair Value Gap detection Active, mitigated and fully filled zone tracking First Touch and Full Fill mitigat
FREE
The Advanced Pivot Point Indicator is a powerful tool designed to help traders identify key support and resistance levels in the market. This versatile indicator offers a customizable and user-friendly interface, allowing traders to select from five different pivot point calculation methods: Floor, Woodie, Camarilla, Tom DeMark, and Fibonacci. With its easy-to-read lines for pivot points (PP), support (S1, S2, S3, S4), and resistance (R1, R2, R3, R4) levels, the Advanced Pivot Point Indicator pr
FREE
The utility opens copies of open trades. It is very convenient if you use the   Signals   service and want to increase the volume of transactions. Settings: Symbols: all symbols only current symbol Orders: Buy Sell Magic Any Magic Input Magic Lot size Original - lot size from original order; Fix Lot - fix lot size (input); Lot X Mult - lot size X koef; Stop Loss From sender - Stop Loss from original; Without - without Stop Loss; Plus Fix - Stop Loss from original order + fix points; Fix Point -
FREE
This spread indicator displays the actual spread of each candle. It highlights the maximum spread and the minimum spread of the chosen symbol. This indicator is very helpful to see in real time the spread evolution helping to avoid taking a trade when the spread is too high. Inputs: Print value in Points: if true displays the spread as a whole number D isplay minimum and maximum spread of the past N days: select the number of days to consider the maximum and minimum spread Automatically adj
FREE
This indicator will show you the average entry price for positions, pending orders and both, every side and every type has an different color; It will also show you actual risk, pending risk, both sum and for both sides and the sum of both; you can configure Day, Week, Month and Year Financial Risk to show you if you are close to it; it shows the risk return of each side and both sides too, based on risk and profit for actual position and pending orders
FREE
Investment Castle Support and Resistance
Ahmed Alaaeldin Abdulrahman Ahmed Elherzawi
5 (5)
Investment Castle サポート&レジスタンス — 自動の売買レベル サポートとレジスタンスを手で引く必要はもうありません。このインジケーターは重要な買い・売りレベルを自動で描き、バイアスに応じてローソク足を色分けするので、相場がどちら側を好んでいるかがひと目で分かります。Investment Castle EA に内蔵されているサポート&レジスタンスのエンジンと同じものです。 このインジケーターができること 自動の売買レベル: サポートとレジスタンスを自動検出して描画。手動での描画は不要です。 色によるバイアス表示: ローソク足は買いで青、売りで赤になります(初期設定。入力で変更可)。 より速い判断: 価格が反応しやすい位置と優勢な方向が瞬時に分かります。 システムの一部: Investment Castle EA のサポート&レジスタンスの核。心理的キーレベルと連携します。 どこでも動作: あらゆる銘柄・あらゆる時間軸。 対象: 手作業なしで、クリーンで客観的な S/R レベルが欲しいトレーダー。 リスク警告: 取引には大きな損失リスクが伴います。必ずまずデモ口
FREE
Umagads Candle Timer MT5:規律あるトレーダーのための精密タイミングツール 動きの速い相場において、ローソク足が閉じる正確なタイミングを知ることは、完璧なエントリーと絶好の機会を逃すことの分かれ目となります。 Umagads Candle Timer MT5 は、実行に絶対的な精度を求めるMetaTrader 5ユーザー向けに設計された高性能ユーティリティです。M1のスキャルピングから日足のスイングトレードまで、このツールは必要な場所にカウントダウンを表示し、常に市場の一歩先を行くことを可能にします。 主な機能: スマート表示: 時間足に応じてフォーマットを自動変更(MM:SS、HH:MM:SS、または日数表示)。 視覚的警告: 終了10秒前に色がオレンジに自動変更され、執行に集中するための直感的な視覚信号を提供します。 ダイナミック配置: 価格のすぐ横に表示、またはチャートの四隅に配置可能。テクニカル分析を妨げないクリーンなワークスペースを提供します。 マルチ通知: ポップアップ、スマホへのプッシュ通知、メールに対応。終了30秒前(デフォルト)に事前警告を設定可
FREE
Shadow System Candles - トレンド可視化システム コンセプト 「暗闇での乱射はやめろ。相場にナイトビジョンを装備せよ」 Shadow System Candlesは、FXトレードプロジェクト「Shadow Operation」の視覚コアシステムです。 AIロジック(ADXと移動平均の統合判断)に基づき、ノイズを排除し、相場の「真のトレンド方向」をローソク足の色で可視化します。 ※本ツールは矢印シグナルは出ません。トレンドの「発生」と「消滅」を視覚的に認識するための訓練用、および裁量トレードのフィルターとして機能します。 機能: ・AIロジックによる色分け トレンドの強弱を5段階で表示します。 ・濃い青 (Deep Blue) 強力な上昇トレンド(加速フェーズ) ・薄い青 (Light Blue) 上昇トレンド ・グレー (Gray) レンジ / 膠着状態(待機推奨) ・薄い赤 (Light Red) 下降トレンド ・濃い赤 (Deep Red) 強力な下降トレンド(加速フェーズ) 規律の強制 グレーの期間は「手出し無用」。無駄な往復ビンタを防ぎます。完全
FREE
Hi you, I need your help! Be my Patron, let's make it possible! https://www.patreon.com/joaopeuko https://github.com/Joaopeuko/Mql5-Python-Integration Channel: English version - Versão Inglês: https://www.mql5.com/en/channels/Mql5_Python_Integration_EN Portuguese version - Versão Português: https://www.mql5.com/en/channels/Mql5_Python_Integration_PT Free version with 5 indicators: https://www.mql5.com/en/market/product/57574 This version has 38 indicators, 5 from the free version plus
FREE
The  Market Sessions Indicator for MT5 helps you  predict market turnarounds  by detecting major supply and demand areas. These pivot points tend to occur after a new session has started and the previous one is still open. It is also used to gauge how many points or pips the market moves on average during a session. This helps us to place better our take profits and stop losses. The indicator works on all forex pairs, gold, silver, commodities, stocks, indices and any other instrument that you
FREE
This Mt5 Indicator Signals when there is two opposite direction bars engulfed by current bar.  has a recent Exponential Moving Average Cross and past bar was oversold/bought Expert Advisor Available in Comments  Free Version Here : https://www.mql5.com/en/market/product/110114?source=Site&nbsp ; Full Alerts for mt5 terminal , phone , email, print to file, print to journal  Buy Signal ( blue line ) Past ema cross ( set at 30 bars back ) Past bar rsi is oversold ( level 40  ) Engulfing bar closes
FREE
FVG Concept and Market Structure (MS) Indicator – Comprehensive Analysis with Interactive Control This is not just an indicator. It is a useful tool for market analysis. This indicator combines several analytical functions, making it one of the more complete solutions in its field. This tool represents a comprehensive solution for analyzing market behavior with the goal of forecasting the direction of price movement. The indicator is designed to assist the trader and not distract them with unnec
FREE
TradeVisonPro Forex Analyzer Pro MT5取引口座分析・モニタリングダッシュボード TradeVisonPro Forex Analyzer Proは、MetaTrader 5ユーザー向けに設計された取引分析および口座モニタリングソリューションです。 本製品は、MT5の取引データを構造化されたWebダッシュボードに整理し、口座情報の確認、保有ポジションの監視、取引履歴の分析、戦略の追跡、トレードジャーナルの記録、パフォーマンス統計の確認を可能にします。 TradeVisonPro Forex Analyzer Proは、取引情報を整理し、対応するデスクトップおよびモバイルWebブラウザからアクセスできるようにすることを目的としています。 主な機能 • MT5口座ダッシュボード • 保有ポジション監視 • 取引履歴分析 • トレードカレンダー • 戦略追跡 • トレードジャーナル • 口座パフォーマンス統計 • パフォーマンスレポート • 取引通知 • 複数口座対応 • 共有可能な読み取り専用レポート MT5口座ダッシュボード MetaTrader 5取引口
FREE
Mentoria Individual
Gean Patrick Alves De Freitas
Mentoria Individual — Manual Trade Execution and Risk Management Mentoria Individual is a free manual trade execution and risk management tool for MetaTrader 5, developed by Gean Patrick. It combines lot size calculation, order preparation, visual Stop Loss and Take Profit adjustment, and position management in an interactive panel directly on the chart. The tool is designed for traders who want to maintain full control over their trading decisions. It does not provide trading signals or execut
FREE
このプロダクトを購入した人は以下も購入しています
Trend Sniper X
Sarvarbek Abduvoxobov
4.9 (41)
Trend Sniper X は、トレードの方向性と潜在的な反転ポイントを明確かつ正確に特定するのに役立つ、MetaTrader 5 用のマルチタイムフレーム・トレンドフォロー指標です。 MT4用: https://www.mql5.com/en/market/product/193245 価格情報: 現在の価格はプロモーション価格であり、今後のアップデートや新機能のリリースに伴い変更される場合があります。 ボーナス特典: このインジケーター用の無料自動売買アシスタントEAを入手するには、購入後に an 著者(開発者)へメッセージをお送りください。 Code2Profit チャンネル マルチタイムフレーム分析で相場をマスターしよう! Trend Sniper X で勝率を最大化する方法:重要なルールとセッションのコツ 技術仕様 プラットフォーム MetaTrader 5 インジケータータイプ マルチタイムフレーム・トレンドインジケーター 操作タイムフレーム あらゆるチャートタイムフレームに対応。個別に選択可能な上位タイムフレーム (M1–MN1) を搭載 主要銘柄 FX、ゴールド (X
Smart Trend Trading System — MetaTrader 5 ご購入後、MQL5で私にメッセージをお送りいただくと、Smart Universal Expert Advisorを無料で受け取れるほか、オンライン講座、PDFマニュアル、非公開グループへのアクセスもご利用いただけます。 STTSは、トレンドの方向、エントリー・決済シグナル、反転ゾーン、重要な価格水準をチャート上にまとめて表示します。システムを参考に手動で取引することも、別の対応EAを接続し、ご自身で選んだ設定に基づいて自動売買することもできます。 ひとつのシステム、4つのトレードアプローチ STTSのトレードアプローチは、大きく4つのカテゴリーに分かれています。 • スキャルピング — 短期的なシグナルや相場の動きを捉えます。 • トレンドトレード — 方向性を評価し、トレンド内の機会を探します。 • 反転トレード — 反転の可能性があるゾーンや方向の変化を見つけます。 • 出来高トレード — 出来高に基づく情報を使い、市場の活発さを評価します。 エントリー・決済の矢印、トレンド情報、サポート・
SuperScalp Pro
Van Minh Nguyen
4.56 (36)
SuperScalp Pro - Professional Multi-Layer Confluence Scalping System SuperScalp Proは、クラシックなSupertrendに複数のインテリジェントな確認フィルターを追加した、高度なスキャルピングインジケーターです。より高い確率が期待できるBuy/Sellの取引機会を特定し、ダマシのシグナルを大幅に減らすことをサポートします。 明確なBuyとSellの矢印がチャート上に直接表示され、ATRに基づくStop LossとTake Profitのレベルがリアルタイムで自動計算されます。 購入後、設定方法や推奨設定についてのサポートが必要な場合は、私にご連絡ください。 SuperScalp Pro Auto Traderを使用して、シグナルを簡単に自動化できます: [Auto Trader] 推奨設定ファイルをダウンロード: [Set File] 完全なドキュメントは製品ブログでご覧いただけます: [User Guide] 最新情報を受け取るには公式チャンネルに参加してください: [Official Channel]
新たな王者が登場 - インジケーター + 注文管理表示(TP1 + TP2 + TP3)+ オプションのTelegramシグナル送信機能付き(無料) (完全なトレード&シグナルシステム) ゴールド向け最高のEA: Gold Slayer このインジケーターには、高度な戦略、カスタマイズ可能な注文管理システム、そしてエンベロープ拡張を組み合わせた平均回帰システムが搭載されています。さらに、RSIなど複数のインテリジェントな確認フィルターによって、高確率の反転エントリーをBUY・SELLシグナルとして検出します。 単にトレードを学ぶだけでなく、複数ポジションを効果的に管理し、過去に利益を出しているオープンポジションで損失トレードをカバーする方法も学べます。 M5向けに構築・最適化されており、流動性が高くシグナルの精度が安定しているBTCUSDとXAUUSDで優れたパフォーマンスを発揮します。 このインジケーターは、ATRを基に自動計算されたエントリー、ストップロス、テイクプロフィットレベルを備えた明確なLong・Shortシグナルを提供するため、リスク管理が最初から組み込まれています。 マ
SMC Intraday Formula
VividMind Digital Solutions
5 (26)
まず正直に言いましょう。 どんなインジケーターも、それ単体であなたを利益化させることはできません。もしそう言う人がいるなら、それは夢を売っているだけです。完璧な売買シグナル(矢印)を表示するインジケーターは、いくらでも“完璧に見せる”ことができます。正しい過去の区間を拡大して、勝ちトレードだけを切り取ればいいだけです。私たちはそれをしません。 SMC Intraday Formula はツールです。 市場構造を読み取り、最も高い確率の価格ゾーンを特定し、今この瞬間のスマートマネーの痕跡をシンプルな言葉で正確に示します。最終判断はあなたが行います。トレードを実行するのもあなたです。しかし今は「希望」ではなく「精度」でエントリーできます。 私たちはこのインジケーターを、ゴールド(XAUUSD)および主要FX通貨ペアで約3年間、日々のスキャルピングに使用してきました。M1、M5、M15、M30の主要ツールです。これは未来を予測しようとするのではなく、今まさに形成されている高確率セットアップを示し、その理由を説明します。 他のすべてのインジケーターと何が違うのか? ほとんどのトレーディングイ
伝説が帰ってきました:Entry Points Pro 10。 MQL5 Marketのトップ3に3年間入り続けた伝説的インジケーターの再始動です。 2つのバージョンで合計589件の高評価レビュー、毎日数千人のトレーダーが実際のトレードに使用し、デモのダウンロードは31,000件以上   MT4+MT5 。 私はこの5年間に寄せられたレビューをすべて読み、約束を並べる代わりに、その答えをバージョン10に組み込みました。1999年から相場に携わり、 誠実さ、自らの評判、そして顧客を大切にする 作者による製品です。 Entry Points Proのエントリーシグナルは、リペイント(再描画)を一切行いません。 そして今回初めて、これは作者の言葉ではなく検証可能な事実になりました。確定シグナルはローソク足の終値確定後にのみ表示され、自動テストで リペイントはゼロ と確認されています(EURUSD、XAUUSD、BTCUSDで2,486,568回の不変条件チェック、違反0件)。検証方法は公開されており、ストラテジーテスターでご自身で再現できます。 ご購入後は、必ずすぐにダイレクトメッセージでご
Neuro Poseidon is a new indicator by Daria Rezueva. It combines precise trading signals with adaptive TP/SL levels - creating best possible trades as a result! Message me and get  Neuro Poseidon Assistant  as a gift to automize your trading process! What makes it stand out? 1. Proven profitability on all assets and timeframes 2. Only confirmed BUY and SELL signals present on the chart 3. Adaptive TP & SL levels generated by the software for each trade 4. Easy to understand - suitable for al
あなたのトレード優位性を視界に入れよう! M5 Sniper は MeanFX による新しいインジケーターです。 正確なトレードシグナル と 適応型TP/SLレベル を組み合わせることで、結果として可能な限り最高の統計的トレードを実現します! 5回購入されるごとに価格が上昇し、次の価格は69$です 購入後に私にメッセージを送っていただければ、ヒント/ガイドとボーナスEAをお受け取りいただけます 何が他と違うのでしょうか? Gold XAUUSDにおける 実証済みの統計的パフォーマンス ( ほぼすべてのアセットで機能します 。一貫した結果が得られないまま何でも扱おうとするのではなく、1つの時間足をマスターすることに重点を置いています) 1日あたり1~8回のトレード を各シンボルで実行し、高い勝率と、すべての統計的優位性をこちら側に持つことができます チャート上には 確認済みの BUYおよびSELLシグナルのみを表示 適応型TPおよびSLレベル を各トレードごとにインジケーターが生成 平均Winrate 75%+ 平均 Signal Ratio 最低1.1+ アラーム と通知を 携帯電話
Adaptive Price Action Engine インジケーターを購入すると、EAが無料に マルチタイムフレーム対応・自己最適化トレンド&ローソク足パターン分析 市場環境は常に変化しており、すべてのPrice Actionパターンが、あらゆる市場環境で同じ価値を持つわけではありません。 Adaptive Price Action Engine は、変化する市場環境への適応を目的として、 トレンド構造、マルチタイムフレーム分析、ローソク足パターン、統計的最適化 を1つの分析フレームワークに統合しています。 2つのアダプティブモード Dual Alpha Trend Mode 低い時間足と高い時間足のAlpha Trendパラメータを自動的に探索し、直近の市場動向に合わせてトレンド判定を適応させます。 Candlestick + Alpha Mode Alpha Trendによる市場レジーム判定と、 22種類の強気・弱気ローソク足パターン を組み合わせます。すべてのパターンを同じように扱うのではなく、さまざまなパターンの組み合わせを統計的に評価し、選択された市場環境において過去
M1 SNIPER は使いやすいトレーディングインジケーターシステムです。M1時間足向けに設計された矢印インジケーターです。M1時間足でのスキャルピングのためのスタンドアロンシステムとして、また既存のトレーディングシステムの一部としても使用できます。このトレーディングシステムはM1時間足での取引に特化して設計されていますが、他の時間足でも使用できます。元々、この手法はXAUUSDとBTCUSDの取引用に設計しましたが、他の市場においても役立つと考えています。 インジケーターのシグナルは、トレンドの方向と逆方向に取引できます。インジケーターのシグナルを利用して両方向に取引するのに役立つ特別な取引テクニックをご紹介します。この手法は、特別な動的なサポートとレジスタンスの価格帯を利用することに基づいています。 ご購入後、M1 SNIPER矢印インジケーターをすぐにダウンロードできます。さらに、M1 SNIPERツールのすべてのユーザーに、以下のスクリーンショットに表示されているApollo Dynamic SRインジケーターを無料で提供しています。この2つのインジケーターを組み合わせることで
Gann Made Easy   は、ミスター・ギャンの理論を使用した取引の最良の原則に基づいた、プロフェッショナルで使いやすい外国為替取引システムです。 W・D・ガン。このインジケーターは、ストップロスとテイクプロフィットレベルを含む正確な買いと売りのシグナルを提供します。 PUSH通知を利用して外出先でも取引可能です。 ご購入後、取引方法の説明と優れた追加インジケーターを無料で入手するには、私にご連絡ください! おそらく、ギャンの取引手法についてはすでに何度も聞いたことがあるでしょう。通常、ギャンの理論は初心者のトレーダーだけでなく、すでにある程度の取引経験がある人にとっても非常に複雑なものです。なぜなら、ギャンの取引手法は理論的にはそれほど簡単に適用できるものではないからです。私はその知識を磨き、最良の原則を私の外国為替インジケーターに組み込むために数年を費やしました。 このインジケーターは非常に簡単に適用できます。必要なのは、それをチャートに添付し、簡単な取引推奨事項に従うだけです。このインジケーターは常に市場分析の仕事を行い、取引の機会を探します。適切なエントリーポイントを検
Auto Optimized SpeedAngle は、継続的なウォークフォワード最適化(WFO:Walk-Forward Optimization)によりカーブフィッティング(過剰最適化)を排除した、機関投資家レベルのモメンタムベクトルシステムです。市場レジームの変化時に効果が低下する静的な入力に依存せず、アウトオブサンプル(OOS)検証を用いてパラメーターを動的に再キャリブレーションすることで、表示されるシグナルが単なる過去の偶然ではなく、確実な統計的優位性に基づいていることを保証します。 主な機関投資家向けフレームワーク ウォークフォワード最適化エンジン: ルックバック期間やしきい値の数千に及ぶ組み合わせを継続的にスキャンし、データをインサンプルとアウトオブサンプルに厳格に分離します。未検証のデータ環境において数学的優位性が証明された場合にのみ、新しいパラメーター設定を採用します。 定量的目的関数: 単なる純利益の追求ではなく、機関投資家レベルの安定性指標をターゲットとします。システム品質ナンバー(SQN)、期待値(1トレードあたりの平均Rマルチプル)、またはネットRの最適化を選
ARIPoint
Temirlan Kdyrkhan
1 (4)
ARIPoint is a powerful trading companion designed to generate high-probability entry signals with dynamic TP/SL/DP levels based on volatility. Built-in performance tracking shows win/loss stats, PP1/PP2 hits, and success rates all updated live. Key Features: Buy/Sell signals with adaptive volatility bands Real-time TP/SL/DP levels based on ATR Built-in MA Filter with optional ATR/StdDev volatility Performance stats panel (Success, Profit/Loss, PP1/PP2) Alerts via popup, sound, push, or email Cu
Scalper Vault は、スキャルピングを成功させるために必要なすべてを提供するプロフェッショナルなスキャルピング システムです。このインジケーターは、外国為替およびバイナリー オプションのトレーダーが使用できる完全な取引システムです。推奨される時間枠は M5 です。 システムは、トレンドの方向に正確な矢印シグナルを提供します。また、トップとボトムのシグナルとギャン マーケット レベルも提供します。 インジケーターは、プッシュ通知を含むすべてのタイプのアラートを提供します。 インジケータの購入後にご連絡ください。私の個人的な取引の推奨事項と素晴らしいボーナス指標を無料で共有します! 幸せで有益な取引をお祈りします!
Tokyo Indicatorは、トレンドの方向性、潜在的な取引シグナル、および市場状況を視覚的に分かりやすく表示します。 色分けされた階段状のトレンドラインにより、強気局面(青色)と弱気局面(マゼンタ色)が明確に区別されます。トレンドの変化に合わせて表示される方向矢印は、売買の好機を強調します。 統合されたダッシュボードには、現在のシグナル、市場のバイアス(傾向)、モメンタム、ボラティリティ、シグナルの品質がひと目で分かるようにまとめられています。これにより、トレーダーはパネルを切り替えることなく、価格変動(プライスアクション)とインジケーターの数値を照らし合わせて分析を行うことができます。 すっきりとしたチャート表示と簡潔な市場概要により、Tokyo Indicatorはトレンド分析や取引判断における体系的なアプローチをサポートします。 あらゆる時間足や銘柄に対応しており、特に金(ゴールド)の取引に適しています。 トレンド スキャナーの強力なサポートを利用して、無料のインジケーターを入手し、プライバシーを守ります。あーみー!     設定 ShowHUD - チャート上のパネ
Entry In The Zone and SMC Multi Timeframe is a real-time market analysis tool based on Smart Money Concepts (SMC), designed to analyze market structure, price direction, and key trading zones. It supports both Single-Timeframe and Multi-Timeframe Analysis, providing a clearer view of overall market structure across multiple timeframes, with real-time BUY / SELL signals designed with a strict focus on No-Repaint principles. The signals are designed to help filter unclear setups and evaluate tradi
トレンドキャッチャーインジケーター トレンドキャッチャーインジケーターは、開発者独自の適応型トレンド分析指標を組み合わせることで、市場価格の動きを分析します。短期的なノイズを除去し、根底にあるモメンタムの強さ、ボラティリティの拡大、価格構造の挙動に焦点を当てることで、真の市場方向性を特定します。また、移動平均線、RSI、ボラティリティフィルターなどの平滑化およびトレンドフィルタリング機能を備えたカスタマイズ指標も使用します。 実際の運用状況のモニタリングやその他の製品については、こちらをご覧ください: https://www.mql5.com/en/users/mechanic/seller ご注意ください。私はTelegramでEAや設定を販売していません。詐欺です。すべての設定はブログで無料で公開しています。 重要!ご購入後すぐにご連絡ください。手順とボーナスをお送りします!
トレーダーの皆さん、こんにちは! 多くの個人トレーダーは、動作の遅いウェブスクリプトに頼っています。真の収益性を実現するには、体系化されたフレームワークが必要です。 Astro AIインジケーターは、一般的なチャートオーバーレイではありません。これは、ターミナル上で直接動作する2つのエージェントを含む、コンパイル済みのニューラルネットワークです。 システムの具体的な技術は以下のとおりです。 1. エージェント1:アナリスト(グラフィカルニューラルネットワーク - GNN) 市場は孤立した価格バーではなく、相互に連結されたデータネットワークです。 機能:エージェント1は、グラフィカルニューラルネットワークを使用して、これらの複雑で非線形な関係をマッピングします。 利点:一般的なインジケーターは過去の移動平均しか考慮しませんが、当社のGNNは市場の深い構造的関係をリアルタイムで処理し、個人トレーダーの取引量が大きな影響を与える前に、隠れた相関関係を明らかにします。 2. エージェント2:エグゼキューター(近接戦略最適化 - PPO) パターン認識は、戦いの半分に過ぎません
このインジケーターを購入された方には、以下の特典を 無料 で提供しています: 各トレードを自動で管理し、ストップロスとテイクプロフィットを設定し、戦略ルールに基づいてポジションを決済する補助ツール 「Bomber Utility」 様々な銘柄に合わせたインジケーターの設定ファイル(セットファイル) 「最小リスク」、「バランスリスク」、「待機戦略」 の3つのモードで使用できる Bomber Utility 用の設定ファイル このトレーディング戦略をすぐに導入・設定・開始できる ステップバイステップのビデオマニュアル ご注意: 上記の特典を受け取るには、MQL5のプライベートメッセージシステムを通じて販売者にご連絡ください。 オリジナルのカスタムインジケーター 「Divergence Bomber(ダイバージェンス・ボンバー)」 をご紹介します。これは、MACDのダイバージェンス(乖離)戦略に基づいた 「オールインワン」型のトレーディングシステム です。 このテクニカルインジケーターの主な目的は、価格とMACDインジケーターの間に発生するダイバージェンスを検出 し、将来の価格の動きを示
Unix Scalper — MetaTrader 5 ご購入後、MQL5で私にメッセージをお送りいただくと、Smart Universal Expert Advisorを無料で受け取れるほか、オンライン講座、PDFマニュアル、非公開グループへのアクセスもご利用いただけます。 セットアップを見つけ、取引プランを確認し、取引方法を選ぶ。 UNIX Scalperは、市場分析、BUY/SELL/WAITの判断、Entry、Stop Loss、TP1、TP2の水準を、見やすいパネルにまとめています。 シグナルと取引プランを確認 • 明確な判断:BUY、SELL、WAIT。 • 明示された水準:Entry、Stop Loss、TP1、TP2。 • 複数時間足の一覧:パネル上で各時間足のシグナルを比較。 • 判断を支える分析:トレンド、モメンタム、出来高、ボラティリティ、サポートとレジスタンス、市場の質。 • 選べるレイアウト:Minimized、Compact、Standard、Full。 シグナルと各水準を確認し、そのセットアップがご自身の取引ルールに合うか判断してください。 ゴール
PainX GainX Blue Spike Fusion AI Advanced Synthetic Index Spike Detection Indicator for MetaTrader 5 Discover potential spike setups with a clear, organized, and professional trading interface. PainX GainX Blue Spike Fusion AI is a specialized indicator designed for traders who monitor synthetic indices and want a structured way to observe potential price spike opportunities. The indicator combines signal monitoring, market-condition analysis, visual alerts, and event tracking in one convenient
Volatility Master for MetaTrader is a real-time dashboard tool that scans up to  50 symbols  to identify high-volatility , trending markets instantly. With bullish/bearish signals, customizable alerts, and a user-friendly interface, it helps you avoid range-bound conditions and focus on high-probability trades. Clarity leads to confidence. Trade confidently and protect your capital effectively with this powerful dashboard. We don't offer free or bonus indicators in exchange of reviews from you.
Quantum TrendPulse を ご紹介します。これは、   SuperTrend   、   RSI   、および Stochastic のパワーを 1 つの包括的なインジケーターに組み合わせて、取引の可能性を最大限に引き出す究極の取引ツールです。精度と効率を求めるトレーダー向けに設計されたこのインジケーターは、市場のトレンド、勢いの変化、最適なエントリー ポイントとエグジット ポイントを自信を持って特定するのに役立ちます。 主な特徴: SuperTrend 統合: 現在の市場動向に簡単に追従し、収益性の波に乗ることができます。 RSI精度: 買われすぎと売られすぎのレベルを検出し、市場の反転のタイミングに最適で、SuperTrendのフィルターとして使用されます。 確率的精度: 確率的振動を活用して、変動の激しい市場で隠れたチャンスを見つけます。SuperTrend のフィルターとして使用されます。 マルチタイムフレーム分析:   M5 から H1 または H4 まで、さまざまなタイムフレームで市場を常に把握します。 カスタマイズ可能なアラート: カスタム取引条件が満たされ
Atomic Analyst — MetaTrader 5 ご購入後、MQL5で私にメッセージをお送りいただくと、Smart Universal Expert Advisorを無料で受け取れるほか、オンライン講座、PDFマニュアル、非公開グループへのアクセスもご利用いただけます。 Atomic Analystは、プライスアクション、トレンドの方向、エントリー・決済シグナル、損切り水準、複数の利確水準をチャート上にまとめて表示します。 シグナルを確認し、取引の状況を理解する Atomic Analystは、分析結果をわかりやすい視覚情報として表示します。 • エントリーの候補を見つけるための買い・売りの矢印。 • 取引計画に役立つ損切り水準と複数の利確水準。 • 市場の方向性を評価するトレンド、強さ、モメンタムの指標。 • より広い市場背景を比較する複数時間足の分析。 • 変化する状況を追うための色分けされたローソク足とアラート。 シグナルと補助分析を併せて確認し、その取引機会がご自身のルールに合うかを判断してください。 短期の取引機会から、より大きな値動きまで Atomic A
FiboSniper Pro – Multi-Filter Fibonacci System with Auto SL/TP and Control Panel FiboSniper Proは、動的なFibonacci Envelopesと複数の確認フィルターを組み合わせ、選別されたBuyおよびSellシグナルを生成するテクニカルインジケーターです。FibonacciレベルはMoving AverageとATRを基に計算され、その後ADX、EMA、RSI、ATR、Volume、Time、Candle構造によってフィルタリングされます。インジケーターは、ATRに基づく自動Stop LossおよびTake Profitレベルをチャート上に直接表示し、さらに迅速な調整が可能なインタラクティブControl Panelを提供します。 購入後、推奨設定ファイルと詳細な使用方法については、私にご連絡ください。 Auto Trader Xを使用してFiboSniper Proのシグナルを自動化できます: [Auto Trader X] User GuideとSet Files: [Click her
Break and Retest Hunter is a powerful MetaTrader 5 indicator designed to automatically identify support and resistance levels, breakout structures, and potential retest opportunities in real time. Bonus Indicator: After purchasing Break and Retest Hunter , contact me to receive Trade Indicator Assistant EA completely free as a bonus utility. $65 for the next 10 copies . Next price is $120.  Combining adaptive market analysis, clear BUY/SELL signals, Fibonacci-based profit targets, and a premiu
ご紹介     Quantum Breakout PRO は 、ブレイクアウト ゾーンの取引方法を変革する画期的な MQL5 インジケーターです。 13年以上の取引経験を持つ経験豊富なトレーダーのチームによって開発されました。     クォンタム ブレイクアウト プロ   は、革新的でダイナミックなブレイクアウト ゾーン戦略により、あなたのトレーディングの旅を新たな高みに押し上げるように設計されています。 クォンタム ブレイクアウト インジケーターは、5 つの利益ターゲット ゾーンを備えたブレイクアウト ゾーン上のシグナル矢印と、ブレイクアウト ボックスに基づいたストップロスの提案を提供します。 初心者トレーダーにもプロのトレーダーにも適しています。 量子EAチャネル:       ここをクリック 重要!購入後、インストールマニュアルを受け取るためにプライベートメッセージを送ってください。 推奨事項: 時間枠: M15 通貨ペア: GBPJPY、EURJPY、USDJPY、NZDUSD、XAUUSD アカウントの種類: ECN、Raw、またはスプレッドが非常に低い R
FX Power: 通貨の強弱を分析して、より賢い取引を実現 概要 FX Power は主要通貨と金の実際の強弱をあらゆる市場状況で理解するための必須ツールです。強い通貨を買い、弱い通貨を売ることで、 FX Power は取引の意思決定を簡素化し、高い確率の取引機会を見出します。トレンドを追従する場合でも、極端なデルタ値を使用して反転を予測する場合でも、このツールはあなたの取引スタイルに完全に適応します。ただ取引するだけではなく、 FX Power で賢く取引をしましょう。 1. なぜ FX Power がトレーダーにとって非常に有益なのか 通貨と金のリアルタイム強弱分析 • FX Power は主要通貨と金の相対的な強弱を計算し、マーケットダイナミクスに関する明確な洞察を提供します。 • どの資産がリードしているか、または後れを取っているかを監視して、取引するペアを賢く選びましょう。 マルチタイムフレームの包括的なビュー • 短期、中期、長期のタイムフレームで通貨と金の強弱を追跡し、マーケットトレンドに基づいて取引戦略を調整できます。 • スキャルピングからスイングトレード
発見が困難で頻度が少ないため、分岐は最も信頼できる取引シナリオの1つです。このインジケーターは、お気に入りのオシレーターを使用して、通常の隠れた分岐点を自動的に見つけてスキャンします。 [ インストールガイド | 更新ガイド | トラブルシューティング | よくある質問 | すべての製品 ] 取引が簡単 通常の隠れた発散を見つけます 多くのよく知られている発振器をサポート ブレイクアウトに基づいて取引シグナルを実装します 適切なストップロスおよび利益レベルを表示します 設定可能なオシレーターパラメーター カスタマイズ可能な色とサイズ バー単位でサイズ別に分岐をフィルタリング パフォーマンス統計を実装します 電子メール/音声/視覚アラートを実装します 幅広い市場の見通しを提供するために、異なるオシレーターを使用して、干渉なしで同じチャートにインジケーターを何度もロードできます。このインジケーターは、次のオシレーターをサポートしています。 RSI CCI MACD オスマ 確率的 勢い 素晴らしい発振器 加速器発振器 ウィリアムズパーセントレンジ 相対活力指数 特に外国為替市場では、
Gartley Hunter Multi - An indicator for searching for harmonic patterns simultaneously on dozens of trading instruments and on all possible timeframes. Manual (Be sure to read before purchasing) | Version for MT4 Advantages 1. Patterns: Gartley, Butterfly, Shark, Crab. Bat, Alternate Bat, Deep Crab, Cypher 2. Simultaneous search for patterns on dozens of trading instruments and on all possible timeframes 3. Search for patterns of all possible sizes. From the smallest to the largest 4. All fou
作者のその他のプロダクト
A. Momentum Candles: Designed by an experienced trader and web performance engineer. Developed and built with performance, speed and optimization in mind. Uses unique clean outline of events, even when there are multiple events. Colours every candle by momentum: bullish, neutral or bearish at a glance. Marks each break of structure and change of character right on the chart. Draws a line at the swing level that broke, so you can see where it happened. Skips small swings and breaks into an exhaus
FREE
A. Chart Manager: Designed by an experienced trader and web performance engineer. Developed and built with performance, speed and optimization in mind. Uses unique clean outline of events, even when there are multiple events. Restyles your chart with one of five color themes when you click it. Removes background images and the objects other tools leave on the chart. Never removes the rectangle labels that Expert Advisor panels are built from. Shows or hides the grid, volumes, trade levels, price
FREE
Advanced Expert Advisor Monitor: Shows whether your Expert Advisor is still running, right on the chart. Keeps reporting its trades even after the Expert Advisor has stopped or was removed. Closed profit, win rate and floating profit for Today, 3 Days, Week or Month. A 365-day view: profit factor, drawdown, expectancy, streaks and more. Draws only your Expert Advisor's trades on the chart, by magic number. Popup and phone alerts when the Expert Advisor unexpectedly crashes. Does this sound fa
FREE
Advanced Chart Manager: Puts your chart look back when another program changes it, on your next click. Names the setting that was changed, so you can tell which tool did it. Styles every open chart from one instance, then returns you to your chart. Builds your own theme from thirteen colors, or uses one of five ready ones. Watches second by second right after load, while slow indicators start up. Clears leftover drawings on a schedule, leaving panel backgrounds in place. When the chart keeps ch
Advanced Momentum Candles: Designed by an experienced trader and web performance engineer. Developed and built with performance, speed and optimization in mind. Uses unique clean outline of events, even when there are multiple events. Signals structure breaks to the Expert Advisor through a readable signal buffer. Tunes swings, filters and momentum from an on-chart panel, with no reload. Shades every candle in seven steps, from strong bullish to strong bearish. Holds a separate settings line for
フィルタ:
レビューなし
レビューに返信