Kinetic Barycenter MT5

KINETIC BARYCENTER MT5


First-Principles quantitative mechanics: Center of mass, Multi-Horizon price gravity and Elastic exhaustion bands
By ONDEB Labs


THE PARADIGM SHIFT: MEASURING MARKET MASS INSTEAD OF CHRONOLOGICAL TIME

Major technical indicators were conceived decades ago under the assumption that chronological time is uniform. Simple and Exponential Moving Averages (SMA, EMA) treat quiet, low-volume consolidation bars with the exact same mathematical weight as massive institutional liquidity events. The consequence is well-known to experienced traders: structural lag, false breakout whipsaws, and trend indicatoTecrs that systematically blow past statistical bounds.

Kinetic Barycenter MT5 approaches price discovery through first-principles classical physics and continuous elasticity:

  1. Volume as physical mass: Every transaction injects inertia. Price bars with dense liquidity exert gravitational attraction proportional to their volume.
  2. Continuous newtonian relaxation (Half-Life T1/2): Past volume influence decays continuously through an exponential half-life function, eliminating the abrupt, artificial step jumps common to standard rolling windows.
  3. Hooke's elasticity (Z-Score): When market price deviates from the institutional center of mass, spatial dispersion creates a quantifiable restorative tension. At statistical boundaries (absolute Z-Score >= 2.0 Sigma), liquidity thins out and volume-weighted mean reversion becomes an asymmetric risk/reward opportunity.

Operates flawlessly on any broker using standard OHLCV tick data for XAUUSD (Gold), Indices (US30, NAS100, GER40, SPX500), Forex Majors, and Cryptocurrencies. Requires zero external DLLs, no order-book subscriptions, and uses strict causal non-repainting integrity.

Core engineering and quantitative architecture


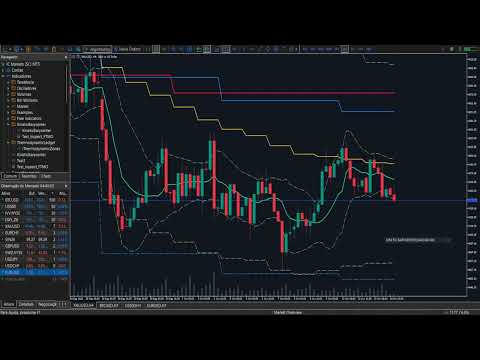
1. Multi-Horizon gravitational anchors (H1, D1, W1, MN1)
The indicator concurrently computes and projects the volume-weighted centers of mass across four operational horizons:
- MN1 (Crimson): Macro structural bedrock (monthly equilibrium anchor).
- W1 (Royal Blue): Swing trading benchmark and weekly balance point.
- D1 (Amber / Gold): Daily session fair-value center of mass.
- H1 (Spring Green): Tactical intraday microstructure line for precision entries.

2. Elastic Exhaustion Channels (+/- 1.5 Sigma to +/- 2.0 Sigma)
Dynamic standard deviation envelopes computed from volume-weighted spatial dispersion:
- Calibrated Defaults (Gold and Major Forex): The factory default setting (2.0 Sigma) is precision-calibrated for deep-liquidity institutional assets like Gold (XAUUSD), EURUSD, and GBPUSD. It pinpoints high-probability mean-reversion turning points without lag or premature entry.
- Fully Customizable for High-Volatility and Crypto: For hyper-volatile instruments with heavy-tailed distributions, such as Cryptocurrencies (BTCUSD, ETHUSD,SOLUSD) or NAS100, the sigma envelope is fully customizable via InpExhaustionSigma (e.g., expanded to 2.5 Sigma – 3.0 Sigma) to account for extreme volatility bursts and prevent premature counter-trend exposure.

3. High-Performance dark glassmorphism HUD (DearMQL5 Canvas)
A GPU-accelerated interactive dashboard rendered via native memory-buffered canvas (O(1) zero allocation on tick path):
- Real-time Z-Score: Continuous numerical readout of elastic tension.
- Proportional strain gauge: Visual progress meter mapping deformation against institutional climax thresholds.
- Multi-Timeframe confluence matrix: Instant readout of price distance (in points and sigmas) across all four horizons.
- Natural Take Profit Target: Real-time projection of the primary gravitational return target (D1 Barycenter).
- One-click toggles: Instantly show/hide exhaustion bands or mute/enable alerts directly from the chart window.
- Collapsible mini-widget: Minimize the panel into an unobtrusive title badge for multi-chart layouts.

4. Bilingual localization and dedicated File Diagnostics
- Native Bilingual Engine (InpLanguage): Instant zero-overhead switching between English (LANG_EN) and Portuguese (LANG_PT).
- Dedicated File Telemetry (InpDebugMode): Debug parameter that, when enabled, generates high-fidelity silent diagnostics logged to  MQL5\Files\KineticDebug_<Symbol>_<TF>.log with rate-limited tick profiling and NDEBUG compilation support. These logs are intended to be sent to support with Alex Hernández. 

Institutional Operational Playbooks


Playbook 1: Value retest and Polarity reversal (Day Trading M5/M15)

  • Context: A high-volume expansion bar decisively breaks the Daily (D1) or Hourly (H1) Barycenter, absorbing resting liquidity. On the initial pullback, early positioning rebalances at fair-value breakeven. Directional participants step in to defend the newly established volume-weighted benchmark.
  • Execution Context: Look for an M5 rejection candle (pin bar or engulfing) confirming that previous resistance has transitioned into dynamic support. 
  • Risk/Reward Structure: In this setup, the invalidation level (Stop Loss) is typically mapped behind the rejection wick, with the outer +/- 2.0 Sigma band acting as the primary target zone (offering a structural 1:3.0 to 1:4.0 R:R profile). 

Playbook 2: Elastic boundary mean reversion (Absolute Z-Score >= 2.0 Sigma)
  • Context: Price expands into the outer exhaustion envelope during active liquidity sessions. Spatial displacement enters statistical tail territory (> 95.4% probability boundary). Directional momentum decelerates as liquidity thins out.
  • Execution Context: Look for the first M5/../M30/H1 candle closing back within the exhaustion band, confirmed by tick volume divergence.
  • Risk/Reward Structure: Mean reversion toward the Daily Barycenter, mapping an asymmetric 1:3.5 to 1:5.0 structural R:R profile.
Playbook 3: Triple barycenter Super-Cycle Cross (Swing Trading H1/H4)
  • Context: D1, W1, and MN1 barycenters tightly compress into a narrow price corridor (Absolute Z-Score < 0.5 Sigma).
  • Mechanism: Multi-horizon consensus reaches a potential energy singularity, a structural compression that historically precedes sustained, multi-hundred-point directional expansions.
  • Trend Management Reference: The moving D1 Barycenter serves as a dynamic trailing reference as long as the hierarchical cascade ( Price > D1 > W1 > MN1 ) remains unbroken.

Complete Input parameters specification


Group 0: Language & Localization
  • InpLanguage (Default: LANG_EN): Native Bilingual Engine switching between English (LANG_EN) and Português (LANG_PT).

Group 1: Core Calibration & Newtonian Decay

  • InpD1Bars (Default: 30): Number of daily bars evaluated for D1 Center of Mass.
  • InpD1HalfLife (Default: 7.0): Exponential relaxation half-life in days for D1 memory decay.
  • InpW1Bars (Default: 26): Number of weekly bars evaluated for W1 Center of Mass.
  • InpW1HalfLife (Default: 14.0): Exponential relaxation half-life in days for W1 swing equilibrium.
  • InpMN1Bars (Default: 12): Number of monthly bars evaluated for MN1 Macro Bedrock.
  • InpMN1HalfLife (Default: 60.0): Exponential relaxation half-life in days for MN1 macro anchor (~2 months).
  • InpH1Bars (Default: 48): Number of hourly bars evaluated for H1 intraday microstructure.
  • InpH1HalfLife (Default: 1.0): Exponential relaxation half-life in hours for intraday continuous decay.
Group 2: Elastic Exhaustion Thresholds
  • InpExhaustionSigma (Default: 2.0): Outer exhaustion band multiplier (1.5σ–2.0σ for Gold/Forex; customizable to 2.5σ–3.5σ for Crypto).
  • InpClimaxSigma (Default: 3.0): Critical elastic climax threshold signaling extreme statistical depletion.

Group 3: Chart Visual Styling

  • InpShowD1 / InpColorD1 (Default: true / Gold): Visibility and color for Daily Barycenter line.
  • InpShowBandsD1 / InpColorBandsD1 (Default: true / Khaki): Visibility and color for Daily Exhaustion Bands.
  • InpShowW1 / InpColorW1 (Default: true / DodgerBlue): Visibility and color for Weekly Barycenter line.
  • InpShowBandsW1 / InpColorBandsW1 (Default: true / DeepSkyBlue): Visibility and color for Weekly Exhaustion Bands.
  • InpShowMN1 / InpColorMN1 (Default: true / Crimson): Visibility and color for Monthly Macro Bedrock line.
  • InpShowBandsMN1 / InpColorBandsMN1 (Default: true / Tomato): Visibility and color for Monthly Exhaustion Bands.
  • InpShowH1 / InpColorH1 (Default: true / MediumSpringGreen): Visibility and color for Hourly Intraday Barycenter line.
  • InpShowBandsH1 / InpColorBandsH1 (Default: true / PaleGreen): Visibility and color for Hourly Exhaustion Bands.
  • InpStyleBands / InpWidthBands (Default: STYLE_DASH / 1): Line style and thickness for exhaustion envelopes.

Group 4: Floating HUD Canvas (DearMQL5)
  • InpShowHud (Default: true): Master toggle for the GPU-accelerated DearMQL5 Canvas Dashboard.
  • InpHudMarginX / InpHudMarginY (Default: 30 / 35): Horizontal and vertical screen margin offset in pixels.

Group 5: Multi-Alert & Anti-Spam System

  • InpEnableAlerts (Default: true): Master switch for Pop-up, Sound, and Push Notification alerts.
  • InpAlertPopup (Default: true): Terminal modal popup dialog on signal triggers.
  • InpAlertPush (Default: false): Instant mobile Push notification to MT5 smartphone app (MetaQuotes ID).
  • InpAlertSound / InpSoundFile (Default: true / "alert.wav"): Acoustic terminal notification toggle and audio filename.
  • InpCooldownSec (Default: 60): Anti-spam interval (in seconds) between repeated alerts.
  • InpAlertOnceBar (Default: true): Restricts signal notification to a maximum of once per bar.

Group 6: Optimization & Performance
  • InpMaxHistoryBars (Default: 1000): Historical bar evaluation depth limit (0 = evaluate entire available history).
  • InpThrottleSec (Default: 5): CPU throttling constant for heavy asynchronous calculations.
Group 7: Diagnostics & Debug Mode
  • InpDebugMode (Default: false): Silent high-fidelity telemetry logged to MQL5\Files\KineticDebug_<Symbol>.log.

Algorithmic Automation: 15 Formal Buffers (iCustom Ready)


Engineered with a Clean Architecture paradigm, the indicator provides 15 standardized non-repainting data buffers accessible by any Expert Advisor or Script:

- Buffer 0 | BUFFER_BARYCENTER_D1 (Price): Daily Barycenter (Session Fair Value Anchor)
- Buffer 1 | BUFFER_BARYCENTER_W1 (Price): Weekly Barycenter (Swing Trading Equilibrium)
- Buffer 2 | BUFFER_BARYCENTER_MN1 (Price): Monthly Macro Bedrock Price
- Buffer 3 | BUFFER_UPPER_2SIGMA (Price): Upper Daily Exhaustion Band (+InpExhaustionSigma)
- Buffer 4 | BUFFER_LOWER_2SIGMA (Price): Lower Daily Exhaustion Band (-InpExhaustionSigma)
- Buffer 5 | BUFFER_ELASTIC_ZSCORE (Float): Continuous Hooke Elastic Z-Score Readout
- Buffer 6 | BUFFER_REGIME_SIGNAL (Int): Signal Code: +1 (Buy Reversal), -1 (Sell Reversal), 0 (Neutral)
- Buffer 7 | BUFFER_TARGET_TP (Price): Suggested Take Profit Gravitational Target Price
- Buffer 8 | BUFFER_UPPER_W1 (Price): Upper Weekly Exhaustion Band (+InpExhaustionSigma)
- Buffer 9 | BUFFER_LOWER_W1 (Price): Lower Weekly Exhaustion Band (-InpExhaustionSigma)
- Buffer 10 | BUFFER_UPPER_MN1 (Price): Upper Monthly Exhaustion Band (+InpExhaustionSigma)
- Buffer 11 | BUFFER_LOWER_MN1 (Price): Lower Monthly Exhaustion Band (-InpExhaustionSigma)
- Buffer 12 | BUFFER_BARYCENTER_H1 (Price): Hourly Tactical Intraday Barycenter
- Buffer 13 | BUFFER_UPPER_H1 (Price): Upper Hourly Exhaustion Band (+InpExhaustionSigma)
- Buffer 14 | BUFFER_LOWER_H1 (Price): Lower Hourly Exhaustion Band (-InpExhaustionSigma)

Dynamic Sigma Evaluation in Code:

Because the Center of Mass (c) and Dispersion (Sigma) are physical invariants of the volume ledger, an Expert Advisor can compute custom dynamic thresholds (1.6 Sigma for intraday scalps, 2.8 Sigma for swing trades) on the fly without modifying indicator inputs:

Sigma_Unit = (BufferUpper - BufferBarycenter) / InpExhaustionSigma
CustomBand = BufferBarycenter +/- (k * Sigma_Unit)

Production-grade EA Integration Sample


//+------------------------------------------------------------------+
//| Integration Sample for Expert Advisors                       |
//| Copyright 2026, ONDEB Quantitative Labs                  |
//+------------------------------------------------------------------+
#define BUFFER_BARYCENTER_D1   0
#define BUFFER_UPPER_2SIGMA     3
#define BUFFER_LOWER_2SIGMA    4
#define BUFFER_ELASTIC_ZSCORE  5
#define BUFFER_REGIME_SIGNAL    6
#define BUFFER_TARGET_TP          7

int g_kinetic_handle = INVALID_HANDLE;

int OnInit()
{
    // ------------------------------------------------------------------
    // AUTOMATIC HEADLESS ARCHITECTURE NOTE:
    // The indicator internally monitors MQLInfoInteger(MQL_TESTER).
    // When invoked by an EA during Strategy Tester backtests or genetic
    // optimizations, it automatically bypasses all DearMQL5 Canvas HUD 
    // rendering, font memory allocations, and mouse events.
    // It operates in pure headless mode (O(1) vector math) to deliver
    // maximum multi-core CPU throughput across millions of ticks.
    // ------------------------------------------------------------------
    g_kinetic_handle = iCustom(_Symbol, _Period, "KineticBarycenter");
    if(g_kinetic_handle == INVALID_HANDLE)
    {
        PrintFormat("Kinetic Barycenter initialization failed. Error: %d", GetLastError());
        return INIT_FAILED;
    }
    return INIT_SUCCEEDED;
}

void OnTick()
{
    if(g_kinetic_handle == INVALID_HANDLE) return;

    // Fast 1-bar copy of essential mathematical buffers
    double signal[1], target_tp[1], z_score[1], bary_d1[1], upper_d1[1];
    if(CopyBuffer(g_kinetic_handle, BUFFER_REGIME_SIGNAL,  0, 1, signal)    <= 0) return;
    if(CopyBuffer(g_kinetic_handle, BUFFER_TARGET_TP,      0, 1, target_tp) <= 0) return;
    if(CopyBuffer(g_kinetic_handle, BUFFER_ELASTIC_ZSCORE, 0, 1, z_score)   <= 0) return;
    if(CopyBuffer(g_kinetic_handle, BUFFER_BARYCENTER_D1,  0, 1, bary_d1)   <= 0) return;
    if(CopyBuffer(g_kinetic_handle, BUFFER_UPPER_2SIGMA,   0, 1, upper_d1)  <= 0) return;

    // Dynamic 1.6-sigma calculation for custom Intraday Scalping thresholds
    double InpExhaustionSigma = 2.0;
    double sigma_unit   = (upper_d1[0] - bary_d1[0]) / InpExhaustionSigma;
    double custom_upper = bary_d1[0] + (1.6 * sigma_unit);
    double custom_lower = bary_d1[0] - (1.6 * sigma_unit);

    // ------------------------------------------------------------------
    // NAIVE / BASELINE MEAN-REVERSION EXECUTION:
    // (Educational template. In live institutional production, pair this 
    // baseline trigger with session time filters, spread guards, and 
    // strict prop-firm risk management rules)
    // ------------------------------------------------------------------
    if(signal[0] > 0.5) // Climax Oversold: Price pierced lower band and closed back inside
    {
        PrintFormat("BUY REVERSAL: z = %.2f sigma | Natural TP = %.2f", z_score[0], target_tp[0]);
        // Open Buy position: SL below the exhaustion candle wick, TP anchored at target_tp[0]
    }
    else if(signal[0] < -0.5) // Climax Overbought: Price pierced upper band and closed back inside
    {
        PrintFormat("SELL REVERSAL: z = %.2f sigma | Natural TP = %.2f", z_score[0], target_tp[0]);
        // Open Sell position: SL above the exhaustion candle wick, TP anchored at target_tp[0]
    }
}

void OnDeinit(const int reason)
{
    // Clean up indicator handle to release terminal memory
    if(g_kinetic_handle != INVALID_HANDLE)
    {
        IndicatorRelease(g_kinetic_handle);
    }
}

Technical Support and Diagnostic protocol (InpDebugMode)


To guarantee prompt assistance in the event of unexpected behavior (such as broker history desynchronization, exotic assets with non-standard tick dimensions, or weekend network latency), Kinetic Barycenter MT5 includes a dedicated file-based structured telemetry engine via InpDebugMode = true.


Official 3-Step Support Request Procedure:

  1. Activation: Open indicator properties (F7 in MetaTrader 5), navigate to the DIAGNOSTICS & DEBUG MODE parameter group, and set InpDebugMode to true.
  2. Telemetry Capture: Allow the indicator to run on your chart forthe necessary time to capture complete initialization, multi-timeframe synchronization, live broker data feeds and reproduce your current problem.
  3. Log Retrieval: In the top menu of MetaTrader 5, click: File -> Open Data Folder -> MQL5 -> Files. Locate the diagnostic log file formatted as MQL5\Files\KineticDebug_<Symbol>_<TF>.log . Send this log file directly to Alex Hernández via private message on our official MQL5 Community profile.
What Does Debug Mode Audit?
  • Symbol Metadata: Fractional precision (Digits), minimum tick size (TickSize), and point value (Point) provided by your broker feed.
  • Multi-Timeframe Synchronization: Requested vs. delivered bar counts for H1, D1, W1, and MN1, including low-level network return codes (GetLastError()).
  • Mathematical Stability: Verification of variance floors preventing division-by-zero exceptions on abnormal tick spreads.
  • Lifecycle Telemetry: Exact deinitialization reasons (UninitializeReasonGet()) and memory stability metrics.
Strict Privacy Policy:
The diagnostic log never accesses, stores, or transmits trading account passwords, balances, equity, or personal user data. It monitors strictly mathematical telemetry between MetaTrader 5 and the calculation engine.
おすすめのプロダクト
Wapv Price and volume
Eduardo Da Costa Custodio Santos
MT5のWAPV価格と出来高インジケーターは、(Wyckoff Academy Wave Market)および(Wyckoff Academy Price and Volume)ツールセットの一部です。 MT5のWAPV価格および出来高インジケーターは、チャート上の出来高の動きを直感的な方法で簡単に視覚化できるように作成されました。 それを使用すると、ピークボリュームの瞬間と市場が専門家の関心を持たない瞬間を観察することができます 「スマートマネー」の動きではなく、慣性によって市場が動いている瞬間を特定します。 ユーザーが変更できる4色で構成されています。 赤=オファーの増加 緑=需要の増加 灰色のキャンドル=需要と供給の減少 青=スマートマネー演技 上方向への動きは強さを示します。 下向きの動き弱さを示します。 価格の方向に関係なく、最強のボリュームが上がる必要があります。 R.Wyckoffの理論に基づいて作成されたインジケーター
VeloTicker PRO — Real-Time Flow Reading VeloTicker PRO is an advanced indicator designed for traders looking to interpret market dynamics beyond just price. With an intuitive visual interface based on dual gauges (BUY vs. SELL), it transforms market flow into clear signals, enabling faster and more precise decision-making. What It Delivers Instant reading of buying and selling pressure Clear visualization in a gauge (speedometer) format Rapid response to market changes Intelligent smoot
Weis Wave Scouterは、MetaTrader 5向けに開発された革新的なインジケーターであり、WyckoffメソッドとVSA(Volume Spread Analysis)の確立された原則を組み合わせています。精度と深みを求めるトレーダー向けに設計され、累積ボリューム波の分析を通じて市場を戦略的に読み取り、トレンドの反転ポイントや継続ポイントを特定する支援を行います。 Weis Wave Scouterは、クラシック、ナイトビジョン、オーシャンブリーズといったカスタマイズ可能なカラーテーマで、上昇波と下降波を色分けしたヒストグラムで明瞭に表示します。主な機能には、ボリュームピークの検出、低アクティビティゾーン(DeadZone)の識別、およびボリュームベースの波の反転に関するカスタマイズ可能なアラートが含まれます。また、エフォート対リザルト分析、因果関係、需給バランスといったWyckoffおよびVSA理論の基本概念をサポートしています。Brick Size、Volume Scale Factor、Pivot Lookbackといったパラメータで柔軟に調整でき、あらゆるスタ
ApeX Trade Manager MT5  →     ApeX Journal MT5  →     ApeX Indicator SMC MT5  →     ApeX Indicator ICT Concepts MT5  →     ApeX Indicator Volume Profile MT5  →    ApeX Indicator ICT Macros MT5  → One profile per session tells you about the session. One profile per swing tells you about the trade you are in. ApeX Volume Profile builds a profile for every pivot the market makes. 1. The profile Point of Control — The price where the most volume traded in that leg, optionally extended right or bo
IMPORTANT! After your purchase, please contact me. Overview: Trade Vision Panel is a premium, lightweight trading dashboard for MetaTrader 5 designed to display your key trading information directly on the chart. It combines performance analytics, open-position monitoring, and a real-time news filter — all in one smart, elegant interface. Perfect for traders who want to see everything
Volume Candle Indicator
Pablo Filipe Soares De Almeida
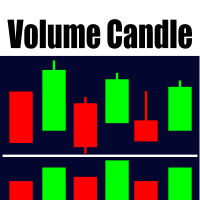
MetaTrader 5 用ボリュームカラーヒストグラムインジケーター このインジケーターは、取引量を別ウィンドウにヒストグラムとして表示します。ローソク足の方向に基づき、バーの色が自動的に変化します。終値が始値より高い場合は緑(上昇トレンド)で表示され、終値が始値より低い場合は赤(下降トレンド)で表示されます。これにより、トレーダーは価格変動とボリュームの関係を視覚的に把握できます。 主な機能 ボリュームソース:ティックボリュームまたはリアルボリュームを選択可能。 ボリュームヒストグラムの上に移動平均線を追加でき、平滑化されたボリュームトレンドを確認可能。 対応平均タイプ:SMA、EMA、SMMA、LWMA。 平均期間を自由に設定可能。 すべての銘柄と時間足で動作し、MetaTrader 5 に完全対応。 視覚的にわかりやすい配色設計により、価格変化の強弱を一目で判断でき、トレードタイミングを最適化するのに役立ちます。
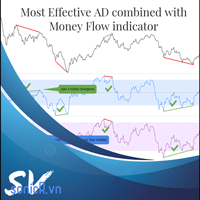
The Accumulation / Distribution is an indicator which was essentially designed to measure underlying supply and demand. It accomplishes this by trying to determine whether traders are actually accumulating (buying) or distributing (selling). This indicator should be more accurate than other default MT5 AD indicator for measuring buy/sell pressure by volume, identifying trend change through divergence and calculating Accumulation/Distribution (A/D) level. Application: - Buy/sell pressure: above
Flow Architect Lite - Professional Market Structure Toolkit Free Version Features: Core Structure Analysis: Daily VWAP Engine   - Volume-weighted average price for institutional level tracking Standard Deviation Bands (SD1)   - Dynamic support and resistance zones Break of Structure Detection   - Visual markers for market structure shifts Fair Value Gap Identification   - Highlighted imbalance zones on your charts ATR Volatility Context   - Real-time Average True Range measurement Clean Informat
True Weis Wave
Atila Goncalves Firmino
A version based on David Waves' description in his book 'Trade About to Happen' of his adaptation of the Wyckoff wave chart. The indicator directionally accumulates volume, adding to each brick or candle close, with color indication for up and down. it can be used it with tick or real volume, it also changes color when the accumulated value of the previous wave is exceeded, being the trade signal. Yellow color is used for doji candlestick, it will continue with accumulation without zero the sum
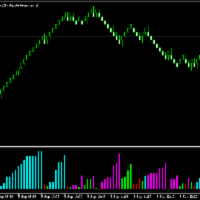
An effective indicator that highlights candles with increasing volumes, overshadowing those with shrinking volumes. Also suitable for Forex because it uses tick_volume.  You can set the colors to your liking. It will be easier to spot trends and possible reversals. The increasing volumes indicate the presence of large investors and therefore determine the reliability of the candle under observation
重要なお知らせ – ライセンスとアクティベーションが必要です ======================================================== アクティベーション手順: ご購入完了後、直ちに当社までご連絡いただき、ライセンスキー、パスワード、またはアクティベーション詳細をお受け取りください。これらがないとソフトウェアは動作しません。スムーズなアクティベーションプロセスを保証し、ご質問にお答えいたします。 --- Volume Delta Profile V2 Enhanced ================================ プロフェッショナルな出来高・デルタ分析ツール -------------------------------------------- 概要 ---- **Volume Delta Profile** は、従来の出来高プロファイル分析と高度なデルタおよびインバランス検出を組み合わせたプロフェッショナルグレードの分析ツールです。この総合的なインジケーターは、トレーダーに市場ダイナミクスの詳細なビュ
ドンチャン時間同期アナライザーは、 従来のドンチャンチャネル分析に強力な マルチタイムフレーム 分析機能を追加し、トレーダーは5つの異なるチャート期間にわたって トレンドの強さ と潜在的な 反転シグナル を同時に監視できます。この高度なインジケーターは、選択したタイムフレームにおける最高値と最低値を算出し、複数のタイムホライズンにおけるトレンドの方向の収束を特定するのに役立つ 明確な視覚的シグナル を生成します。分単位から時間単位までの統合分析を提供することで、単一タイムフレームツールよりも深い市場洞察を提供し、トレーダーが 重要なブレイクアウトを確認し 、タイムフレーム確認を通じて 偽シグナルを回避するのに 役立ちます。 コア機能 この洗練されたツールは、実績のある ドンチャンチャネル戦略を 複数の時間枠に同時に適用し、同期したシグナルをプロットすることで、短期的な価格変動が長期的なトレンドと一致しているかどうかを明らかにします。システムは、選択した時間枠において、価格が重要なサポートレベルまたはレジスタンスレベルを突破すると、別のインジケーターウィンドウに色分けされた矢印を生成し
Introducing PivotWave – your ultimate trading companion that redefines precision and market analysis. Designed with traders in mind, PivotWave is more than just an indicator; it’s a powerful tool that captures the pulse of the market, identifying key turning points and trends with pinpoint accuracy. PivotWave leverages advanced algorithms to provide clear visual signals for optimal entry and exit points, making it easier for traders to navigate volatile market conditions. Whether you are a begin
IC Flat Pro The True Math
Aruncharan Ganapathy Sivakumar
IC FLAT PRO – THE TRUE MATH   Early Adopter Pricing Secure IC FLAT PRO – THE TRUE MATH at the current launch price. Once the first 10 purchases  have been sold, the price will increase by USD 300 . Institutional-Grade Market Structure Analysis for MetaTrader 5 IC FLAT PRO – THE TRUE MATH is a premium institutional-grade market structure indicator developed for serious traders who demand precision, consistency, and high-quality trade opportunities. Built using advanced mathematical algorithms
累積出来高デルタ(CVD)インジケーター(およびそれに関連する出来高デルタ・ローソク足)は、出来高ベースのオーダーフロー・インジケーターの一種です。 一般的な出来高インジケーターが単に取引の総量を示すのに対し、CVDは市場における買い圧力と売り圧力の正味の差(ネット差)を具体的に測定します。 その仕組みは以下の通りです。 出来高デルタ(ローソク足):各ローソク足において、成行買い注文(アスク価格で約定した取引)と成行売り注文(ビッド価格で約定した取引)の差を測定します。デルタがプラスであれば積極的な買い手が主導権を握っており、マイナスであれば積極的な売り手が優勢であったことを示します。 累積出来高デルタ(ライン/ヒストグラム):CVDは、個々のローソク足のデルタを時間の経過とともに積み上げ(合算し)、より大きなトレンドを示します。 テクニカル分析における主な用途: オーダーフローとセンチメントの把握:価格変動の「内部」を観察し、買い手と売り手のどちらが実際にその動きを主導しているかを確認できます。 ダイバージェンスの検出:モメンタムやダイバージェンスを分析するツールとし
PaintPatternCandle - The Most Advanced Candlestick Pattern Indicator on the Market Detailed Description (300+ Lines) What is PaintPatternCandle? PaintPatternCandle is a revolutionary indicator for MetaTrader 5 that automatically identifies and colors 13 candlestick patterns in real time. Developed by ETHERNAL, it transforms your technical analysis into an intuitive visual process, highlighting buy and sell opportunities with vibrant colors. Unique Features 13 Recognized Patterns: E
Launch price: 30 USD - price will increase after the first purchases, so early buyers lock in this rate. Multi Anchor VWAP lets you place a Volume Weighted Average Price line starting from any candle you choose, instead of only resetting automatically at the start of a session, day, week or month. How it works: press the H or L button, then click the candle you want to anchor to, or use the Up and Down arrow keys to move to it and confirm with Enter. The VWAP line starts exactly at that candle
This indicator provides an original mix of WPR, VSA, and volume delta. It shows ratio of buy/sell volumes scaled on 100% range based on total volume change for a selected period. The convetional VSA (Volume Spread Analysis) studies interconnections of price action and volume change in absolute values, whereas WPR (Williams Percent Range) offers a convenient approach of price moves normalization into the fixed percentage metric: 0 - 100%. Hence overbough and oversold states are easily spotted. N
Delta + CVD & CVD Candles Order-flow indicator combining Delta (Ask–Bid), Cumulative Volume Delta (CVD), and a unique CVD-based synthetic candle system. Shows buy/sell pressure, volume aggressiveness, and momentum shifts with optional Delta histogram, CVD line, and CVD+Delta combined candles. Useful for scalping, intraday trading, divergence detection, and understanding buyer/seller dominance. Overview The Delta + CVD & CVD Candles Indicator combines multiple order-flow tools into one clean
Volume Profile は、プロや機関投資家が使用する最も強力な分析ツールの1つです。画面の下部に取引が行われた時期のみを表示する従来のボリュームインジケーターとは異なり、Volume Profile はそれらの取引がどの価格レベルで行われたかを正確に表示します。これにより、市場構造の明確なX線ビジョンが得られ、スマートマネー (smart money) や機関投資家がどこでポジションを蓄積または分配しているかを正確に確認できます。 Volume Profile が機関投資家の注文と Support/Resistance を検出する方法 このインジケーターは、価格スケールに対してボリュームを水平にプロットすることで、実際の過去のトランザクションに基づいて真の需要と供給のゾーンを自然に明らかにします。標準的な Volume Profile のルールに基づいて、市場を読み取る方法は次のとおりです。 Point of Control (POC): これは、選択した期間内で最も取引量が多い特定の価格レベルです。POC は、買い手と売り手の両方が受け入れた最も公正な価格を表します。機関投資
MT5用ボリュームプロファイルVPVR ボリュームプロファイルVPVRは、高度なボリュームプロファイル(可視範囲)をチャート上に直接再現する、強力で高性能なMetaTrader 5インジケーターです。取引活動が集中している場所を視覚化することで、市場構造を深く理解し、トレーダーが重要な価格レベルを正確に特定するのに役立ちます。 このインジケーターは、価格レベルごとのボリューム分布を動的に分析し、詳細なヒストグラムをチャート上に直接表示します。これにより、市場の受容ゾーン、拒否ゾーン、流動性クラスターを一目で把握できます。 主な機能 • 可視範囲モードと固定範囲モード VPVR(可視ローソク足に合わせて自動調整)と、より精密な分析のための独自のカスタム範囲をシームレスに切り替えられます。 • ポイントオブコントロール(POC) 取引量が最も多い価格レベル(市場の関心度が最も高いレベル)を自動的に検出し、ハイライト表示します。 • バリューエリア(VAH / VAL) 設定可能なパーセンテージ(デフォルト70%)に基づいてバリューエリアの高値と安値を表示し、適正価格帯を
The MarketProfileTPO indicator for MetaTrader 5 is a powerful tool designed to bring the Market Profile concept, based on Time Price Opportunity (TPO) analysis , directly onto your main chart window. This indicator calculates and displays the price distribution over a specified period, highlighting key areas of market activity and concentration. It is particularly optimized for high-volatility instruments like NAS100, US30, and XAUUSD when used on the M1 (1-minute) timeframe, offering a detailed
Time and Sales Tick
Pablo Filipe Soares De Almeida
Time & Sales Tick Indicator は、MetaTrader 5チャート上でリアルタイムのティック情報を表示するインジケーターです。 価格、ティック出来高、時刻を視覚的に確認でき、市場の動きを細かく分析することが可能です。 機能 価格、出来高、時間を含むティックデータをチャート上の専用パネルにリアルタイム表示します。 ティックをユーザーが設定した間隔でグループ化し、上昇ティックは緑色、下降ティックは赤色で色分け表示します。 パネルはチャートの4隅の任意の位置に配置でき、サイズや透明度の調整も可能です。 MetaTrader 5のすべてのシンボルおよびタイムフレームで使用可能で、軽量かつ安定した動作を実現しています。 このインジケーターは、スキャルピングや短期分析に特に適しています。
Price Volume Trend (PVT) Oscillator Description:  The PVT Oscillator is a volume indicator that serves as an alternative to the standard On-Balance Volume (OBV). While ordinary volume indicators can be noisy and hard to read, this tool converts volume flow into a clear Histogram Oscillator, similar to a MACD, but for Volume. It is designed to detect first  Trend Reversals and Divergences by analyzing the difference between a Fast and Slow PVT moving average. Why is this better than standard OBV?
FREE
Do you use volume in your reading of the market? Certainly many traders use it, and do not imagine operating without it. The Color Histogram Volume Set indicator allows the user to choose the value that he considers interesting to monitor. When you pass this you will have visual confirmation and if you want you will also have the audible alert that is given by the indicator. Of course, there are other ways to try to find a high volume, such as assessing whether the volume is above av
Volume Profile for MetaTrader 5 Price movement alone does not explain where the market is actually traded . What matters is where volume is built and how these areas shift over time. This Volume Profile displays the volume distribution directly on the chart , making it clear which price levels were accepted by the market and where rejection occurred. This allows structurally relevant zones to be identified and integrated into individual decision-making processes. The tool is designed for high pe
Volume Profile Canvas - Professional Volume Profile Indicator for MetaTrader 5 DESCRIPTION Volume Profile Canvas is a professional volume profile indicator for MetaTrader 5 that renders directly on the chart using a high-performance Canvas engine. It calculates and displays the volume distribution across price levels, identifying the Point of Control (POC), Value Area High (VAH) and Value Area Low (VAL) in real time. This is a pure analysis tool. It does not trade. It gives you an instant vi
The professional tool of stock traders in now available on MetaTrader 5 . The Actual depth of market chart indicator visualizes the depth of market in the form of a histogram displayed on a chart, which refreshes in the real-time mode. Meet new updates according to user requests! Now Actual Depth of Market indicator displays the current ratio of volume of buy and sell requests (B/S ratio). It shows the share of volume of each type of requests in the entire flow of requests as well as the absolu
Delta Aggression Volume PRO is an indicator developed to monitor the strength and continuity of the aggression volume of sell and buy negotiations. Note: This indicator DOES NOT WORK for Brokers and/or Markets WITHOUT the type of aggression (BUY or SELL). Cryptocurrencies and Forex do not provide this type of data, that is, it does not work with them. O Delta Agrression Volume PRO has features that allow you to view beyond the delta volume of the day. Operation Multi symbols  (those who provid
WaveTrend Oscillator MT5は、モメンタムの変化や潜在的なトレンドの反転を特定することで、市場分析を強化するために設計された強力なトレーディングインジケーターです。すべてのレベルのトレーダーに最適で、このツールはforex、暗号通貨、商品など、さまざまな市場における買われすぎや売られすぎの状況に関する貴重な洞察を提供します。 正確な売買シグナルを生成する能力を持つWaveTrend Oscillator MT5は、トレーダーが情報に基づいた意思決定を行うことを可能にし、短期および長期のトレーディング戦略の成功の可能性を効果的に高めます。 MQL製品のインストールガイド | MT4/MT5で購入したMQL製品の更新 | 一般的なトラブルシューティングガイド | インジケーター設定 / ガイド 主な機能 バッファ統合: インジケーターの値をアクセス可能なバッファとして公開し、Expert Advisorがシグナルベースのトレーディング戦略を利用できるようにします。 迅速かつバックテスト可能: MetaTraderのネイティブOnCalculate()エンジンに基づいて構
このプロダクトを購入した人は以下も購入しています
Trend Sniper X
Sarvarbek Abduvoxobov
4.9 (42)
Trend Sniper X は、トレードの方向性と潜在的な反転ポイントを明確かつ正確に特定するのに役立つ、MetaTrader 5 用のマルチタイムフレーム・トレンドフォロー指標です。 MT4用: https://www.mql5.com/en/market/product/193245 価格情報: 現在の価格はプロモーション価格であり、今後のアップデートや新機能のリリースに伴い変更される場合があります。 ボーナス特典: このインジケーター用の無料自動売買アシスタントEAを入手するには、購入後に an 著者(開発者)へメッセージをお送りください。 Code2Profit チャンネル マルチタイムフレーム分析で相場をマスターしよう! Trend Sniper X で勝率を最大化する方法:重要なルールとセッションのコツ 技術仕様 プラットフォーム MetaTrader 5 インジケータータイプ マルチタイムフレーム・トレンドインジケーター 操作タイムフレーム あらゆるチャートタイムフレームに対応。個別に選択可能な上位タイムフレーム (M1–MN1) を搭載 主要銘柄 FX、ゴールド (X
Smart Trend Trading System — MetaTrader 5 ご購入後、MQL5で私にメッセージをお送りいただくと、Smart Universal Expert Advisorを無料で受け取れるほか、オンライン講座、PDFマニュアル、非公開グループへのアクセスもご利用いただけます。 STTSは、トレンドの方向、エントリー・決済シグナル、反転ゾーン、重要な価格水準をチャート上にまとめて表示します。システムを参考に手動で取引することも、別の対応EAを接続し、ご自身で選んだ設定に基づいて自動売買することもできます。 ひとつのシステム、4つのトレードアプローチ STTSのトレードアプローチは、大きく4つのカテゴリーに分かれています。 • スキャルピング — 短期的なシグナルや相場の動きを捉えます。 • トレンドトレード — 方向性を評価し、トレンド内の機会を探します。 • 反転トレード — 反転の可能性があるゾーンや方向の変化を見つけます。 • 出来高トレード — 出来高に基づく情報を使い、市場の活発さを評価します。 エントリー・決済の矢印、トレンド情報、サポート・
SuperScalp Pro
Van Minh Nguyen
4.56 (36)
SuperScalp Pro - Professional Multi-Layer Confluence Scalping System SuperScalp Proは、クラシックなSupertrendに複数のインテリジェントな確認フィルターを追加した、高度なスキャルピングインジケーターです。より高い確率が期待できるBuy/Sellの取引機会を特定し、ダマシのシグナルを大幅に減らすことをサポートします。 明確なBuyとSellの矢印がチャート上に直接表示され、ATRに基づくStop LossとTake Profitのレベルがリアルタイムで自動計算されます。 購入後、設定方法や推奨設定についてのサポートが必要な場合は、私にご連絡ください。 SuperScalp Pro Auto Traderを使用して、シグナルを簡単に自動化できます: [Auto Trader] 推奨設定ファイルをダウンロード: [Set File] 完全なドキュメントは製品ブログでご覧いただけます: [User Guide] 最新情報を受け取るには公式チャンネルに参加してください: [Official Channel]
M1 SNIPER は使いやすいトレーディングインジケーターシステムです。M1時間足向けに設計された矢印インジケーターです。M1時間足でのスキャルピングのためのスタンドアロンシステムとして、また既存のトレーディングシステムの一部としても使用できます。このトレーディングシステムはM1時間足での取引に特化して設計されていますが、他の時間足でも使用できます。元々、この手法はXAUUSDとBTCUSDの取引用に設計しましたが、他の市場においても役立つと考えています。 インジケーターのシグナルは、トレンドの方向と逆方向に取引できます。インジケーターのシグナルを利用して両方向に取引するのに役立つ特別な取引テクニックをご紹介します。この手法は、特別な動的なサポートとレジスタンスの価格帯を利用することに基づいています。 ご購入後、M1 SNIPER矢印インジケーターをすぐにダウンロードできます。さらに、M1 SNIPERツールのすべてのユーザーに、以下のスクリーンショットに表示されているApollo Dynamic SRインジケーターを無料で提供しています。この2つのインジケーターを組み合わせることで
伝説が帰ってきました:Entry Points Pro 10。 MQL5 Marketのトップ3に3年間入り続けた伝説的インジケーターの再始動です。 2つのバージョンで合計589件の高評価レビュー、毎日数千人のトレーダーが実際のトレードに使用し、デモのダウンロードは31,000件以上   MT4+MT5 。 私はこの5年間に寄せられたレビューをすべて読み、約束を並べる代わりに、その答えをバージョン10に組み込みました。1999年から相場に携わり、 誠実さ、自らの評判、そして顧客を大切にする 作者による製品です。 Entry Points Proのエントリーシグナルは、リペイント(再描画)を一切行いません。 そして今回初めて、これは作者の言葉ではなく検証可能な事実になりました。確定シグナルはローソク足の終値確定後にのみ表示され、自動テストで リペイントはゼロ と確認されています(EURUSD、XAUUSD、BTCUSDで2,486,568回の不変条件チェック、違反0件)。検証方法は公開されており、ストラテジーテスターでご自身で再現できます。 ご購入後は、必ずすぐにダイレクトメッセージでご
Adaptive Price Action Engine インジケーターを購入すると、EAが無料に マルチタイムフレーム対応・自己最適化トレンド&ローソク足パターン分析 市場環境は常に変化しており、すべてのPrice Actionパターンが、あらゆる市場環境で同じ価値を持つわけではありません。 Adaptive Price Action Engine は、変化する市場環境への適応を目的として、 トレンド構造、マルチタイムフレーム分析、ローソク足パターン、統計的最適化 を1つの分析フレームワークに統合しています。 2つのアダプティブモード Dual Alpha Trend Mode 低い時間足と高い時間足のAlpha Trendパラメータを自動的に探索し、直近の市場動向に合わせてトレンド判定を適応させます。 Candlestick + Alpha Mode Alpha Trendによる市場レジーム判定と、 22種類の強気・弱気ローソク足パターン を組み合わせます。すべてのパターンを同じように扱うのではなく、さまざまなパターンの組み合わせを統計的に評価し、選択された市場環境において過去
Auto Optimized SpeedAngle は、継続的なウォークフォワード最適化(WFO:Walk-Forward Optimization)によりカーブフィッティング(過剰最適化)を排除した、機関投資家レベルのモメンタムベクトルシステムです。市場レジームの変化時に効果が低下する静的な入力に依存せず、アウトオブサンプル(OOS)検証を用いてパラメーターを動的に再キャリブレーションすることで、表示されるシグナルが単なる過去の偶然ではなく、確実な統計的優位性に基づいていることを保証します。 主な機関投資家向けフレームワーク ウォークフォワード最適化エンジン: ルックバック期間やしきい値の数千に及ぶ組み合わせを継続的にスキャンし、データをインサンプルとアウトオブサンプルに厳格に分離します。未検証のデータ環境において数学的優位性が証明された場合にのみ、新しいパラメーター設定を採用します。 定量的目的関数: 単なる純利益の追求ではなく、機関投資家レベルの安定性指標をターゲットとします。システム品質ナンバー(SQN)、期待値(1トレードあたりの平均Rマルチプル)、またはネットRの最適化を選
Neuro Poseidon is a new indicator by Daria Rezueva. It combines precise trading signals with adaptive TP/SL levels - creating best possible trades as a result! Message me and get  Neuro Poseidon Assistant  as a gift to automize your trading process! What makes it stand out? 1. Proven profitability on all assets and timeframes 2. Only confirmed BUY and SELL signals present on the chart 3. Adaptive TP & SL levels generated by the software for each trade 4. Easy to understand - suitable for al
ARIPoint
Temirlan Kdyrkhan
1 (4)
ARIPoint is a powerful trading companion designed to generate high-probability entry signals with dynamic TP/SL/DP levels based on volatility. Built-in performance tracking shows win/loss stats, PP1/PP2 hits, and success rates all updated live. Key Features: Buy/Sell signals with adaptive volatility bands Real-time TP/SL/DP levels based on ATR Built-in MA Filter with optional ATR/StdDev volatility Performance stats panel (Success, Profit/Loss, PP1/PP2) Alerts via popup, sound, push, or email Cu
「Scalper Vault」は、デイトレードで安定した成果を目指すトレーダーのために設計された、強力かつ充実した機能を備えたトレーディングシステムです。 この高精度なインジケーターは、それ単体で完結するトレーディングシステムとして機能し、FXやバイナリーオプションのトレーダーに、機関投資家レベルの分析を提供します。 ご購入後、ぜひご連絡ください。 トレードのヒントに加え、豪華なボーナスをプレゼントいたします! 「Scalper Vault」を活用すれば、勘に頼った判断や複雑な手動分析は不要です。使いやすいトレード手法に集中し、純粋に「エントリー・決済」という実行フェーズに専念できます。 高精度なトレンドフォロー・シグナル:中核となるアルゴリズムが市場構造を分析し、主要なトレンド方向に沿った高確率なシグナルを提示します。これにより、誤ったエントリーを大幅に削減できます。 精度の高い天井・底の検知:市場の勢いが尽きたポイントをスキャンし、反転の可能性が高いゾーンを特定します。 ギャン(Gann)理論に基づく売買ゾーン:数学的な「ギャン・レベル」を自動的にチャート上に描画します。機関投資
Gann Made Easy   は、ミスター・ギャンの理論を使用した取引の最良の原則に基づいた、プロフェッショナルで使いやすい外国為替取引システムです。 W・D・ガン。このインジケーターは、ストップロスとテイクプロフィットレベルを含む正確な買いと売りのシグナルを提供します。 PUSH通知を利用して外出先でも取引可能です。 ご購入後、取引方法の説明と優れた追加インジケーターを無料で入手するには、私にご連絡ください! おそらく、ギャンの取引手法についてはすでに何度も聞いたことがあるでしょう。通常、ギャンの理論は初心者のトレーダーだけでなく、すでにある程度の取引経験がある人にとっても非常に複雑なものです。なぜなら、ギャンの取引手法は理論的にはそれほど簡単に適用できるものではないからです。私はその知識を磨き、最良の原則を私の外国為替インジケーターに組み込むために数年を費やしました。 このインジケーターは非常に簡単に適用できます。必要なのは、それをチャートに添付し、簡単な取引推奨事項に従うだけです。このインジケーターは常に市場分析の仕事を行い、取引の機会を探します。適切なエントリーポイントを検
トレンドキャッチャーインジケーター トレンドキャッチャーインジケーターは、開発者独自の適応型トレンド分析指標を組み合わせることで、市場価格の動きを分析します。短期的なノイズを除去し、根底にあるモメンタムの強さ、ボラティリティの拡大、価格構造の挙動に焦点を当てることで、真の市場方向性を特定します。また、移動平均線、RSI、ボラティリティフィルターなどの平滑化およびトレンドフィルタリング機能を備えたカスタマイズ指標も使用します。 実際の運用状況のモニタリングやその他の製品については、こちらをご覧ください: https://www.mql5.com/en/users/mechanic/seller ご注意ください。私はTelegramでEAや設定を販売していません。詐欺です。すべての設定はブログで無料で公開しています。 重要!ご購入後すぐにご連絡ください。手順とボーナスをお送りします!
トレーダーの皆さん、こんにちは! 多くの個人トレーダーは、動作の遅いウェブスクリプトに頼っています。真の収益性を実現するには、体系化されたフレームワークが必要です。 Astro AIインジケーターは、一般的なチャートオーバーレイではありません。これは、ターミナル上で直接動作する2つのエージェントを含む、コンパイル済みのニューラルネットワークです。 システムの具体的な技術は以下のとおりです。 1. エージェント1:アナリスト(グラフィカルニューラルネットワーク - GNN) 市場は孤立した価格バーではなく、相互に連結されたデータネットワークです。 機能:エージェント1は、グラフィカルニューラルネットワークを使用して、これらの複雑で非線形な関係をマッピングします。 利点:一般的なインジケーターは過去の移動平均しか考慮しませんが、当社のGNNは市場の深い構造的関係をリアルタイムで処理し、個人トレーダーの取引量が大きな影響を与える前に、隠れた相関関係を明らかにします。 2. エージェント2:エグゼキューター(近接戦略最適化 - PPO) パターン認識は、戦いの半分に過ぎません
このインジケーターを購入された方には、以下の特典を 無料 で提供しています: 各トレードを自動で管理し、ストップロスとテイクプロフィットを設定し、戦略ルールに基づいてポジションを決済する補助ツール 「Bomber Utility」 様々な銘柄に合わせたインジケーターの設定ファイル(セットファイル) 「最小リスク」、「バランスリスク」、「待機戦略」 の3つのモードで使用できる Bomber Utility 用の設定ファイル このトレーディング戦略をすぐに導入・設定・開始できる ステップバイステップのビデオマニュアル ご注意: 上記の特典を受け取るには、MQL5のプライベートメッセージシステムを通じて販売者にご連絡ください。 オリジナルのカスタムインジケーター 「Divergence Bomber(ダイバージェンス・ボンバー)」 をご紹介します。これは、MACDのダイバージェンス(乖離)戦略に基づいた 「オールインワン」型のトレーディングシステム です。 このテクニカルインジケーターの主な目的は、価格とMACDインジケーターの間に発生するダイバージェンスを検出 し、将来の価格の動きを示
Entry In The Zone and SMC Multi Timeframe is a real-time market analysis tool based on Smart Money Concepts (SMC), designed to analyze market structure, price direction, and key trading zones. It supports both Single-Timeframe and Multi-Timeframe Analysis, providing a clearer view of overall market structure across multiple timeframes, with real-time BUY / SELL signals designed with a strict focus on No-Repaint principles. The signals are designed to help filter unclear setups and evaluate tradi
PainX GainX Blue Spike Fusion AI Advanced Synthetic Index Spike Detection Indicator for MetaTrader 5 Discover potential spike setups with a clear, organized, and professional trading interface. PainX GainX Blue Spike Fusion AI is a specialized indicator designed for traders who monitor synthetic indices and want a structured way to observe potential price spike opportunities. The indicator combines signal monitoring, market-condition analysis, visual alerts, and event tracking in one convenient
Volatility Master for MetaTrader is a real-time dashboard tool that scans up to  50 symbols  to identify high-volatility , trending markets instantly. With bullish/bearish signals, customizable alerts, and a user-friendly interface, it helps you avoid range-bound conditions and focus on high-probability trades. Clarity leads to confidence. Trade confidently and protect your capital effectively with this powerful dashboard. We don't offer free or bonus indicators in exchange of reviews from you.
Unix Scalper — MetaTrader 5 ご購入後、MQL5で私にメッセージをお送りいただくと、Smart Universal Expert Advisorを無料で受け取れるほか、オンライン講座、PDFマニュアル、非公開グループへのアクセスもご利用いただけます。 セットアップを見つけ、取引プランを確認し、取引方法を選ぶ。 UNIX Scalperは、市場分析、BUY/SELL/WAITの判断、Entry、Stop Loss、TP1、TP2の水準を、見やすいパネルにまとめています。 シグナルと取引プランを確認 • 明確な判断:BUY、SELL、WAIT。 • 明示された水準:Entry、Stop Loss、TP1、TP2。 • 複数時間足の一覧:パネル上で各時間足のシグナルを比較。 • 判断を支える分析:トレンド、モメンタム、出来高、ボラティリティ、サポートとレジスタンス、市場の質。 • 選べるレイアウト:Minimized、Compact、Standard、Full。 シグナルと各水準を確認し、そのセットアップがご自身の取引ルールに合うか判断してください。 ゴール
Atomic Analyst — MetaTrader 5 ご購入後、MQL5で私にメッセージをお送りいただくと、Smart Universal Expert Advisorを無料で受け取れるほか、オンライン講座、PDFマニュアル、非公開グループへのアクセスもご利用いただけます。 Atomic Analystは、プライスアクション、トレンドの方向、エントリー・決済シグナル、損切り水準、複数の利確水準をチャート上にまとめて表示します。 シグナルを確認し、取引の状況を理解する Atomic Analystは、分析結果をわかりやすい視覚情報として表示します。 • エントリーの候補を見つけるための買い・売りの矢印。 • 取引計画に役立つ損切り水準と複数の利確水準。 • 市場の方向性を評価するトレンド、強さ、モメンタムの指標。 • より広い市場背景を比較する複数時間足の分析。 • 変化する状況を追うための色分けされたローソク足とアラート。 シグナルと補助分析を併せて確認し、その取引機会がご自身のルールに合うかを判断してください。 短期の取引機会から、より大きな値動きまで Atomic A
FiboSniper Pro – Multi-Filter Fibonacci System with Auto SL/TP and Control Panel FiboSniper Proは、動的なFibonacci Envelopesと複数の確認フィルターを組み合わせ、選別されたBuyおよびSellシグナルを生成するテクニカルインジケーターです。FibonacciレベルはMoving AverageとATRを基に計算され、その後ADX、EMA、RSI、ATR、Volume、Time、Candle構造によってフィルタリングされます。インジケーターは、ATRに基づく自動Stop LossおよびTake Profitレベルをチャート上に直接表示し、さらに迅速な調整が可能なインタラクティブControl Panelを提供します。 購入後、推奨設定ファイルと詳細な使用方法については、私にご連絡ください。 Auto Trader Xを使用してFiboSniper Proのシグナルを自動化できます: [Auto Trader X] User GuideとSet Files: [Click her
Quantum TrendPulse を ご紹介します。これは、   SuperTrend   、   RSI   、および Stochastic のパワーを 1 つの包括的なインジケーターに組み合わせて、取引の可能性を最大限に引き出す究極の取引ツールです。精度と効率を求めるトレーダー向けに設計されたこのインジケーターは、市場のトレンド、勢いの変化、最適なエントリー ポイントとエグジット ポイントを自信を持って特定するのに役立ちます。 主な特徴: SuperTrend 統合: 現在の市場動向に簡単に追従し、収益性の波に乗ることができます。 RSI精度: 買われすぎと売られすぎのレベルを検出し、市場の反転のタイミングに最適で、SuperTrendのフィルターとして使用されます。 確率的精度: 確率的振動を活用して、変動の激しい市場で隠れたチャンスを見つけます。SuperTrend のフィルターとして使用されます。 マルチタイムフレーム分析:   M5 から H1 または H4 まで、さまざまなタイムフレームで市場を常に把握します。 カスタマイズ可能なアラート: カスタム取引条件が満たされ
現在33%オフ 初心者にもエキスパートトレーダーにも最適なソリューション このインジケーターは独自の機能と新しい公式を多数内蔵しており、ユニークで高品質かつ手頃な取引ツールです。このアップデートでは、2つの時間枠ゾーンを表示できるようになります。より長いTFだけでなく、チャートTFとより長いTF(ネストゾーンを表示)の両方を表示できます。すべてのSupply Demandトレーダーの皆さんのお気に召すはずです。:) 重要情報の公開 Advanced Supply Demandの可能性を最大化するには、 https://www.mql5.com/ja/blogs/post/720245 にアクセスしてください。   エントリーまたはターゲットの正確なトリガーポイントを正確に特定できれば取引がどのように改善されるか想像してみてください。新しい基盤となるアルゴリズムに基づいて構築されているため、買い手と売り手の間の潜在的な不均衡をさらに簡単に特定できます。これは、最も強い需要と供給のゾーンと、過去のパフォーマンス(古いゾーンを表示)がグラフィカルに表現されるためです。これらの機能は、最適な
FX Power: 通貨の強弱を分析して、より賢い取引を実現 概要 FX Power は主要通貨と金の実際の強弱をあらゆる市場状況で理解するための必須ツールです。強い通貨を買い、弱い通貨を売ることで、 FX Power は取引の意思決定を簡素化し、高い確率の取引機会を見出します。トレンドを追従する場合でも、極端なデルタ値を使用して反転を予測する場合でも、このツールはあなたの取引スタイルに完全に適応します。ただ取引するだけではなく、 FX Power で賢く取引をしましょう。 1. なぜ FX Power がトレーダーにとって非常に有益なのか 通貨と金のリアルタイム強弱分析 • FX Power は主要通貨と金の相対的な強弱を計算し、マーケットダイナミクスに関する明確な洞察を提供します。 • どの資産がリードしているか、または後れを取っているかを監視して、取引するペアを賢く選びましょう。 マルチタイムフレームの包括的なビュー • 短期、中期、長期のタイムフレームで通貨と金の強弱を追跡し、マーケットトレンドに基づいて取引戦略を調整できます。 • スキャルピングからスイングトレード
発見が困難で頻度が少ないため、分岐は最も信頼できる取引シナリオの1つです。このインジケーターは、お気に入りのオシレーターを使用して、通常の隠れた分岐点を自動的に見つけてスキャンします。 [ インストールガイド | 更新ガイド | トラブルシューティング | よくある質問 | すべての製品 ] 取引が簡単 通常の隠れた発散を見つけます 多くのよく知られている発振器をサポート ブレイクアウトに基づいて取引シグナルを実装します 適切なストップロスおよび利益レベルを表示します 設定可能なオシレーターパラメーター カスタマイズ可能な色とサイズ バー単位でサイズ別に分岐をフィルタリング パフォーマンス統計を実装します 電子メール/音声/視覚アラートを実装します 幅広い市場の見通しを提供するために、異なるオシレーターを使用して、干渉なしで同じチャートにインジケーターを何度もロードできます。このインジケーターは、次のオシレーターをサポートしています。 RSI CCI MACD オスマ 確率的 勢い 素晴らしい発振器 加速器発振器 ウィリアムズパーセントレンジ 相対活力指数 特に外国為替市場では、
DayTrader PRO DayTrader PROは、ジョン・エリュース(John Ehlers)のラグuerreフィルターと強力な自動最適化エンジンを組み合わせた、高度なトレーディング・インジケーターです。固定されたパラメーターを使用するのではなく、直近の市場状況に基づいて最適な設定を自動的に検索するため、手動による絶え間ない調整をすることなく、変化する市場のボラティリティに適応できます。 本インジケーターは、明確な「買い(BUY)」および「売り(SELL)」シグナルを生成し、現在の市場ボラティリティから算出された適応型のストップロス(Stop Loss)およびテイクプロフィット(Take Profit)レベルを表示します。トレンド、効率レシオ(Efficiency Ratio)、ボラティリティ、およびローソク足フィルターが内蔵されており、精度の低いセットアップを排除し、シグナルの精度を向上させます。 リアルタイム・パフォーマンスパネルには、現在最適化されている設定、プロフィットファクター(Profit Factor)、勝率(Win Rate)、ドローダウン(Drawdown)、
Gartley Hunter Multi - An indicator for searching for harmonic patterns simultaneously on dozens of trading instruments and on all possible timeframes. Manual (Be sure to read before purchasing) | Version for MT4 Advantages 1. Patterns: Gartley, Butterfly, Shark, Crab. Bat, Alternate Bat, Deep Crab, Cypher 2. Simultaneous search for patterns on dozens of trading instruments and on all possible timeframes 3. Search for patterns of all possible sizes. From the smallest to the largest 4. All fou
FX Trend NG:次世代マルチマーケット・トレンドインテリジェンス 概要 FX Trend NG は、複数の時間足に対応したプロフェッショナル向けトレンド分析およびマーケット監視ツールです。 市場全体の構造を数秒で把握することができます。 複数のチャートを切り替える必要はありません。どの銘柄がトレンド中なのか、どこでモメンタムが弱まっているのか、そしてどの時間足で強い整合性があるのかを瞬時に確認できます。 ローンチ特別オファー – FX Trend NG を $30(6ヶ月) または $80 永久ライセンス でご利用いただけます。 すでに Stein Investments のユーザーですか? -> メッセージを送信 して、プライベートグループへアクセスしてください。 セットアップや詳細情報が必要ですか? -> Stein Investments 公式ページ をご覧ください。 1. FX Trend NG が他と異なる理由 3ステート・トレンドロジック ― Buy と Sell だけではない • 多くのインジケーターは Buy または Sell の2状態のみを表示します。
初心者やエキスパートトレーダーに最適なソリューション! このインジケーターは、独自の機能と新しい計算式を取り入れた、ユニークで高品質、かつ手頃な価格のトレーディングツールです。たった1枚のチャートで28の為替ペアの通貨強度を読み取ることができます。新しいトレンドやスキャルピングチャンスの引き金となるポイントを正確に特定することができるので、あなたのトレードがどのように改善されるか想像してみてください。 ユーザーマニュアルはこちら  https://www.mql5.com/en/blogs/post/697384 これが最初の1本、オリジナルだ! 価値のないクローンを買わないでください。 特別な サブウィンドウの矢印で強い通貨の勢いを表示 GAPがあなたのトレードを導く! 基準通貨や気配値が売られすぎ・買われすぎのゾーン(外相フィボナッチレベル)にあるとき、個別チャートのメインウィンドウに警告表示。 通貨がレンジの外側から反落した場合、プルバック/リバーサルのアラート。 クロスパターンの特別なアラート 複数の時間枠を選択可能で、トレンドを素早く確認できます。通貨強度のライン
初心者やエキスパートトレーダーに最適なソリューション! このインジケータは、独自の機能と秘密の数式を組み込んだ、ユニークで高品質かつ手頃な価格のトレーディングツールです。たった1枚のチャートで28の通貨ペアのアラートを表示します。新しいトレンドやスキャルピングチャンスの引き金となるポイントを正確に把握することができるので、あなたのトレードがどのように改善されるか想像してみてください! 新しい基本的なアルゴリズムに基づいて構築されているため、潜在的な取引の特定と確認がより簡単になります。これは、通貨の強さや弱さが加速しているかどうかをグラフィカルに表示し、その加速のスピードを測定するためです。加速すると物事は明らかに速く進みますが、これはFX市場でも同じです。つまり、反対方向に加速している通貨をペアにすれば、利益を生む可能性のある取引を特定することができるのです。 通貨の勢いを示す縦の線と矢印は、あなたの取引の指針となるでしょう。 ダイナミックマーケットフィボナッチ23レベルはアラートトリガーとして使用され、市場の動きに適応します。もしインパルスが黄色のトリガーラインに当たった場
トレンドラインプロ   市場の真の方向転換点を理解するのに役立ちます。この指標は、真のトレンド反転と主要プレーヤーが再び参入するポイントを示します。 分かりますか     BOSライン   複雑な設定や不要なノイズなしに、より長い時間足でのトレンドの変化と重要なレベルを把握できます。シグナルは再描画されず、バーが閉じた後もチャート上に残ります。 VERSION MT 4     -     RFI LEVELS PRO インジケーター と組み合わせることで、その潜在能力を最大限に発揮します。 インジケーターが示す内容: 本当の変化   トレンド(BOSライン) 一度シグナルが現れたら、それは有効です!これは、リペイント機能を持つインジケーターとの重要な違いです。リペイント機能を持つインジケーターは、シグナルを発した後、それを変更し、資金の損失につながる可能性があります。これにより、より高い確率と精度で市場に参入できます。また、矢印が現れた後、目標値(利益確定)に達するか、反転シグナルが現れるまで、ローソク足の色を変更する機能もあります。 繰り返しエントリ       主要プレーヤーの
フィルタ:
レビューなし
レビューに返信