Kinetic Barycenter MT5

KINETIC BARYCENTER MT5


First-Principles quantitative mechanics: Center of mass, Multi-Horizon price gravity and Elastic exhaustion bands
By ONDEB Labs


THE PARADIGM SHIFT: MEASURING MARKET MASS INSTEAD OF CHRONOLOGICAL TIME

Major technical indicators were conceived decades ago under the assumption that chronological time is uniform. Simple and Exponential Moving Averages (SMA, EMA) treat quiet, low-volume consolidation bars with the exact same mathematical weight as massive institutional liquidity events. The consequence is well-known to experienced traders: structural lag, false breakout whipsaws, and trend indicatoTecrs that systematically blow past statistical bounds.

Kinetic Barycenter MT5 approaches price discovery through first-principles classical physics and continuous elasticity:

  1. Volume as physical mass: Every transaction injects inertia. Price bars with dense liquidity exert gravitational attraction proportional to their volume.
  2. Continuous newtonian relaxation (Half-Life T1/2): Past volume influence decays continuously through an exponential half-life function, eliminating the abrupt, artificial step jumps common to standard rolling windows.
  3. Hooke's elasticity (Z-Score): When market price deviates from the institutional center of mass, spatial dispersion creates a quantifiable restorative tension. At statistical boundaries (absolute Z-Score >= 2.0 Sigma), liquidity thins out and volume-weighted mean reversion becomes an asymmetric risk/reward opportunity.

Operates flawlessly on any broker using standard OHLCV tick data for XAUUSD (Gold), Indices (US30, NAS100, GER40, SPX500), Forex Majors, and Cryptocurrencies. Requires zero external DLLs, no order-book subscriptions, and uses strict causal non-repainting integrity.

Core engineering and quantitative architecture


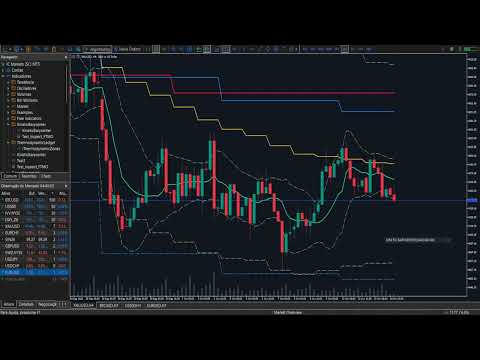
1. Multi-Horizon gravitational anchors (H1, D1, W1, MN1)
The indicator concurrently computes and projects the volume-weighted centers of mass across four operational horizons:
- MN1 (Crimson): Macro structural bedrock (monthly equilibrium anchor).
- W1 (Royal Blue): Swing trading benchmark and weekly balance point.
- D1 (Amber / Gold): Daily session fair-value center of mass.
- H1 (Spring Green): Tactical intraday microstructure line for precision entries.

2. Elastic Exhaustion Channels (+/- 1.5 Sigma to +/- 2.0 Sigma)
Dynamic standard deviation envelopes computed from volume-weighted spatial dispersion:
- Calibrated Defaults (Gold and Major Forex): The factory default setting (2.0 Sigma) is precision-calibrated for deep-liquidity institutional assets like Gold (XAUUSD), EURUSD, and GBPUSD. It pinpoints high-probability mean-reversion turning points without lag or premature entry.
- Fully Customizable for High-Volatility and Crypto: For hyper-volatile instruments with heavy-tailed distributions, such as Cryptocurrencies (BTCUSD, ETHUSD,SOLUSD) or NAS100, the sigma envelope is fully customizable via InpExhaustionSigma (e.g., expanded to 2.5 Sigma – 3.0 Sigma) to account for extreme volatility bursts and prevent premature counter-trend exposure.

3. High-Performance dark glassmorphism HUD (DearMQL5 Canvas)
A GPU-accelerated interactive dashboard rendered via native memory-buffered canvas (O(1) zero allocation on tick path):
- Real-time Z-Score: Continuous numerical readout of elastic tension.
- Proportional strain gauge: Visual progress meter mapping deformation against institutional climax thresholds.
- Multi-Timeframe confluence matrix: Instant readout of price distance (in points and sigmas) across all four horizons.
- Natural Take Profit Target: Real-time projection of the primary gravitational return target (D1 Barycenter).
- One-click toggles: Instantly show/hide exhaustion bands or mute/enable alerts directly from the chart window.
- Collapsible mini-widget: Minimize the panel into an unobtrusive title badge for multi-chart layouts.

4. Bilingual localization and dedicated File Diagnostics
- Native Bilingual Engine (InpLanguage): Instant zero-overhead switching between English (LANG_EN) and Portuguese (LANG_PT).
- Dedicated File Telemetry (InpDebugMode): Debug parameter that, when enabled, generates high-fidelity silent diagnostics logged to  MQL5\Files\KineticDebug_<Symbol>_<TF>.log with rate-limited tick profiling and NDEBUG compilation support. These logs are intended to be sent to support with Alex Hernández. 

Institutional Operational Playbooks


Playbook 1: Value retest and Polarity reversal (Day Trading M5/M15)

  • Context: A high-volume expansion bar decisively breaks the Daily (D1) or Hourly (H1) Barycenter, absorbing resting liquidity. On the initial pullback, early positioning rebalances at fair-value breakeven. Directional participants step in to defend the newly established volume-weighted benchmark.
  • Execution Context: Look for an M5 rejection candle (pin bar or engulfing) confirming that previous resistance has transitioned into dynamic support. 
  • Risk/Reward Structure: In this setup, the invalidation level (Stop Loss) is typically mapped behind the rejection wick, with the outer +/- 2.0 Sigma band acting as the primary target zone (offering a structural 1:3.0 to 1:4.0 R:R profile). 

Playbook 2: Elastic boundary mean reversion (Absolute Z-Score >= 2.0 Sigma)
  • Context: Price expands into the outer exhaustion envelope during active liquidity sessions. Spatial displacement enters statistical tail territory (> 95.4% probability boundary). Directional momentum decelerates as liquidity thins out.
  • Execution Context: Look for the first M5/../M30/H1 candle closing back within the exhaustion band, confirmed by tick volume divergence.
  • Risk/Reward Structure: Mean reversion toward the Daily Barycenter, mapping an asymmetric 1:3.5 to 1:5.0 structural R:R profile.
Playbook 3: Triple barycenter Super-Cycle Cross (Swing Trading H1/H4)
  • Context: D1, W1, and MN1 barycenters tightly compress into a narrow price corridor (Absolute Z-Score < 0.5 Sigma).
  • Mechanism: Multi-horizon consensus reaches a potential energy singularity, a structural compression that historically precedes sustained, multi-hundred-point directional expansions.
  • Trend Management Reference: The moving D1 Barycenter serves as a dynamic trailing reference as long as the hierarchical cascade ( Price > D1 > W1 > MN1 ) remains unbroken.

Complete Input parameters specification


Group 0: Language & Localization
  • InpLanguage (Default: LANG_EN): Native Bilingual Engine switching between English (LANG_EN) and Português (LANG_PT).

Group 1: Core Calibration & Newtonian Decay

  • InpD1Bars (Default: 30): Number of daily bars evaluated for D1 Center of Mass.
  • InpD1HalfLife (Default: 7.0): Exponential relaxation half-life in days for D1 memory decay.
  • InpW1Bars (Default: 26): Number of weekly bars evaluated for W1 Center of Mass.
  • InpW1HalfLife (Default: 14.0): Exponential relaxation half-life in days for W1 swing equilibrium.
  • InpMN1Bars (Default: 12): Number of monthly bars evaluated for MN1 Macro Bedrock.
  • InpMN1HalfLife (Default: 60.0): Exponential relaxation half-life in days for MN1 macro anchor (~2 months).
  • InpH1Bars (Default: 48): Number of hourly bars evaluated for H1 intraday microstructure.
  • InpH1HalfLife (Default: 1.0): Exponential relaxation half-life in hours for intraday continuous decay.
Group 2: Elastic Exhaustion Thresholds
  • InpExhaustionSigma (Default: 2.0): Outer exhaustion band multiplier (1.5σ–2.0σ for Gold/Forex; customizable to 2.5σ–3.5σ for Crypto).
  • InpClimaxSigma (Default: 3.0): Critical elastic climax threshold signaling extreme statistical depletion.

Group 3: Chart Visual Styling

  • InpShowD1 / InpColorD1 (Default: true / Gold): Visibility and color for Daily Barycenter line.
  • InpShowBandsD1 / InpColorBandsD1 (Default: true / Khaki): Visibility and color for Daily Exhaustion Bands.
  • InpShowW1 / InpColorW1 (Default: true / DodgerBlue): Visibility and color for Weekly Barycenter line.
  • InpShowBandsW1 / InpColorBandsW1 (Default: true / DeepSkyBlue): Visibility and color for Weekly Exhaustion Bands.
  • InpShowMN1 / InpColorMN1 (Default: true / Crimson): Visibility and color for Monthly Macro Bedrock line.
  • InpShowBandsMN1 / InpColorBandsMN1 (Default: true / Tomato): Visibility and color for Monthly Exhaustion Bands.
  • InpShowH1 / InpColorH1 (Default: true / MediumSpringGreen): Visibility and color for Hourly Intraday Barycenter line.
  • InpShowBandsH1 / InpColorBandsH1 (Default: true / PaleGreen): Visibility and color for Hourly Exhaustion Bands.
  • InpStyleBands / InpWidthBands (Default: STYLE_DASH / 1): Line style and thickness for exhaustion envelopes.

Group 4: Floating HUD Canvas (DearMQL5)
  • InpShowHud (Default: true): Master toggle for the GPU-accelerated DearMQL5 Canvas Dashboard.
  • InpHudMarginX / InpHudMarginY (Default: 30 / 35): Horizontal and vertical screen margin offset in pixels.

Group 5: Multi-Alert & Anti-Spam System

  • InpEnableAlerts (Default: true): Master switch for Pop-up, Sound, and Push Notification alerts.
  • InpAlertPopup (Default: true): Terminal modal popup dialog on signal triggers.
  • InpAlertPush (Default: false): Instant mobile Push notification to MT5 smartphone app (MetaQuotes ID).
  • InpAlertSound / InpSoundFile (Default: true / "alert.wav"): Acoustic terminal notification toggle and audio filename.
  • InpCooldownSec (Default: 60): Anti-spam interval (in seconds) between repeated alerts.
  • InpAlertOnceBar (Default: true): Restricts signal notification to a maximum of once per bar.

Group 6: Optimization & Performance
  • InpMaxHistoryBars (Default: 1000): Historical bar evaluation depth limit (0 = evaluate entire available history).
  • InpThrottleSec (Default: 5): CPU throttling constant for heavy asynchronous calculations.
Group 7: Diagnostics & Debug Mode
  • InpDebugMode (Default: false): Silent high-fidelity telemetry logged to MQL5\Files\KineticDebug_<Symbol>.log.

Algorithmic Automation: 15 Formal Buffers (iCustom Ready)


Engineered with a Clean Architecture paradigm, the indicator provides 15 standardized non-repainting data buffers accessible by any Expert Advisor or Script:

- Buffer 0 | BUFFER_BARYCENTER_D1 (Price): Daily Barycenter (Session Fair Value Anchor)
- Buffer 1 | BUFFER_BARYCENTER_W1 (Price): Weekly Barycenter (Swing Trading Equilibrium)
- Buffer 2 | BUFFER_BARYCENTER_MN1 (Price): Monthly Macro Bedrock Price
- Buffer 3 | BUFFER_UPPER_2SIGMA (Price): Upper Daily Exhaustion Band (+InpExhaustionSigma)
- Buffer 4 | BUFFER_LOWER_2SIGMA (Price): Lower Daily Exhaustion Band (-InpExhaustionSigma)
- Buffer 5 | BUFFER_ELASTIC_ZSCORE (Float): Continuous Hooke Elastic Z-Score Readout
- Buffer 6 | BUFFER_REGIME_SIGNAL (Int): Signal Code: +1 (Buy Reversal), -1 (Sell Reversal), 0 (Neutral)
- Buffer 7 | BUFFER_TARGET_TP (Price): Suggested Take Profit Gravitational Target Price
- Buffer 8 | BUFFER_UPPER_W1 (Price): Upper Weekly Exhaustion Band (+InpExhaustionSigma)
- Buffer 9 | BUFFER_LOWER_W1 (Price): Lower Weekly Exhaustion Band (-InpExhaustionSigma)
- Buffer 10 | BUFFER_UPPER_MN1 (Price): Upper Monthly Exhaustion Band (+InpExhaustionSigma)
- Buffer 11 | BUFFER_LOWER_MN1 (Price): Lower Monthly Exhaustion Band (-InpExhaustionSigma)
- Buffer 12 | BUFFER_BARYCENTER_H1 (Price): Hourly Tactical Intraday Barycenter
- Buffer 13 | BUFFER_UPPER_H1 (Price): Upper Hourly Exhaustion Band (+InpExhaustionSigma)
- Buffer 14 | BUFFER_LOWER_H1 (Price): Lower Hourly Exhaustion Band (-InpExhaustionSigma)

Dynamic Sigma Evaluation in Code:

Because the Center of Mass (c) and Dispersion (Sigma) are physical invariants of the volume ledger, an Expert Advisor can compute custom dynamic thresholds (1.6 Sigma for intraday scalps, 2.8 Sigma for swing trades) on the fly without modifying indicator inputs:

Sigma_Unit = (BufferUpper - BufferBarycenter) / InpExhaustionSigma
CustomBand = BufferBarycenter +/- (k * Sigma_Unit)

Production-grade EA Integration Sample


//+------------------------------------------------------------------+
//| Integration Sample for Expert Advisors                       |
//| Copyright 2026, ONDEB Quantitative Labs                  |
//+------------------------------------------------------------------+
#define BUFFER_BARYCENTER_D1   0
#define BUFFER_UPPER_2SIGMA     3
#define BUFFER_LOWER_2SIGMA    4
#define BUFFER_ELASTIC_ZSCORE  5
#define BUFFER_REGIME_SIGNAL    6
#define BUFFER_TARGET_TP          7

int g_kinetic_handle = INVALID_HANDLE;

int OnInit()
{
    // ------------------------------------------------------------------
    // AUTOMATIC HEADLESS ARCHITECTURE NOTE:
    // The indicator internally monitors MQLInfoInteger(MQL_TESTER).
    // When invoked by an EA during Strategy Tester backtests or genetic
    // optimizations, it automatically bypasses all DearMQL5 Canvas HUD 
    // rendering, font memory allocations, and mouse events.
    // It operates in pure headless mode (O(1) vector math) to deliver
    // maximum multi-core CPU throughput across millions of ticks.
    // ------------------------------------------------------------------
    g_kinetic_handle = iCustom(_Symbol, _Period, "KineticBarycenter");
    if(g_kinetic_handle == INVALID_HANDLE)
    {
        PrintFormat("Kinetic Barycenter initialization failed. Error: %d", GetLastError());
        return INIT_FAILED;
    }
    return INIT_SUCCEEDED;
}

void OnTick()
{
    if(g_kinetic_handle == INVALID_HANDLE) return;

    // Fast 1-bar copy of essential mathematical buffers
    double signal[1], target_tp[1], z_score[1], bary_d1[1], upper_d1[1];
    if(CopyBuffer(g_kinetic_handle, BUFFER_REGIME_SIGNAL,  0, 1, signal)    <= 0) return;
    if(CopyBuffer(g_kinetic_handle, BUFFER_TARGET_TP,      0, 1, target_tp) <= 0) return;
    if(CopyBuffer(g_kinetic_handle, BUFFER_ELASTIC_ZSCORE, 0, 1, z_score)   <= 0) return;
    if(CopyBuffer(g_kinetic_handle, BUFFER_BARYCENTER_D1,  0, 1, bary_d1)   <= 0) return;
    if(CopyBuffer(g_kinetic_handle, BUFFER_UPPER_2SIGMA,   0, 1, upper_d1)  <= 0) return;

    // Dynamic 1.6-sigma calculation for custom Intraday Scalping thresholds
    double InpExhaustionSigma = 2.0;
    double sigma_unit   = (upper_d1[0] - bary_d1[0]) / InpExhaustionSigma;
    double custom_upper = bary_d1[0] + (1.6 * sigma_unit);
    double custom_lower = bary_d1[0] - (1.6 * sigma_unit);

    // ------------------------------------------------------------------
    // NAIVE / BASELINE MEAN-REVERSION EXECUTION:
    // (Educational template. In live institutional production, pair this 
    // baseline trigger with session time filters, spread guards, and 
    // strict prop-firm risk management rules)
    // ------------------------------------------------------------------
    if(signal[0] > 0.5) // Climax Oversold: Price pierced lower band and closed back inside
    {
        PrintFormat("BUY REVERSAL: z = %.2f sigma | Natural TP = %.2f", z_score[0], target_tp[0]);
        // Open Buy position: SL below the exhaustion candle wick, TP anchored at target_tp[0]
    }
    else if(signal[0] < -0.5) // Climax Overbought: Price pierced upper band and closed back inside
    {
        PrintFormat("SELL REVERSAL: z = %.2f sigma | Natural TP = %.2f", z_score[0], target_tp[0]);
        // Open Sell position: SL above the exhaustion candle wick, TP anchored at target_tp[0]
    }
}

void OnDeinit(const int reason)
{
    // Clean up indicator handle to release terminal memory
    if(g_kinetic_handle != INVALID_HANDLE)
    {
        IndicatorRelease(g_kinetic_handle);
    }
}

Technical Support and Diagnostic protocol (InpDebugMode)


To guarantee prompt assistance in the event of unexpected behavior (such as broker history desynchronization, exotic assets with non-standard tick dimensions, or weekend network latency), Kinetic Barycenter MT5 includes a dedicated file-based structured telemetry engine via InpDebugMode = true.


Official 3-Step Support Request Procedure:

  1. Activation: Open indicator properties (F7 in MetaTrader 5), navigate to the DIAGNOSTICS & DEBUG MODE parameter group, and set InpDebugMode to true.
  2. Telemetry Capture: Allow the indicator to run on your chart forthe necessary time to capture complete initialization, multi-timeframe synchronization, live broker data feeds and reproduce your current problem.
  3. Log Retrieval: In the top menu of MetaTrader 5, click: File -> Open Data Folder -> MQL5 -> Files. Locate the diagnostic log file formatted as MQL5\Files\KineticDebug_<Symbol>_<TF>.log . Send this log file directly to Alex Hernández via private message on our official MQL5 Community profile.
What Does Debug Mode Audit?
  • Symbol Metadata: Fractional precision (Digits), minimum tick size (TickSize), and point value (Point) provided by your broker feed.
  • Multi-Timeframe Synchronization: Requested vs. delivered bar counts for H1, D1, W1, and MN1, including low-level network return codes (GetLastError()).
  • Mathematical Stability: Verification of variance floors preventing division-by-zero exceptions on abnormal tick spreads.
  • Lifecycle Telemetry: Exact deinitialization reasons (UninitializeReasonGet()) and memory stability metrics.
Strict Privacy Policy:
The diagnostic log never accesses, stores, or transmits trading account passwords, balances, equity, or personal user data. It monitors strictly mathematical telemetry between MetaTrader 5 and the calculation engine.
추천 제품
Wapv Price and volume
Eduardo Da Costa Custodio Santos
MT5용 WAPV 가격 및 거래량 표시기는 (Wyckoff Academy Wave Market) 및 (Wyckoff Academy Price and Volume) 도구 세트의 일부입니다. MT5용 WAPV 가격 및 거래량 표시기는 차트에서 거래량 움직임을 직관적인 방식으로 쉽게 시각화할 수 있도록 만들어졌습니다. 그것으로 당신은 최대 거래량의 순간과 시장이 전문적인 관심을 갖지 않는 순간을 관찰할 수 있습니다 시장이 "스마트 머니"의 움직임이 아니라 관성에 의해 움직이는 순간을 식별합니다. 사용자가 수정할 수 있는 4가지 색상으로 구성되어 있습니다. 빨간색 = 제안 증가 녹색 = 수요 증가 회색 양초 = 수요와 공급의 감소 파란색 = 스마트머니 연기 위쪽 방향으로의 움직임은 강도를 나타냅니다. 하향 움직임 약점을 나타냅니다. Price의 방향에 상관없이 가장 강한 Volume이 올라가야 합니다. R. Wyckoff의 이론에 따라 생성된 지표
VeloTicker PRO
Alexandro Matos
VeloTicker PRO — Real-Time Flow Reading VeloTicker PRO is an advanced indicator designed for traders looking to interpret market dynamics beyond just price. With an intuitive visual interface based on dual gauges (BUY vs. SELL), it transforms market flow into clear signals, enabling faster and more precise decision-making. What It Delivers Instant reading of buying and selling pressure Clear visualization in a gauge (speedometer) format Rapid response to market changes Intelligent smoot
Weis Wave Scouter
Jean Carlos Martins Roso
Weis Wave Scouter는 MetaTrader 5용으로 개발된 혁신적인 지표로, Wyckoff 방법론과 VSA(Volume Spread Analysis)의 검증된 원칙을 결합했습니다. 높은 정확성과 깊이 있는 분석을 원하는 트레이더를 위해 설계되었으며, 누적 거래량 파동 분석을 통해 시장을 전술적으로 읽고 추세 반전 및 지속의 핵심 포인트를 식별하는 데 도움을 줍니다. 이 지표는 선명한 시각적 인터페이스를 제공하며, Classic, NightVision, OceanBreeze 등 다양한 테마의 사용자 지정 가능한 색상 히스토그램을 통해 상승 및 하락 파동을 시각화합니다. 주요 기능에는 거래량 급증 감지, 낮은 활동 영역(DeadZone) 식별, 거래량 기반 파동 반전 경고 설정이 포함되어 있습니다. 또한 노력 대비 결과 분석, 원인과 결과 분석, 수요와 공급 분석 등 Wyckoff 및 VSA 이론의 핵심 요소를 지원합니다. Brick Size, Volume Scale Fact
ApeX Trade Manager MT5  →     ApeX Journal MT5  →     ApeX Indicator SMC MT5  →     ApeX Indicator ICT Concepts MT5  →     ApeX Indicator Volume Profile MT5  →    ApeX Indicator ICT Macros MT5  → One profile per session tells you about the session. One profile per swing tells you about the trade you are in. ApeX Volume Profile builds a profile for every pivot the market makes. 1. The profile Point of Control — The price where the most volume traded in that leg, optionally extended right or bo
Trade Vision Panel
Abderrahmane Benali
IMPORTANT! After your purchase, please contact me. Overview: Trade Vision Panel is a premium, lightweight trading dashboard for MetaTrader 5 designed to display your key trading information directly on the chart. It combines performance analytics, open-position monitoring, and a real-time news filter — all in one smart, elegant interface. Perfect for traders who want to see everything
Volume Candle Indicator
Pablo Filipe Soares De Almeida
MetaTrader 5용 볼륨 컬러 히스토그램 지표 이 지표는 거래량을 별도의 창에 히스토그램 형태로 표시합니다. 각 막대는 캔들의 방향에 따라 색상이 지정되며, 종가가 시가보다 높을 경우 초록색(상승 추세), 낮을 경우 빨간색(하락 추세)으로 표시됩니다. 색상 변화를 통해 거래자는 가격 움직임과 거래량 간의 관계를 직관적으로 파악할 수 있습니다. 주요 기능 거래량 소스: 틱 볼륨 또는 실제 거래량 선택 가능. 거래량 히스토그램 위에 이동 평균선을 추가할 수 있으며, 이를 통해 거래량의 흐름을 부드럽게 시각화할 수 있습니다. 지원되는 평균 유형: SMA, EMA, SMMA, LWMA. 평균 기간은 사용자가 직접 설정 가능. 모든 종목과 차트 주기에서 완벽하게 호환되며, MetaTrader 5 플랫폼에서 안정적으로 작동합니다. 시각적으로 명확한 디자인으로 거래 결정에 필요한 정보를 빠르게 이해할 수 있습니다.
The Accumulation / Distribution is an indicator which was essentially designed to measure underlying supply and demand. It accomplishes this by trying to determine whether traders are actually accumulating (buying) or distributing (selling). This indicator should be more accurate than other default MT5 AD indicator for measuring buy/sell pressure by volume, identifying trend change through divergence and calculating Accumulation/Distribution (A/D) level. Application: - Buy/sell pressure: above
Flow Architect
Alex Amuyunzu Raymond
Flow Architect Lite - Professional Market Structure Toolkit Free Version Features: Core Structure Analysis: Daily VWAP Engine   - Volume-weighted average price for institutional level tracking Standard Deviation Bands (SD1)   - Dynamic support and resistance zones Break of Structure Detection   - Visual markers for market structure shifts Fair Value Gap Identification   - Highlighted imbalance zones on your charts ATR Volatility Context   - Real-time Average True Range measurement Clean Informat
True Weis Wave
Atila Goncalves Firmino
A version based on David Waves' description in his book 'Trade About to Happen' of his adaptation of the Wyckoff wave chart. The indicator directionally accumulates volume, adding to each brick or candle close, with color indication for up and down. it can be used it with tick or real volume, it also changes color when the accumulated value of the previous wave is exceeded, being the trade signal. Yellow color is used for doji candlestick, it will continue with accumulation without zero the sum
Volume Bars
DARIO GALLIONE
An effective indicator that highlights candles with increasing volumes, overshadowing those with shrinking volumes. Also suitable for Forex because it uses tick_volume.  You can set the colors to your liking. It will be easier to spot trends and possible reversals. The increasing volumes indicate the presence of large investors and therefore determine the reliability of the candle under observation
중요 공지 – 라이선스 및 활성화 필요 =================================== 활성화 안내: 구매 완료 후 라이선스 키, 비밀번호 또는 활성화 정보를 받으시려면 즉시 당사에 연락해 주십시오. 이 정보가 없으면 소프트웨어가 작동하지 않습니다. 저희는 원활한 활성화 과정을 보장하고 질문 사항에 대해 도움을 드리기 위해 항상 대기하고 있습니다. --- Volume Delta Profile V2 Enhanced ================================ 전문가용 거래량 & 델타 분석 도구 --------------------------------- 개요 ---- **Volume Delta Profile**은 전통적인 거래량 프로파일 분석과 고급 델타 및 불균형 탐지를 결합한 전문가급 분석 도구입니다. 이 포괄적인 지표는 트레이더에게 시장 역학에 대한 정교한 시각을 제공하며, 경매 데이터의 실시간 그래픽 표현을 통해 시간 경과에
Donchian Time Sync Analyzer는   기존 Donchian 채널 분석에 강력한   다중 시간대   기능을 추가하여 트레이더가 다섯 가지 차트 기간에 걸쳐   추세 강도   와 잠재적   반전 신호를   동시에 모니터링할 수 있도록 합니다. 이 고급 지표는 선택한 시간대의 최고가와 최저가를 계산하여 여러 시간대에 걸쳐 추세 방향의 수렴을 파악하는 데 도움이 되는   명확한 시각적 신호를   생성합니다. 분 단위부터 시간 단위까지 통합된 분석을 제공함으로써 단일 시간대 도구보다 더 심층적인 시장 통찰력을 제공하여 트레이더가   중요한 돌파를 확인   하고 시간대 확인을 통해   잘못된 신호를 피할 수 있도록   지원합니다. 핵심 기능 이 정교한 도구는 검증된   돈키안 채널 전략을   여러 시간대에 걸쳐 동시에 적용하여 단기 가격 변동이 장기 추세와 일치하는지 여부를 보여주는 동기화된 신호를 표시합니다. 이 시스템은 선택한 시간대에서 가격이 중요한 지지선 또는 저항선
PivotWave
Jeffrey Quiatchon
Introducing PivotWave – your ultimate trading companion that redefines precision and market analysis. Designed with traders in mind, PivotWave is more than just an indicator; it’s a powerful tool that captures the pulse of the market, identifying key turning points and trends with pinpoint accuracy. PivotWave leverages advanced algorithms to provide clear visual signals for optimal entry and exit points, making it easier for traders to navigate volatile market conditions. Whether you are a begin
IC Flat Pro The True Math
Aruncharan Ganapathy Sivakumar
IC FLAT PRO – THE TRUE MATH   Early Adopter Pricing Secure IC FLAT PRO – THE TRUE MATH at the current launch price. Once the first 10 purchases  have been sold, the price will increase by USD 300 . Institutional-Grade Market Structure Analysis for MetaTrader 5 IC FLAT PRO – THE TRUE MATH is a premium institutional-grade market structure indicator developed for serious traders who demand precision, consistency, and high-quality trade opportunities. Built using advanced mathematical algorithms
누적 거래량 델타(CVD) 지표(및 관련 거래량 델타 캔들)는 거래량 기반의 오더 플로우(order flow) 지표 범주에 속합니다. 일반적인 거래량 지표가 단순히 전체 거래 활동량을 보여주는 것과 달리, CVD는 시장 내 매수 압력과 매도 압력 간의 순차이(net difference)를 구체적으로 측정합니다. 세부 내용은 다음과 같습니다. 거래량 델타(캔들): 각 캔들별로 시장가 매수 주문(매도 호가인 'ask' 가격에서 체결된 거래)과 시장가 매도 주문(매수 호가인 'bid' 가격에서 체결된 거래) 간의 차이를 측정합니다. 캔들의 델타 값이 양수(+)라면 적극적인 매수세가 시장을 주도한 것이고, 음수(-)라면 적극적인 매도세가 우세했음을 의미합니다. 누적 거래량 델타(선/히스토그램): CVD는 개별 캔들의 델타 값을 시간 경과에 따라 합산하여 더 포괄적인 추세를 보여줍니다. 기술적 분석에서의 주요 활용 용도: 오더 플로우 및 시장 심리 파악: 트레이더는 가격 움직임의
PaintPatternCandle - The Most Advanced Candlestick Pattern Indicator on the Market Detailed Description (300+ Lines) What is PaintPatternCandle? PaintPatternCandle is a revolutionary indicator for MetaTrader 5 that automatically identifies and colors 13 candlestick patterns in real time. Developed by ETHERNAL, it transforms your technical analysis into an intuitive visual process, highlighting buy and sell opportunities with vibrant colors. Unique Features 13 Recognized Patterns: E
Multi Anchor VWAP
Gleidson Duca De Aguiar
Launch price: 30 USD - price will increase after the first purchases, so early buyers lock in this rate. Multi Anchor VWAP lets you place a Volume Weighted Average Price line starting from any candle you choose, instead of only resetting automatically at the start of a session, day, week or month. How it works: press the H or L button, then click the candle you want to anchor to, or use the Up and Down arrow keys to move to it and confirm with Enter. The VWAP line starts exactly at that candle
This indicator provides an original mix of WPR, VSA, and volume delta. It shows ratio of buy/sell volumes scaled on 100% range based on total volume change for a selected period. The convetional VSA (Volume Spread Analysis) studies interconnections of price action and volume change in absolute values, whereas WPR (Williams Percent Range) offers a convenient approach of price moves normalization into the fixed percentage metric: 0 - 100%. Hence overbough and oversold states are easily spotted. N
CvdDeltaVolumes
Parasbhai N Patel
Delta + CVD & CVD Candles Order-flow indicator combining Delta (Ask–Bid), Cumulative Volume Delta (CVD), and a unique CVD-based synthetic candle system. Shows buy/sell pressure, volume aggressiveness, and momentum shifts with optional Delta histogram, CVD line, and CVD+Delta combined candles. Useful for scalping, intraday trading, divergence detection, and understanding buyer/seller dominance. Overview The Delta + CVD & CVD Candles Indicator combines multiple order-flow tools into one clean
TLID Volume Profile
Robby Suhendrawan
Volume Profile은 전문 및 기관 트레이더가 사용하는 가장 강력한 분석 도구 중 하나입니다. 거래가 발생한 시간만 화면 하단에 표시하는 기존 거래량 지표와 달리 Volume Profile은 해당 거래가 발생한 정확한 가격 수준을 보여줍니다. 이를 통해 시장 구조에 대한 명확한 X-ray 뷰를 제공하여 스마트 머니(smart money)와 기관이 포지션을 축적하거나 분배하는 위치를 정확히 확인할 수 있습니다. Volume Profile이 기관 주문 및 Support/Resistance를 감지하는 방법 이 지표는 가격 척도에 대해 가로로 거래량을 플로팅하여 실제 과거 거래를 기반으로 진정한 수요 및 공급 영역을 자연스럽게 드러냅니다. 표준 Volume Profile 규칙을 기반으로 시장을 읽는 방법은 다음과 같습니다. Point of Control (POC): 선택한 기간 내에 거래량이 가장 많은 특정 가격 수준입니다. POC는 구매자와 판매자 모두가 수용하는 가장 공정한 가격
Volume Profile For MT5
Abdelkhabir Yassine Alaoui
MT5용 Volume Profile VPVR Volume Profile VPVR은 고급 거래량 프로파일(Visible Range)을 차트에 직접 표시하도록 설계된 강력하고 고성능의 MetaTrader 5 지표입니다. 거래 활동이 집중된 영역을 시각화하여 시장 구조에 대한 심층적인 통찰력을 제공하며, 트레이더가 주요 가격대를 정확하게 파악할 수 있도록 도와줍니다. 이 지표는 가격대별 거래량 분포를 동적으로 분석하고 차트에 상세한 히스토그램을 직접 표시하여 시장 수용, 거부 영역 및 유동성 밀집 지역을 한눈에 파악할 수 있도록 합니다. 주요 기능 • Visible Range 및 Fixed Range 모드 VPVR(표시되는 캔들에 따라 자동 조정) 모드와 사용자 지정 범위 모드 간에 원활하게 전환하여 더욱 정밀한 분석을 수행할 수 있습니다. • Point of Control(POC) 거래량이 가장 많은 가격대, 즉 시장의 관심이 가장 높은 가격대를 자동으로 감지하고 강조 표
The MarketProfileTPO indicator for MetaTrader 5 is a powerful tool designed to bring the Market Profile concept, based on Time Price Opportunity (TPO) analysis , directly onto your main chart window. This indicator calculates and displays the price distribution over a specified period, highlighting key areas of market activity and concentration. It is particularly optimized for high-volatility instruments like NAS100, US30, and XAUUSD when used on the M1 (1-minute) timeframe, offering a detailed
Time and Sales Tick
Pablo Filipe Soares De Almeida
Time & Sales Tick Indicator 는 MetaTrader 5 차트에서 실시간 거래 틱 정보를 표시하는 지표입니다. 가격, 틱 거래량 및 시간을 시각적으로 보여주며, 사용자가 시장 미세 구조를 분석할 수 있도록 도와줍니다. 기능 설명 가격, 거래량 및 시간을 포함한 틱 데이터를 차트 내 패널에 실시간으로 표시합니다. 틱 데이터를 사용자가 지정한 시간 또는 수량 간격으로 그룹화하고, 상승 틱은 녹색, 하락 틱은 빨간색으로 구분하여 표시합니다. 패널은 차트의 네 모서리 중 원하는 위치로 자유롭게 이동할 수 있으며, 표시 크기와 글꼴도 사용자 설정이 가능합니다. 모든 통화쌍 및 상품에 대응하며 MetaTrader 5 플랫폼 내에서 안정적으로 작동합니다. 이 인디케이터는 스캘핑 및 틱 기반 전략을 사용하는 트레이더에게 유용합니다.
Price Volume Trend (PVT) Oscillator Description:  The PVT Oscillator is a volume indicator that serves as an alternative to the standard On-Balance Volume (OBV). While ordinary volume indicators can be noisy and hard to read, this tool converts volume flow into a clear Histogram Oscillator, similar to a MACD, but for Volume. It is designed to detect first  Trend Reversals and Divergences by analyzing the difference between a Fast and Slow PVT moving average. Why is this better than standard OBV?
FREE
Color Histogram Volume Set
Ricardo Almeida Branco
Do you use volume in your reading of the market? Certainly many traders use it, and do not imagine operating without it. The Color Histogram Volume Set indicator allows the user to choose the value that he considers interesting to monitor. When you pass this you will have visual confirmation and if you want you will also have the audible alert that is given by the indicator. Of course, there are other ways to try to find a high volume, such as assessing whether the volume is above av
Volume Profile for MetaTrader 5 Price movement alone does not explain where the market is actually traded . What matters is where volume is built and how these areas shift over time. This Volume Profile displays the volume distribution directly on the chart , making it clear which price levels were accepted by the market and where rejection occurred. This allows structurally relevant zones to be identified and integrated into individual decision-making processes. The tool is designed for high pe
Volume Profile Canvas
Mauro Italo Gaspari
Volume Profile Canvas - Professional Volume Profile Indicator for MetaTrader 5 DESCRIPTION Volume Profile Canvas is a professional volume profile indicator for MetaTrader 5 that renders directly on the chart using a high-performance Canvas engine. It calculates and displays the volume distribution across price levels, identifying the Point of Control (POC), Value Area High (VAH) and Value Area Low (VAL) in real time. This is a pure analysis tool. It does not trade. It gives you an instant vi
The professional tool of stock traders in now available on MetaTrader 5 . The Actual depth of market chart indicator visualizes the depth of market in the form of a histogram displayed on a chart, which refreshes in the real-time mode. Meet new updates according to user requests! Now Actual Depth of Market indicator displays the current ratio of volume of buy and sell requests (B/S ratio). It shows the share of volume of each type of requests in the entire flow of requests as well as the absolu
Delta Aggression Volume PRO is an indicator developed to monitor the strength and continuity of the aggression volume of sell and buy negotiations. Note: This indicator DOES NOT WORK for Brokers and/or Markets WITHOUT the type of aggression (BUY or SELL). Cryptocurrencies and Forex do not provide this type of data, that is, it does not work with them. O Delta Agrression Volume PRO has features that allow you to view beyond the delta volume of the day. Operation Multi symbols  (those who provid
WaveTrend Oscillator MT5는 모멘텀 변화와 잠재적인 추세 반전을 식별하여 시장 분석을 향상시키기 위해 설계된 강력한 거래 지표입니다. 모든 수준의 트레이더에게 이상적인 이 도구는 forex, 암호화폐 및 상품을 포함한 다양한 시장에서 과매수 및 과매도 조건에 대한 귀중한 통찰력을 제공합니다. 정확한 매수 및 매도 신호를 생성할 수 있는 능력을 갖춘 WaveTrend Oscillator MT5는 트레이더가 정보에 기반한 결정을 내릴 수 있도록 하여 단기 및 장기 거래 전략 모두에서 성공 확률을 효과적으로 높입니다. MQL 제품 설치 가이드 | MT4/MT5에서 구매한 MQL 제품 업데이트 | 일반 문제 해결 가이드 | 지표 설정 / 가이드 주요 기능 버퍼 통합: 신호 기반 거래 전략을 활용할 수 있도록 지표 값을 접근 가능한 버퍼로 노출합니다. 빠르고 백테스트 가능: MetaTrader의 기본 OnCalculate() 엔진을 기반으로 구축되어 빠른 계산과 전략 테스터
이 제품의 구매자들이 또한 구매함
Trend Sniper X
Sarvarbek Abduvoxobov
4.9 (42)
Trend Sniper X 는 트레이더가 추세 방향과 잠재적 반전 지점을 명확하고 정확하게 포착할 수 있도록 도와주는 MetaTrader 5용 멀티 타임프레임 추세 추종 지표입니다. MT4용: https://www.mql5.com/en/market/product/193245 가격 정보: 현재 가격은 프로모션 할인가이며, 향후 업데이트 및 새로운 기능이 출시됨에 따라 변동될 수 있습니다. 보너스 혜택: 본 지표 전용 무료 자동매매 Assistant EA를 받으시려면 구매 후 작성자에게 메시지를 보내주시기 바랍니다. Code2Profit 채널 멀티 타임프레임 분석으로 시장을 마스터하세요! Trend Sniper X로 승률을 극대화하는 방법: 핵심 규칙 및 세션 팁 기술 사양 플랫폼 MetaTrader 5 지표 유형 멀티 타임프레임 추세 지표 운용 타임프레임 모든 차트 타임프레임 지원, 독립적으로 선택 가능한 상위 타임프레임(M1–MN1) 주요 상품 외환, 금(XAUUSD) 및 기타 C
Smart Trend Trading System — MetaTrader 5 구매 후 MQL5에서 저에게 메시지를 보내시면 Smart Universal Expert Advisor를 무료로 받으실 수 있으며, 온라인 강좌, PDF 매뉴얼 및 비공개 그룹 이용 권한도 함께 제공됩니다. STTS는 추세 방향, 진입·청산 신호, 반전 구간, 주요 가격 수준을 차트에 모아 보여줍니다. 시스템을 참고해 수동으로 거래하거나, 별도의 호환 EA를 연결하여 선택한 설정에 따라 자동으로 거래를 실행할 수 있습니다. 하나의 시스템, 네 가지 트레이딩 접근법 STTS의 트레이딩 접근법은 크게 네 가지로 나뉩니다. • 스캘핑 — 단기 신호와 시장 움직임을 살펴봅니다. • 추세 매매 — 방향을 평가하고 추세 안에서 기회를 찾습니다. • 반전 매매 — 잠재적인 전환 구간과 방향 변화를 파악합니다. • 거래량 매매 — 거래량 기반 정보로 시장 활동을 평가합니다. 진입·청산 화살표, 추세 정보, 지지·저항 수
SuperScalp Pro
Van Minh Nguyen
4.56 (36)
SuperScalp Pro - Professional Multi-Layer Confluence Scalping System SuperScalp Pro는 클래식 Supertrend에 여러 지능형 확인 필터를 추가한 고급 스캘핑 지표입니다. 더 높은 확률의 Buy/Sell 거래 기회를 식별하는 데 도움을 주며, 잘못된 신호를 크게 줄이는 데 도움을 줍니다. 명확한 Buy 및 Sell 화살표가 차트에 직접 표시되며, ATR 기반 Stop Loss 및 Take Profit 수준이 실시간으로 자동 계산됩니다. 구매 후 설정 방법 및 권장 구성에 대한 안내가 필요하시면 저에게 문의해 주세요. SuperScalp Pro Auto Trader를 사용하여 신호를 쉽게 자동화할 수 있습니다: [Auto Trader] 권장 설정 파일 다운로드: [Set File] 전체 문서는 제품 블로그에서 확인할 수 있습니다: [User Guide] 업데이트를 확인하려면 공식 채널에 참여하세요: [Official C
M1 Sniper MT5
Oleg Rodin
5 (7)
M1 SNIPER 는 사용하기 쉬운 거래 지표 시스템입니다. M1 시간대에 맞춰 설계된 화살표 지표입니다. 이 지표는 M1 시간대 스캘핑을 위한 단독 시스템으로 사용할 수 있으며, 기존 거래 시스템의 일부로도 사용할 수 있습니다. 이 거래 시스템은 M1 시간대 거래용으로 특별히 설계되었지만, 다른 시간대에도 사용할 수 있습니다. 원래는 XAUUSD와 BTCUSD 거래를 위해 이 방법을 설계했지만, 다른 시장 거래에도 유용하다는 것을 알게 되었습니다. 이 지표의 신호는 추세 방향과 반대로 거래될 수 있습니다. 저는 지표의 신호를 활용하여 양방향으로 거래할 수 있도록 돕는 특별한 거래 기법을 알려드립니다. 이 방법은 특별한 동적 지지선과 저항선 가격 영역을 활용하는 것을 기반으로 합니다. 구매하시면 M1 SNIPER 화살표 지표를 바로 다운로드하실 수 있습니다. 또한, 아래 스크린샷에 표시된 Apollo Dynamic SR 지표는 M1 SNIPER 도구를 사용하는 모든 사용자에게 무료로
Entry Points Pro for MT5
Yury Orlov
4.52 (151)
전설이 돌아왔습니다: Entry Points Pro 10. MQL5 마켓 Top-3 자리를 3년간 지켜온 전설적인 지표의 재출시입니다. 수백 개의 호평 리뷰(두 버전 합산 589개), 매일 이 지표로 거래하는 수천 명의 트레이더, 31,000회 이상의 데모 다운로드   MT4+MT5 . 지난 5년간 여러분이 남긴 리뷰를 하나도 빠짐없이 읽었고, 약속 대신 그 답을 버전 10에 담았습니다. 1999년부터 시장에서 활동하며 정직함과 자신의 평판, 그리고 고객을 소중히 여기는 개발자가 만들었습니다. Entry Points Pro의 진입 시그널은 절대 리페인팅되지 않습니다. 그리고 이번에는 개발자의 말뿐이 아니라 검증 가능한 사실입니다: 확정 시그널은 캔들 종가에서만 표시되며, 자동화 테스트에서 리페인팅 0건 이 확인되었습니다(EURUSD, XAUUSD, BTCUSD에서 2,486,568회의 불변조건 검사 — 위반 0건). 검증 방법은 공개되어 있으니 전략 테스터에서 직접 재현해 보실 수
Adaptive Price Action Engine 지표를 구매하면 EA(자동매매 프로그램)가 무료 멀티 타임프레임 기반 자기 최적화 추세 & 캔들 패턴 분석 시스템 시장은 끊임없이 변화하며, 모든 Price Action 패턴이 모든 시장 환경에서 동일한 가치를 가지는 것은 아닙니다. Adaptive Price Action Engine 은 변화하는 시장 환경에 적응할 수 있도록 설계되었으며, 추세 구조, 멀티 타임프레임 분석, 캔들 패턴 및 통계적 최적화 를 하나의 분석 프레임워크로 결합합니다. 두 가지 적응형 모드 Dual Alpha Trend Mode 낮은 타임프레임과 높은 타임프레임에서 적합한 Alpha Trend 파라미터를 자동으로 탐색하여, 최근 시장 움직임에 맞춰 추세 분석을 조정합니다. Candlestick + Alpha Mode Alpha Trend를 통한 시장 국면 분석과 22개의 상승 및 하락 캔들 패턴 을 결합합니다. 모든 패턴을 동일하게 취급하는 대신, 다양
Auto Optimized SpeedAngle 은 지속적인 워크포워드 최적화(Walk-Forward Optimization, WFO)를 통해 곡선 적합(curve-fitting)을 제거한 기관 수준의 모멘텀 벡터화 시스템입니다. 시장 체제가 바뀔 때 성능이 떨어지는 정적 입력에 의존하는 대신, 이 지표는 표본 외(Out-of-Sample, OOS) 검증을 사용하여 매개변수를 동적으로 재보정하며, 표시되는 신호가 과거의 우연이 아닌 진정한 통계적 우위를 나타내도록 보장합니다. 핵심 기관용 프레임워크 워크포워드 최적화 엔진: 핵심 알고리즘은 수천 가지의 룩백(lookback) 및 임계값 조합을 지속적으로 스캔하며, 데이터를 인샘플(in-sample)과 표본 외(out-of-sample) 세트로 엄격하게 분리합니다. 미지의 데이터 환경에서 수학적 우수성이 증명된 경우에만 새로운 매개변수 구성을 채택합니다. 정량적 목적 함수: 순수한 총이익을 쫓는 대신, 최적화 엔진은 기관 수준의 안정성
Neuro Poseidon MT5
Daria Rezueva
4.75 (52)
Neuro Poseidon is a new indicator by Daria Rezueva. It combines precise trading signals with adaptive TP/SL levels - creating best possible trades as a result! Message me and get  Neuro Poseidon Assistant  as a gift to automize your trading process! What makes it stand out? 1. Proven profitability on all assets and timeframes 2. Only confirmed BUY and SELL signals present on the chart 3. Adaptive TP & SL levels generated by the software for each trade 4. Easy to understand - suitable for al
ARIPoint
Temirlan Kdyrkhan
1 (4)
ARIPoint is a powerful trading companion designed to generate high-probability entry signals with dynamic TP/SL/DP levels based on volatility. Built-in performance tracking shows win/loss stats, PP1/PP2 hits, and success rates all updated live. Key Features: Buy/Sell signals with adaptive volatility bands Real-time TP/SL/DP levels based on ATR Built-in MA Filter with optional ATR/StdDev volatility Performance stats panel (Success, Profit/Loss, PP1/PP2) Alerts via popup, sound, push, or email Cu
Scalper Vault MT5
Oleg Rodin
5 (1)
Scalper Vault는 당일 매매(intraday trading)에서 일관된 성과를 내고자 하는 트레이더를 위해 설계된, 강력하고 모든 기능을 갖춘 트레이딩 시스템입니다. 이 고정밀 지표는 외환(Forex) 및 바이너리 옵션 트레이더 모두에게 기관급 분석을 제공하는 독립적인 종합 트레이딩 시스템 역할을 합니다. 구매 후 저에게 연락해 주시면, 트레이딩 팁과 함께 특별한 보너스를 제공해 드립니다! Scalper Vault는 추측에 의존하거나 복잡한 수동 분석을 할 필요를 없애주며, 사용하기 쉬운 트레이딩 기법을 통해 오직 매매 실행에만 집중할 수 있도록 돕습니다. 정확한 추세 추종 신호: 핵심 알고리즘이 시장 구조를 분석하여, 지배적인 시장 추세 방향과 일치하는 고확률 신호만을 제공함으로써 잘못된 진입을 획기적으로 줄여줍니다. 정밀한 고점 및 저점 탐지: 시장의 움직임이 소진되는 지점을 스캔하여 잠재적인 반전 구간을 식별합니다. 간(Gann) 이론 기반의 매수/매도 구간: 수학적
Gann Made Easy MT5
Oleg Rodin
5 (12)
Gann Made Easy 는 mr.의 이론을 사용하여 최고의 거래 원칙을 기반으로 하는 전문적이고 사용하기 쉬운 Forex 거래 시스템입니다. W.D. 간. 이 표시기는 Stop Loss 및 Take Profit Levels를 포함하여 정확한 BUY 및 SELL 신호를 제공합니다. PUSH 알림을 사용하여 이동 중에도 거래할 수 있습니다. 구매 후 거래 방법 안내 및 유용한 추가 지표를 무료로 받으시려면 저에게 연락주세요! 아마도 Gann 거래 방법에 대해 이미 여러 번 들었을 것입니다. 일반적으로 Gann의 이론은 초보자 거래자뿐만 아니라 이미 거래 경험이 있는 사람들에게도 매우 복잡한 것입니다. Gann의 거래 방식은 이론적으로 적용하기 쉽지 않기 때문입니다. 나는 그 지식을 연마하고 Forex 지표에 최고의 원칙을 적용하기 위해 몇 년을 보냈습니다. 표시기는 적용하기가 매우 쉽습니다. 차트에 첨부하고 간단한 거래 권장 사항을 따르기만 하면 됩니다. 지표는 지속적으로 시장 분석
Trend Catcher ind mt5
Ramil Minniakhmetov
5 (18)
트렌드 캐처 인디케이터 트렌드 캐처 인디케이터는 개발자가 자체 개발한 맞춤형 적응형 트렌드 분석 지표들을 조합하여 시장 가격 움직임을 분석합니다. 단기적인 노이즈를 제거하고 근본적인 모멘텀 강도, 변동성 확대, 가격 구조 움직임에 집중하여 진정한 시장 방향을 파악합니다. 또한 이동 평균, RSI, 변동성 필터와 같은 맞춤형 지표들을 활용하여 가격을 평활화하고 트렌드를 필터링합니다. 실제 운영 모니터링 및 기타 제품은 다음 링크에서 확인하실 수 있습니다:   https://www.mql5.com/en/users/mechanic/seller 텔레그램에서는 EA나 설정 파일을 판매하지 않습니다. 사기이니 주의하세요. 모든 설정 파일은 블로그에서 무료로 제공됩니다. 중요! 구매 후 즉시 연락 주시면 사용 방법 및 보너스를 드립니다!
안녕하세요, 트레이더 여러분! 많은 개인 투자자들이 느린 웹 스크립트에 의존하고 있습니다. 수익성 있는 거래를 위해서는 체계적인 프레임워크가 필수적입니다. Astro AI 지표는 단순한 차트 오버레이가 아닙니다. 터미널에서 직접 실행되는 두 개의 에이전트로 구성된 정교한 신경망입니다. 시스템 기술 상세 설명: 1. 에이전트 1: 분석가 (그래픽 신경망 – GNN) 시장은 개별 가격 막대로 이루어진 것이 아니라 상호 연결된 데이터 네트워크입니다. 기능: 에이전트 1은 그래픽 신경망을 사용하여 이러한 복잡하고 비선형적인 관계를 파악합니다. 장점: 기존 지표는 과거 이동 평균만을 고려하는 반면, 저희 GNN은 시장의 심층적인 구조적 관계를 실시간으로 처리하여 개별 트레이더의 거래량이 시장에 큰 영향을 미치기 전에 숨겨진 상관관계를 찾아냅니다. 2. 에이전트 2: 실행기 (근접 전략 최적화 – PPO) 패턴 인식은 절반의 성공일 뿐입니다. 현재 시장 변동에 기반하여 올바른
Divergence Bomber
Ihor Otkydach
4.89 (94)
이 지표를 구매하신 분께는 다음과 같은 혜택이 무료로 제공됩니다: 각 거래를 자동으로 관리하고, 손절/익절 수준을 설정하며, 전략 규칙에 따라 거래를 종료하는 전용 도우미 툴 "Bomber Utility" 다양한 자산에 맞게 지표를 설정할 수 있는 셋업 파일(Set Files) "최소 위험", "균형 잡힌 위험", "관망 전략" 모드로 설정 가능한 Bomber Utility의 셋업 파일 이 전략을 빠르게 설치, 설정, 시작할 수 있도록 돕는 단계별 영상 매뉴얼 주의: 위의 모든 보너스를 받기 위해서는 MQL5 개인 메시지 시스템을 통해 판매자에게 연락해 주세요. 독창적인 커스텀 지표인 “Divergence Bomber(다이버전스 봄버)”를 소개합니다. 이 지표는 MACD 다이버전스(괴리) 전략을 기반으로 한 올인원(All-in-One) 거래 시스템입니다. 이 기술 지표의 주요 목적은 가격과 MACD 지표 간의 다이버전스를 감지하고, **향후 가격이 어느 방향으로 움직일지를 알려주
Entry In The Zone and SMC Multi Timeframe is a real-time market analysis tool based on Smart Money Concepts (SMC), designed to analyze market structure, price direction, and key trading zones. It supports both Single-Timeframe and Multi-Timeframe Analysis, providing a clearer view of overall market structure across multiple timeframes, with real-time BUY / SELL signals designed with a strict focus on No-Repaint principles. The signals are designed to help filter unclear setups and evaluate tradi
PainX GainX Blue Spike Fusion AI Advanced Synthetic Index Spike Detection Indicator for MetaTrader 5 Discover potential spike setups with a clear, organized, and professional trading interface. PainX GainX Blue Spike Fusion AI is a specialized indicator designed for traders who monitor synthetic indices and want a structured way to observe potential price spike opportunities. The indicator combines signal monitoring, market-condition analysis, visual alerts, and event tracking in one convenient
Volatility Master for MetaTrader is a real-time dashboard tool that scans up to  50 symbols  to identify high-volatility , trending markets instantly. With bullish/bearish signals, customizable alerts, and a user-friendly interface, it helps you avoid range-bound conditions and focus on high-probability trades. Clarity leads to confidence. Trade confidently and protect your capital effectively with this powerful dashboard. We don't offer free or bonus indicators in exchange of reviews from you.
Unix Scalper
Issam Kassas
4 (4)
Unix Scalper — MetaTrader 5 구매 후 MQL5에서 저에게 메시지를 보내시면 Smart Universal Expert Advisor를 무료로 받으실 수 있으며, 온라인 강좌, PDF 매뉴얼 및 비공개 그룹 이용 권한도 함께 제공됩니다. 매매 기회를 찾고, 거래 계획을 확인하고, 실행 방법을 선택하세요. UNIX Scalper는 시장 분석, BUY/SELL/WAIT 판단, Entry, Stop Loss, TP1 및 TP2 가격 수준을 하나의 정돈된 패널에 제공합니다. 신호와 거래 계획을 한눈에 • 명확한 판단: BUY, SELL 또는 WAIT. • 구체적인 가격 수준: Entry, Stop Loss, TP1 및 TP2. • 다중 시간대 개요: 패널의 여러 시간대 신호를 비교하세요. • 판단을 돕는 분석: 추세, 모멘텀, 거래량, 변동성, 지지와 저항, 시장 품질. • 다양한 레이아웃: Minimized, Compact, Standard 또는 Full. 신호와
Atomic Analyst MT5
Issam Kassas
4.48 (62)
Atomic Analyst — MetaTrader 5 구매 후 MQL5에서 저에게 메시지를 보내시면 Smart Universal Expert Advisor를 무료로 받으실 수 있으며, 온라인 강좌, PDF 매뉴얼 및 비공개 그룹 이용 권한도 함께 제공됩니다. Atomic Analyst는 가격 움직임 분석, 추세 방향, 진입·청산 신호, 손절 수준, 여러 익절 수준을 차트에 모아 보여줍니다. 신호를 확인하고 매매 상황을 이해하세요 Atomic Analyst는 분석 결과를 명확한 시각 정보로 정리합니다. • 잠재적인 진입 기회를 확인할 수 있는 매수·매도 화살표. • 거래 계획에 도움이 되는 손절 수준과 여러 익절 수준. • 시장 방향을 평가할 수 있는 추세, 강도, 모멘텀 수치. • 더 넓은 시장 맥락을 비교할 수 있는 여러 시간대 분석. • 변화하는 시장 상황을 따라갈 수 있는 색상별 캔들과 알림. 신호와 보조 분석을 함께 검토한 다음, 해당 매매 상황이 자신의 거래 규칙에
FiboSniper Pro
Van Minh Nguyen
5 (3)
FiboSniper Pro – Multi-Filter Fibonacci System with Auto SL/TP and Control Panel FiboSniper Pro는 동적 Fibonacci Envelopes와 여러 확인 필터를 결합하여 선별된 Buy 및 Sell 신호를 생성하는 기술적 지표입니다. Fibonacci 레벨은 Moving Average와 ATR을 기반으로 계산된 후 ADX, EMA, RSI, ATR, Volume, Time 및 Candle 구조를 통해 필터링됩니다. 이 지표는 ATR 기반의 자동 Stop Loss 및 Take Profit 레벨을 차트에 직접 표시하며, 빠른 설정 조정을 위한 인터랙티브 Control Panel을 제공합니다. 구매 후 권장 설정 파일과 자세한 사용 방법을 받으려면 저에게 문의해 주세요. Auto Trader X를 사용하여 FiboSniper Pro 신호를 자동화할 수 있습니다: [Auto Trader X] User Guide 및 Se
Quantum TrendPulse
Bogdan Ion Puscasu
5 (26)
SuperTrend   ,   RSI   ,   Stochastic   의 힘을 하나의 포괄적인 지표로 결합하여 트레이딩 잠재력을 극대화하는 궁극의 트레이딩 도구   인 Quantum TrendPulse를   소개합니다. 정밀성과 효율성을 추구하는 트레이더를 위해 설계된 이 지표는 시장 추세, 모멘텀 변화, 최적의 진입 및 종료 지점을 자신 있게 식별하는 데 도움이 됩니다. 주요 특징: SuperTrend 통합:   주요 시장 추세를 쉽게 따라가고 수익성의 물결을 타세요. RSI 정밀도:   매수 과다 및 매도 과다 수준을 감지하여 시장 반전 시점을 파악하는 데 적합하며 SuperTrend 필터로 사용 가능 확률적 정확도:   변동성이 큰 시장에서 숨겨진 기회를 찾기 위해 확률적 진동   을 활용하고 SuperTrend의 필터로 사용 다중 시간대 분석:   M5부터 H1 또는 H4까지 다양한 시간대에 걸쳐 시장을 최신 상태로 유지하세요. 맞춤형 알림:   맞춤형 거래 조건이 충족되면
Advanced Supply Demand MT5
Bernhard Schweigert
4.53 (15)
현재 33% 할인! 초보자나 전문 트레이더를 위한 최고의 솔루션! 이 보조지표는 우리가 다수의 독창적 기능과 새로운 공식을 통합한 독특하고 고품질이며 저렴한 거래 도구입니다. 이 업데이트를 통해 이중 시간대를 표시할 수 있습니다. 더 높은 TF를 표시할 수 있을 뿐만 아니라 차트 TF와 더 높은 TF 모두를 표시할 수 있습니다: 중첩 영역 표시. 모든 Supply Demand 트레이더들이 좋아할 것입니다. :) 중요한 정보 공개 Advanced Supply Demand의 잠재력을 극대화하려면 다음을 방문하십시오. https://www.mql5.com/ko/blogs/post/720245   진입 또는 목표의 명확한 트리거 포인트를 정확히 찾아냄으로 해서 거래가 어떻게 개선될지 상상해 보십시오. 새로운 알고리즘을 기반으로 매수자와 매도자 간의 잠재적인 불균형을 훨씬 더 쉽게 분간할 수 있습니다. 왜냐하면 가장 강한 공급영역과 가장 강한 수요 영역과 과거에 어떻게 진행 되었는지를(이전
FX Power MT5 NG
Daniel Stein
5 (33)
FX Power: 통화 강세 분석으로 더 스마트한 거래 결정을 개요 FX Power 는 어떤 시장 상황에서도 주요 통화와 금의 실제 강세를 이해하기 위한 필수 도구입니다. 강한 통화를 매수하고 약한 통화를 매도함으로써 FX Power 는 거래 결정을 단순화하고 높은 확률의 기회를 발견합니다. 트렌드를 따르거나 극단적인 델타 값을 사용해 반전을 예측하고자 한다면, 이 도구는 귀하의 거래 스타일에 완벽히 적응합니다. 단순히 거래하지 말고, FX Power 로 더 스마트하게 거래하세요. 1. FX Power가 거래자에게 매우 유용한 이유 통화와 금의 실시간 강세 분석 • FX Power 는 주요 통화와 금의 상대적 강세를 계산하고 표시하여 시장 역학에 대한 명확한 통찰력을 제공합니다. • 어떤 자산이 앞서고 있고 어떤 자산이 뒤처지는지 모니터링하여 보다 현명한 거래 결정을 내릴 수 있습니다. 포괄적인 멀티 타임프레임 뷰 • 단기, 중기 및 장기 타임프레임에서 통화와 금의 강세를
PZ Divergence Trading MT5
PZ TRADING SLU
3.71 (7)
Unlock hidden profits: accurate divergence trading for all markets Tricky to find and scarce in frequency, divergences are one of the most reliable trading scenarios. This indicator finds and scans for regular and hidden divergences automatically using your favourite oscillator. [ Installation Guide | Update Guide | Troubleshooting | FAQ | All Products  ] Easy to trade Finds regular and hidden divergences Supports many well known oscillators Implements trading signals based on breakouts Displays
DayTrader PRO
Davit Beridze
5 (4)
DayTrader PRO DayTrader PRO는 존 에러스(John Ehlers)의 Laguerre 필터와 강력한 자동 최적화 엔진을 결합한 고급 트레이딩 지표입니다. 고정된 파라미터를 사용하는 대신, 최근 시장 상황을 바탕으로 최적의 설정을 자동으로 검색하므로 지속적인 수동 조정 없이도 변화하는 시장 변동성에 대응할 수 있습니다. 이 지표는 명확한 매수(BUY) 및 매도(SELL) 신호를 생성하며, 현재 시장 변동성을 기준으로 계산된 적응형 손절매(Stop Loss) 및 익절(Take Profit) 레벨을 제공합니다. 내장된 추세, 효율성 지수(Efficiency Ratio), 변동성 및 캔들 필터 기능은 저품질의 진입 신호를 제거하여 신호의 정확도를 높여줍니다. 실시간 성능 대시보드에서는 현재 최적화된 설정값, 수익 요인(Profit Factor), 승률(Win Rate), 최대 낙폭(Drawdown) 및 기타 트레이딩 통계를 확인할 수 있습니다. 또한 DayTrader PR
Gartley Hunter Multi
Siarhei Vashchylka
5 (12)
Gartley Hunter Multi - An indicator for searching for harmonic patterns simultaneously on dozens of trading instruments and on all possible timeframes. Manual (Be sure to read before purchasing) | Version for MT4 Advantages 1. Patterns: Gartley, Butterfly, Shark, Crab. Bat, Alternate Bat, Deep Crab, Cypher 2. Simultaneous search for patterns on dozens of trading instruments and on all possible timeframes 3. Search for patterns of all possible sizes. From the smallest to the largest 4. All fou
FX Trend MT5 NG
Daniel Stein
5 (6)
FX Trend NG: 차세대 멀티 마켓 트렌드 인텔리전스 개요 FX Trend NG 는 다중 시간 프레임 기반의 전문 트렌드 분석 및 시장 모니터링 도구입니다. 몇 초 만에 전체 시장 구조를 파악할 수 있도록 설계되었습니다. 여러 차트를 일일이 전환할 필요 없이, 어떤 종목이 추세에 있는지, 어디에서 모멘텀이 약화되고 있는지, 그리고 어떤 시간 프레임이 서로 정렬되어 있는지 즉시 확인할 수 있습니다. 출시 기념 특별 혜택 – FX Trend NG 를 $30 (6개월) 또는 $80 평생 라이선스 로 이용할 수 있습니다. 이미 Stein Investments 고객이신가요? -> 메시지를 보내 전용 고객 그룹에 참여하세요. 설정이나 사용 방법이 필요하신가요? -> Stein Investments 공식 페이지 를 방문하세요. 1. FX Trend NG가 특별한 이유 3단계 추세 로직 – 단순한 Buy / Sell이 아닙니다 • 대부분의 지표는 Buy 또는 Sell 두 가지 상태만 제
Advanced Currency Strength28 MT5
Bernhard Schweigert
5 (3)
초보자 또는 전문가 트레이더를 위한 최고의 솔루션! 이 지표는 우리가 독점 기능과 새로운 공식을 통합했기 때문에 독특하고 고품질이며 저렴한 거래 도구입니다. 단 하나의 차트로 28 Forex 쌍의 통화 강도를 읽을 수 있습니다! 새로운 추세 또는 스캘핑 기회의 정확한 트리거 포인트를 정확히 찾아낼 수 있기 때문에 거래가 어떻게 개선될지 상상해 보십시오. 사용 설명서: 여기를 클릭  https://www.mql5.com/en/blogs/post/697384 그것이 첫 번째, 원본입니다! 쓸모없는 지망생 클론을 사지 마십시오. 더 스페셜  강력한 통화 모멘텀을 보여주는 하위 창의 화살표 GAP가 거래를 안내합니다! 기본 또는 호가 통화가 과매도/과매도 영역(외부 시장 피보나치 수준)에 있을 때 개별 차트의 기본 창에 경고 표시가 나타납니다. 통화 강도가 외부 범위에서 떨어질 때 풀백/반전 경고. 교차 패턴의 특별 경고 추세를 빠르게 볼 수 있는 다중 시간 프레임 선택이 가능합
초보자 또는 전문가 트레이더를 위한 최고의 솔루션! 이 지표는 우리가 독점 기능과 비밀 공식을 통합했기 때문에 독특하고 고품질이며 저렴한 거래 도구입니다. 단 하나의 차트로 28개 통화 쌍 모두에 대한 경고를 제공합니다. 새로운 추세 또는 스캘핑 기회의 정확한 트리거 포인트를 정확히 찾아낼 수 있기 때문에 거래가 어떻게 개선될지 상상해 보십시오! 새로운 기본 알고리즘을 기반으로 구축되어 잠재적인 거래를 훨씬 더 쉽게 식별하고 확인할 수 있습니다. 이는 통화의 강세 또는 약세가 가속되는지 여부를 그래픽으로 표시하고 가속 속도를 측정하기 때문입니다. 자동차의 속도계처럼 생각하면 됩니다. 가속화할 때 Forex 시장에서 동일한 일이 분명히 더 빠르게 발생합니다. 즉, 반대 방향으로 가속화되는 통화를 페어링하면 잠재적으로 수익성 있는 거래를 식별한 것입니다. 통화 모멘텀의 수직선과 화살표가 거래를 안내합니다! 역동적인 Market Fibonacci 23 레벨은 경고 트리거로 사용되며
Trend Lines PRO MT5
Roman Podpora
5 (1)
트렌드 라인즈 프로       이 지표는 시장이 실제로 어떤 방향으로 전환되는지 파악하는 데 도움이 됩니다. 실제 추세 반전 지점과 주요 시장 참여자들이 다시 진입하는 지점을 보여줍니다. 보시다시피       BOS 라인       복잡한 설정이나 불필요한 노이즈 없이 더 높은 시간대의 추세 변화와 주요 레벨을 확인할 수 있습니다. 신호는 차트에 다시 그려지지 않고 캔들이 마감된 후에도 계속 표시됩니다. VERSION MT 4   -   RFI LEVELS PRO   표시기   와 결합할 때 최대 잠재력을 발휘합니다. 지표가 보여주는 내용: 실제 변화       추세(BOS 라인) 한 번 신호가 나타나면 그 신호는 계속 유효합니다! 이는 신호를 발생시킨 후 변경될 수 있는 리페인팅 방식의 지표와 중요한 차이점입니다. 리페인팅 방식의 지표는 잠재적으로 자금 손실로 이어질 수 있습니다. 이제 더욱 높은 확률과 정확도로 시장에 진입할 수 있습니다. 또한 화살표가 나타난 후 목표가(익절)
필터:
리뷰 없음
리뷰 답변