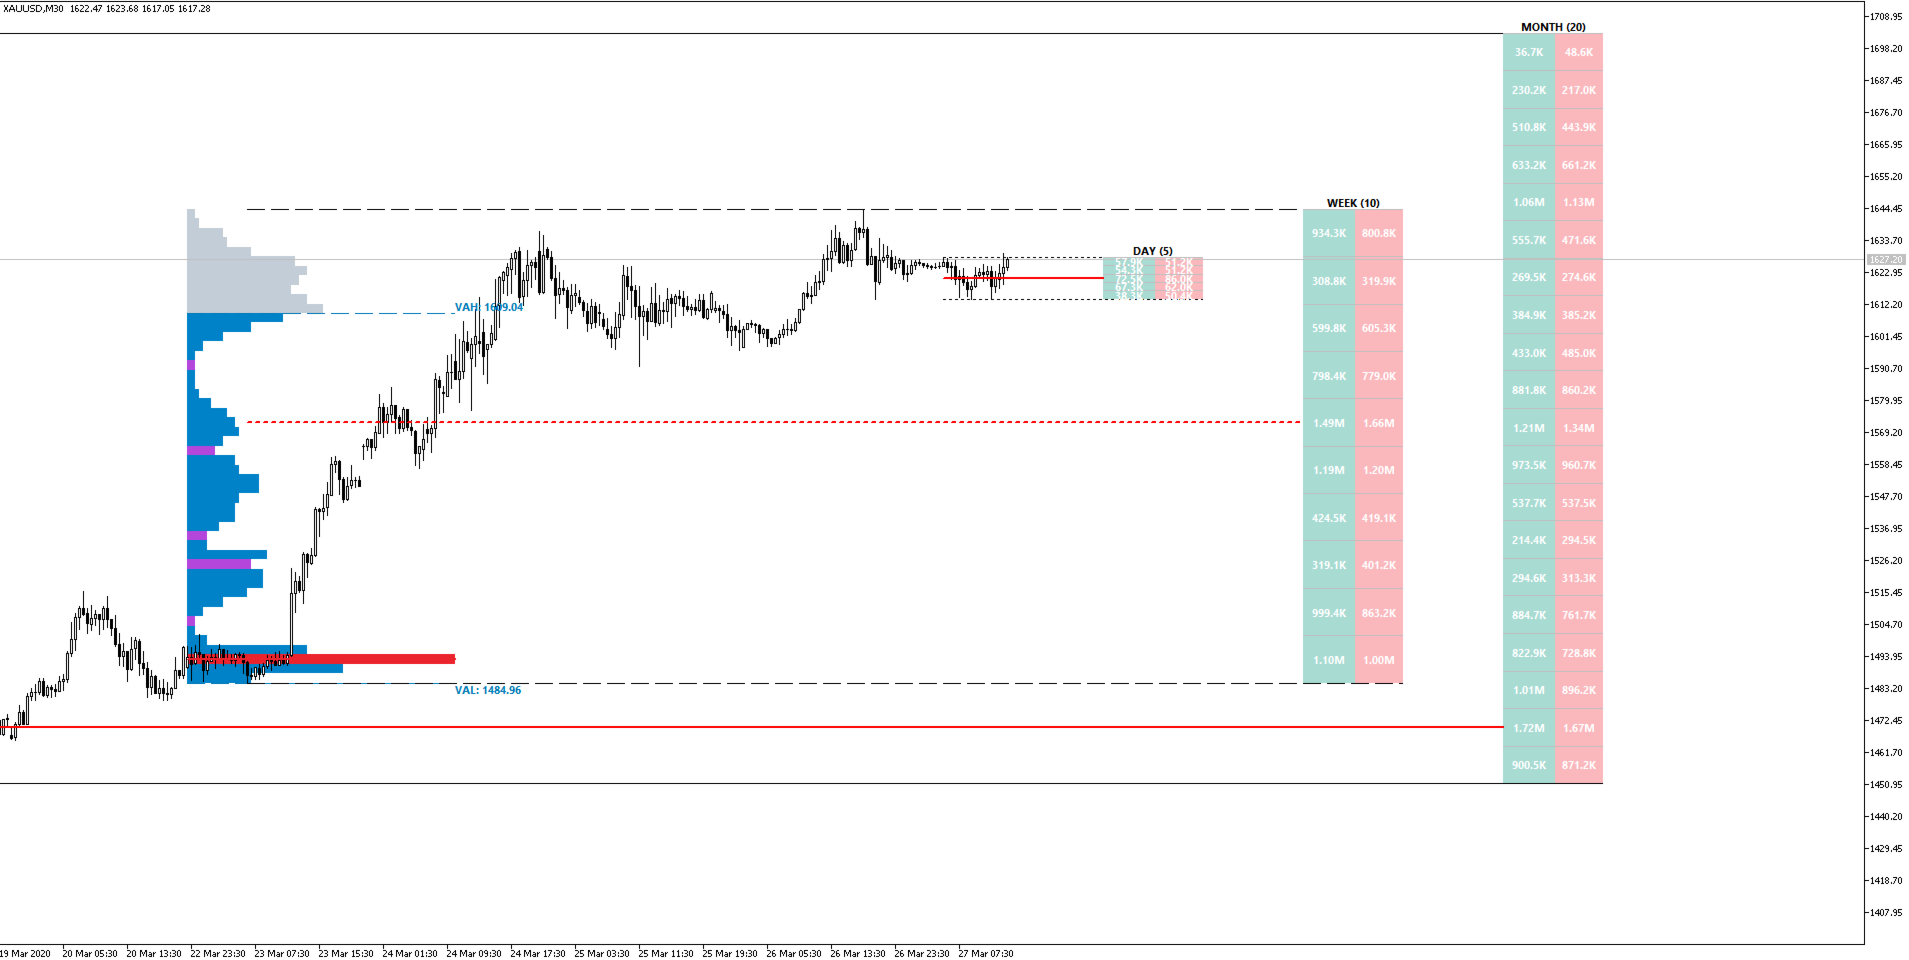
Multi Ranges Volume Distribution mt4
- インディケータ
- バージョン: 1.0
- アクティベーション: 5

On-Chart Full Weekly Volume Profile (WVP) MT4 HERE
-
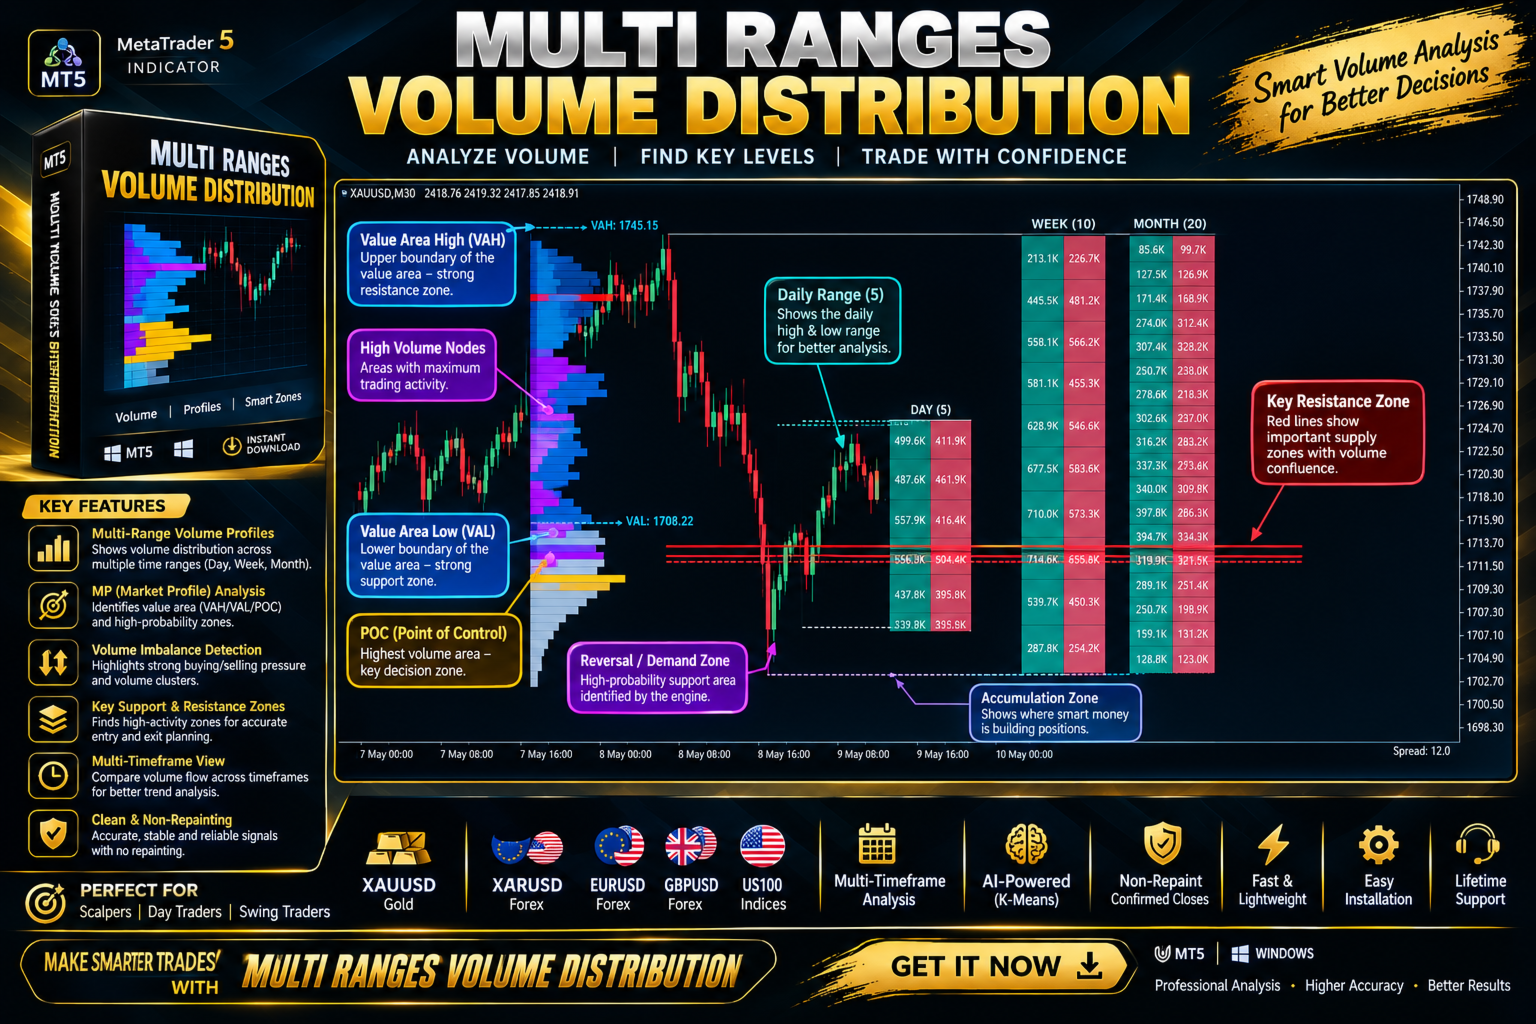
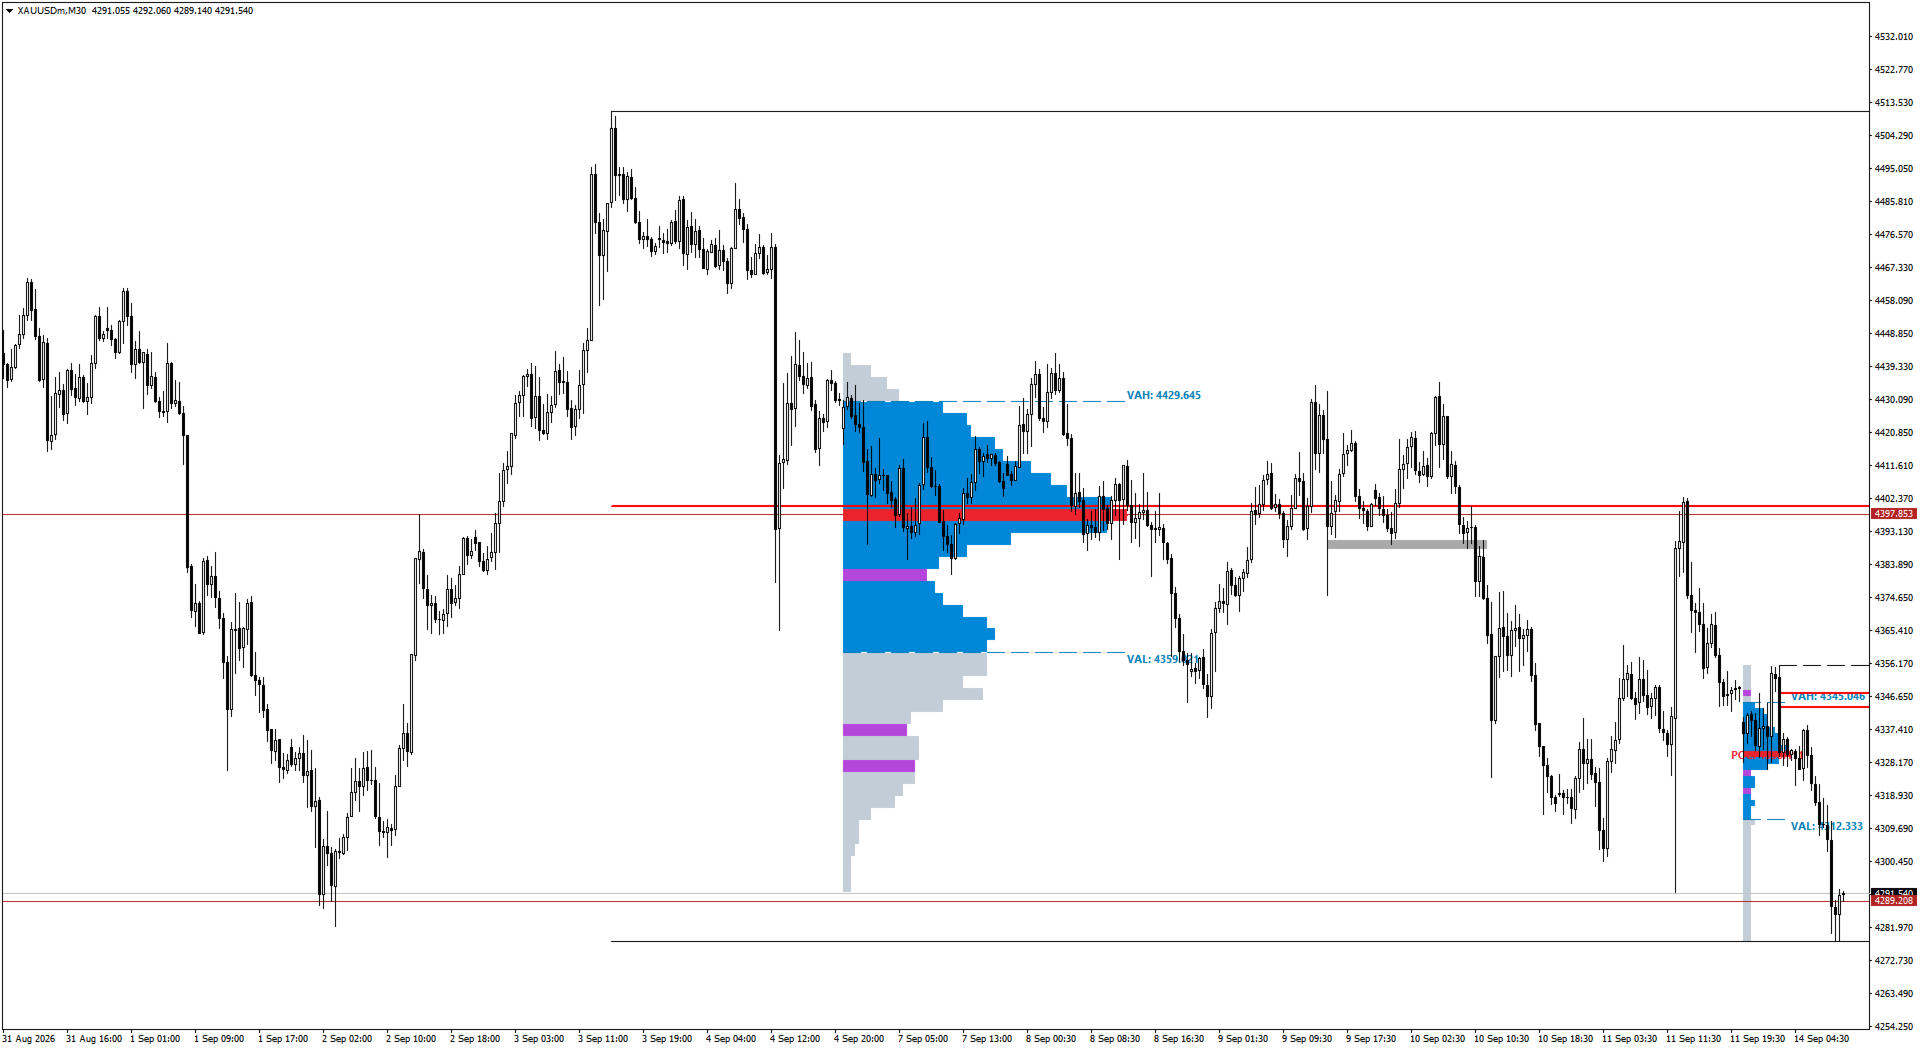
True Anchor to Week Open: Histograms anchor precisely to the week’s first opening candle on the left and expand rightward proportional to traded volume.
-
Direct Timeseries Engine: Calculates volume directly from chart candles—no broker cache misses, no incomplete historical gaps, and zero delay.
-
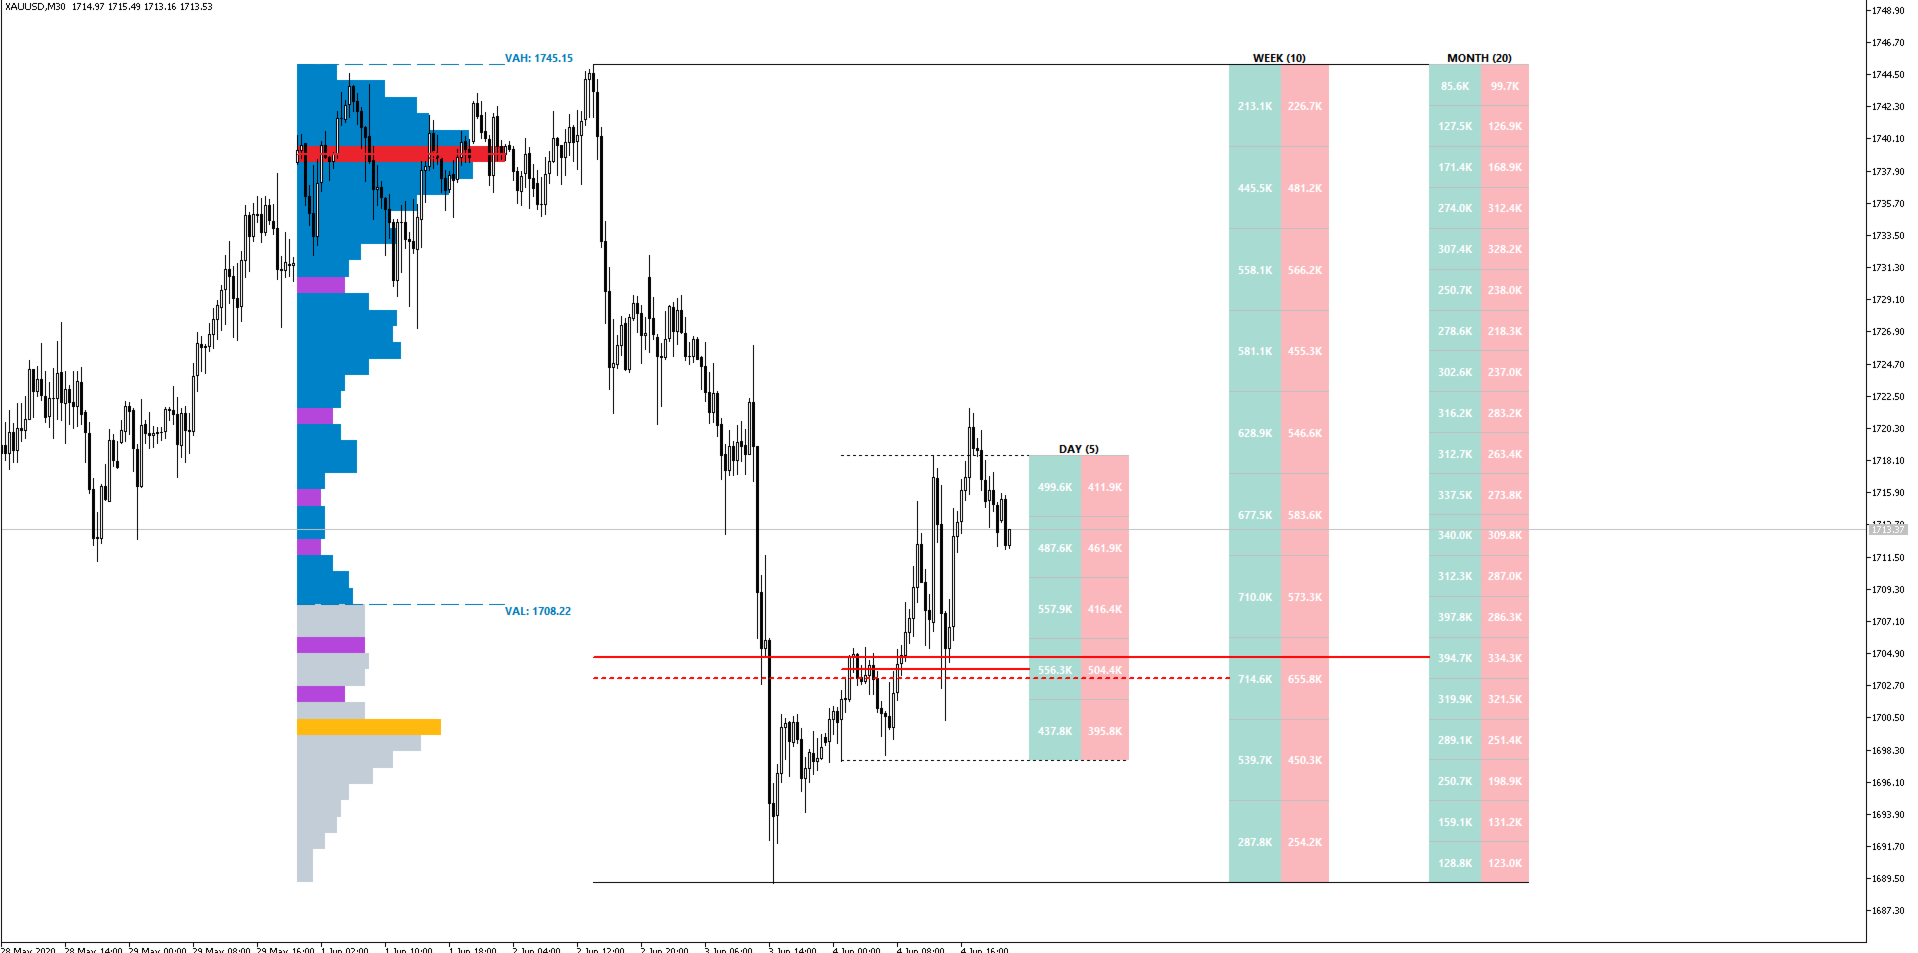
70% Value Area (VA): High-volume trading zones (70% standard deviation) are highlighted in vibrant Steel Blue, while external distribution tails are muted.
-
Bounded VAH, VAL & POC Lines:
-
Value Area High (VAH): Line with price tag positioned cleanly above the level.
-
Value Area Low (VAL): Line with price tag positioned cleanly below the level.
-
Point of Control (POC): Bold line with price tag centered in the middle.
-
Strict Boundary Rule: Lines terminate strictly at the histogram's edge—they never clutter your chart by trailing into live candles.
-
-
High & Low Volume Nodes (HVN / LVN):
-
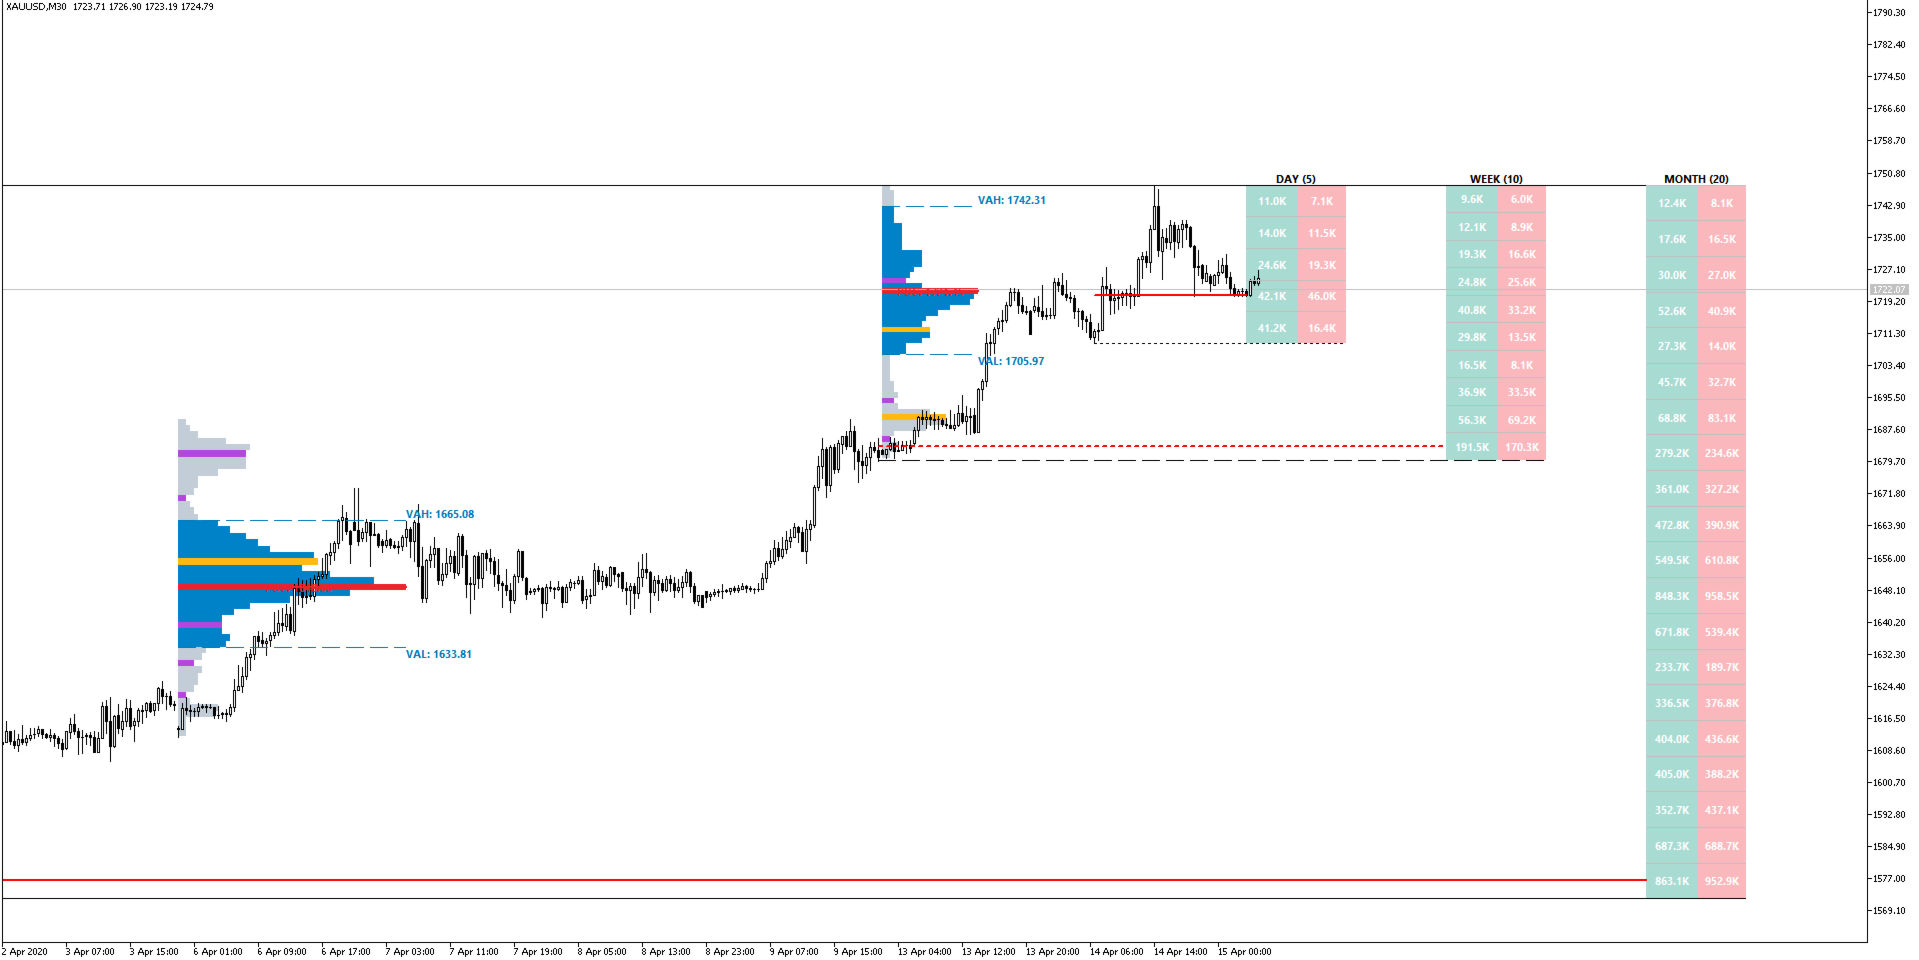
HVN (Amber/Gold): Highlights fair price acceptance zones and consolidation areas.
-
LVN (Purple/Violet): Highlights liquidity voids and rapid rejection zones.
-
2. Multi-Range Forward Projection (MRVD)
-
Future Margin Columns: Displays projection columns side-by-side to the right of price action, keeping your main chart uncluttered.
-
Simultaneous Multi-Timeframe Profiling: Analyzes Day, Week, and Month ranges side-by-side with independent row resolutions.
-
Two Volume Display Modes:
-
Buy & Sell Mode: Splits each row into green (bullish/buying volume) and red (bearish/selling volume) cells with real numerical volume tags (K, M, B).
-
Total Mode: Single heatmap cell color-graded dynamically from Red to Green based on buying percentage.
-
-
Translucent Visuals: Recreates TradingView’s 80% opacity aesthetic using smart color-blending algorithms that match your chart background.
3. Smart Theme Auto-Detection
-
Automatically detects whether you are using a Dark Theme or a Pure White Theme, dynamically recalibrating text labels, muted fills, and grid lines for maximum contrast.
📊 How to Trade Using This Indicator
-
Value Area Reversals (Mean Reversion): When price tests the VAL (Value Area Low) or VAH (Value Area High) and fails to break out, trade the rotation back toward the POC (Point of Control).
-
Value Area Breakouts (Imbalance): An aggressive close outside VAH or VAL signals institutional imbalance and the start of a trend leg.
-
HVN (Support / Resistance): High Volume Nodes act as liquidity magnets where price frequently re-accumulates or stalls.
-
LVN (Speed Zones): Low Volume Nodes represent market rejection; price tends to pass through LVN zones quickly due to a lack of liquidity.
-
Delta Dominance: Use the MRVD forward projection columns to see whether buyers or sellers dominated key price rows before entering a trade.