Trend Magicc

*This is tradingview indicator converted to mql5*

The Trend Magic Indicator is a popular technical analysis tool used to identify the direction of a market trend and potential trend reversals. It is a versatile indicator that can be applied to various financial instruments and timeframes.

The Trend Magic Indicator consists of a combination of moving averages and a volatility-based filter. It aims to smooth out price fluctuations and provide a clearer visualization of the underlying trend. Here are the key components and features of the indicator:

  1. Moving Averages: The Trend Magic Indicator uses two moving averages to identify the trend direction. Typically, it employs an Exponential Moving Average (EMA) or a Smoothed Moving Average (SMA). The shorter moving average reacts more quickly to price changes, while the longer moving average provides a smoother trend line.

  2. Volatility Filter: The indicator incorporates a volatility-based filter to adjust its sensitivity to price movements. This filter helps in adapting to different market conditions and reducing false signals during periods of low volatility.

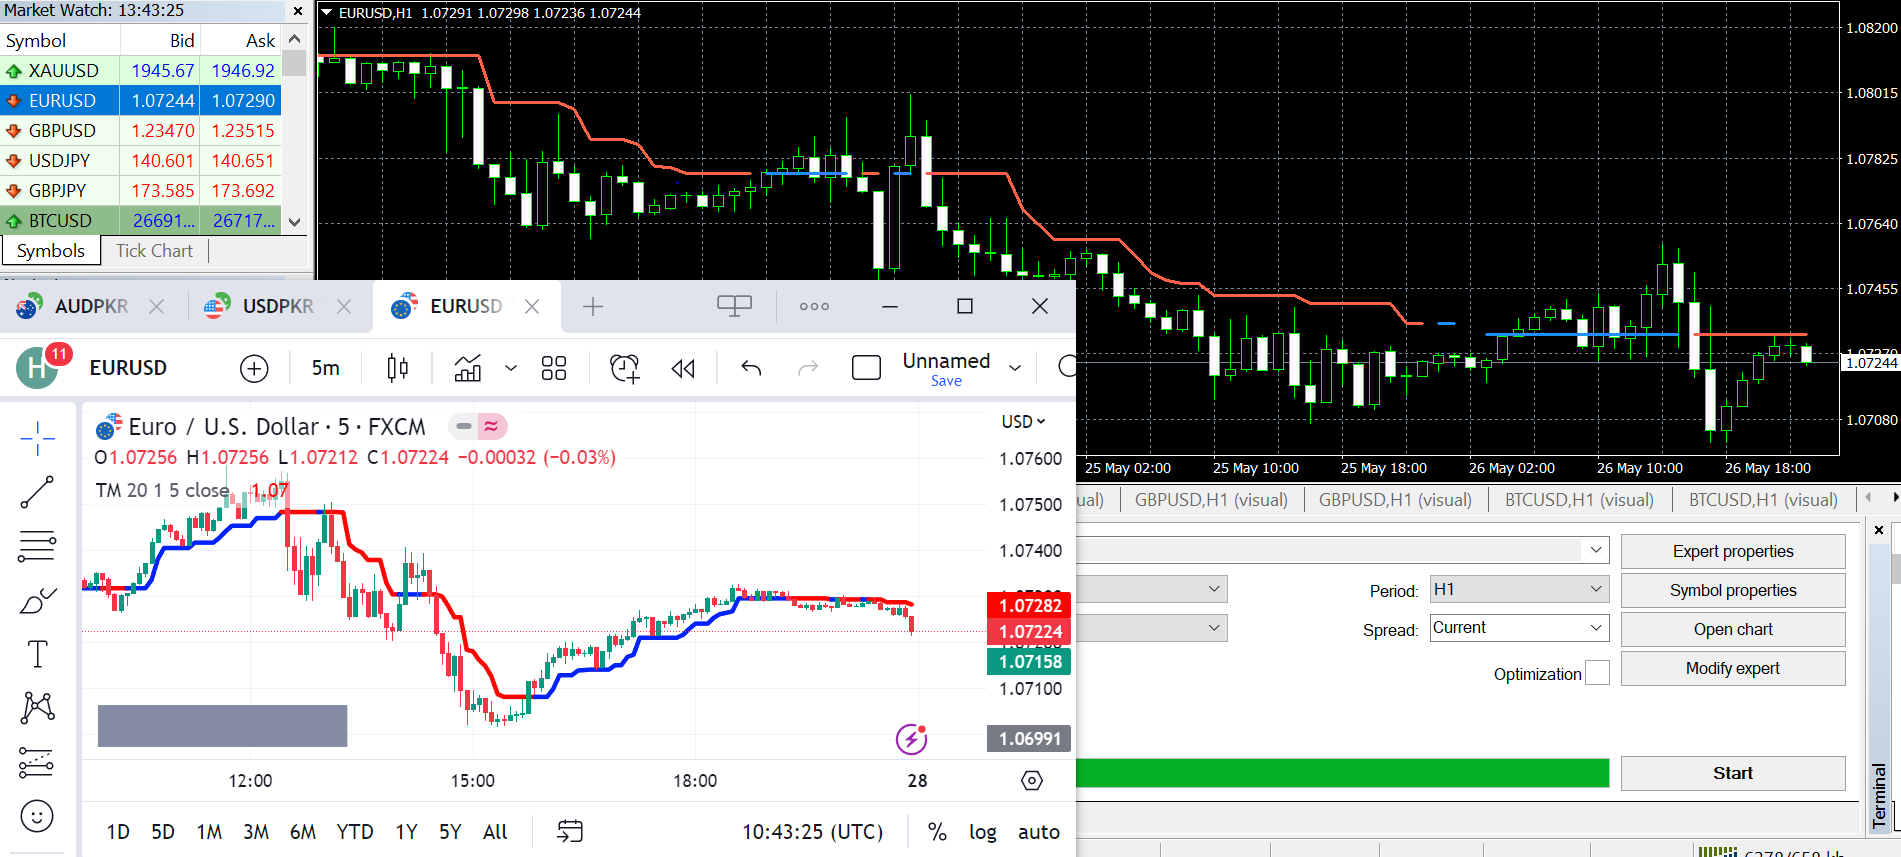
  3. Color-Coded Trend: The Trend Magic Indicator visually represents the trend direction by changing colors. For example, when the indicator line is blue, it indicates an uptrend, and when it turns red, it suggests a downtrend. Some versions of the indicator may use different colors or additional visual cues.

  4. Trend Reversals: In addition to identifying the trend direction, the Trend Magic Indicator can also signal potential trend reversals. When the indicator line changes color from blue to red or vice versa, it suggests a possible shift in the market sentiment.

  5. Customization Options: The indicator often provides customization options, allowing traders to adjust parameters such as the length of moving averages, volatility thresholds, and color schemes to suit their trading preferences and strategies.

The Trend Magic Indicator can be used in various ways, including trend following, identifying pullbacks within a trend, and as a confirmation tool alongside other technical indicators or trading systems.


おすすめのプロダクト
Discover the power of precision and efficiency in your trading with the " Super Auto Fibonacci " MT4 indicator. This cutting-edge tool is meticulously designed to enhance your technical analysis, providing you with invaluable insights to make informed trading decisions. Key Features: Automated Fibonacci Analysis: Say goodbye to the hassle of manual Fibonacci retracement and extension drawing. "Super Auto Fibonacci" instantly identifies and plots Fibonacci levels on your MT4 chart, saving you tim
FREE
QualifiedEngulfing - は ProEngulfing インジケーターの無料版です。 ProEngulfing - は Advance Engulf インジケーターの有料版で、 こちらからダウンロードできます。 ProEngulfing の無料版と有料版の違いは何ですか?無料版は1日に1つのシグナルの制限があります。 QualifiedEngulfingをご紹介します - あなたのMT4用のプロフェッショナルエンゴルフパターンインジケーター Precisionの力を解放して、QualifiedEngulfingを使用して外国為替市場での資格のあるエンゴルフパターンを特定および強調する先進的なインジケーターです。MetaTrader 4用に開発されたQualifiedEngulfingは、外国為替市場のエンゴルフパターンを確認およびハイライトするために設計された切り立ったアプローチを提供し、取引の決定に対して最も信頼性の高いシグナルのみを受け取ることを確認します。 QualifiedEngulfingの動作方法: QualifiedEngulfingは、エンゴルフパター
FREE
The indicator rely on The Toby strategy >> The mother candle which is bigger in range than the previous six candles. A vertical line shows the last Toby Candle with the targets shown up and down. The strategy is about the closing price out of the range of the toby candle to reach the 3 targets..The most probable to be hit is target1 so ensure reserving your profits and managing your stop lose.
FREE
*This is TradingView indicator converted to mql4* The SuperTrend V indicator is a popular technical analysis tool used to identify trends and potential trend reversals in financial markets. It is based on the concept of the SuperTrend indicator but incorporates additional features and variations. The SuperTrend V indicator uses a combination of price action and volatility to determine the trend direction and generate trading signals. Here are the key components and features of the indicator: Ca
Rainbow MT4 is a technical indicator based on Moving average with period 34 and very easy to use. When price crosses above MA and MA changes color to green, it’s a signal to buy. When price crosses below MA and MA changes color to red, it’s a signal to sell. The Expert advisor ( Rainbow EA MT4) based on Rainbow MT4 indicator, as you can see in the short video below is now available here .
FREE
MACD is well known indicator that still can be use for prediction where price will go next few minutes, hours or even weekly  With colored bar of Macd, your eyes can easily catch when color is changed based what market price movement to find any early trend on market. here is the parameter of the indicator: TF_MACD , default is 1 Hour , this mean you can see clearly MACD of 1 Hour TimeFrame on Lower TimeFrame. InpPrice , default is Price Close , this is original MACD parameter from Metaquotes st
FREE
Are you tired of drawing trendlines every time you're analyzing charts? Or perhaps you would like more consistency in your technical analysis. Then this is for you. This indicator will draw trend lines automatically when dropped on a chart. How it works Works similar to standard deviation channel found on mt4 and mt5. It has 2 parameters: 1. Starting Bar 2. Number of bars for calculation The   starting bar   is the bar which drawing of the trend lines will begin, while the   number of bars for c
FREE
Smart FVG インジケーター MT4 – MetaTrader 4 向け高度なフェアバリューギャップ検出 Smart FVG インジケーター MT4 は、MetaTrader 4 上で Fair Value Gap(FVG)をプロフェッショナルレベルで検出・監視し、アラートまで行うツールです。ATR ベースのフィルタリングと相場構造を考慮したロジックを組み合わせることで、ノイズを取り除き、流動性に応じて適応し、本当に重要な不均衡だけを残して精度の高い判断をサポートします。 主な特長 正確な FVG 検出:単なるローソク足のギャップではなく、市場の本質的な非効率を捉えます。 ATR ベースの精度:市場や時間軸が変わっても、低品質なシグナルを自動的にフィルタリング。 有効性のリアルタイム追跡:価格がゾーンを埋める/ブレイクすると、ゾーンが自動で延長・調整・削除されます。 カスタマイズ可能な表示:色・ラインスタイル・塗りつぶしを自由に設定し、どんなテンプレートにも合わせられます。 実用的なアラート:新規 FVG や、埋められた/無効化されたゾーンをリアルタイム通知。 パフォーマンス
FREE
This indicator alerts you when/before new 1 or 5 minute bar candle formed. In other words,this indicator alerts you every 1/5 minutes. This indicator is especially useful for traders who trade when new bars formed. *This indicator don't work propery in strategy tester.Use this in live trading to check functionality. There is more powerful Pro version .In Pro version,you can choose more timeframe and so on. Input Parameters Alert_Or_Sound =Sound ----- Choose alert or sound or both to notify y
FREE
Candle Countdown — MT4用 正確なローソク足カウントダウン Candle Countdown は、 現在のローソク足が閉じるまでの残り時間 をチャート上に表示するシンプルで正確なツールです。 エントリーがローソク足のクローズに依存する場合、数秒の違いが重要になります。 このインジケーターは正確な時間を表示し、焦らずに判断できるようサポートします。 ローソク足のクローズ時間を正確に把握するためのインジケーターです。 表示内容: ローソク足が閉じるまでの残り時間 サーバー現在時刻 スプレッド ストップレベル(Stop Level) タイマーはティックに依存せず、プラットフォームの内部タイマーによって更新されるため、市場の動きが少ない場合でも安定した表示を維持します。 これにより、低ボラティリティの環境でも滑らかで安定したカウントダウンを実現します。 情報は背景付きのブロック内に表示されるため、どのチャートカラーでも見やすく、分析の妨げになりません。 ローソク足のクローズが近づくと、タイマーの色が変化し、視覚的に状況を把握しやすくなります。 MT5版はこちら: Cand
FREE
FlatBreakout (Free Version) Flat Range Detector and Breakout Panel for MT4 — GBPUSD Only FlatBreakout is the free version of the professional FlatBreakoutPro indicator, specially designed for flat (range) detection and breakout signals on the GBPUSD pair only. Perfect for traders who want to experience the unique fractal logic of FlatBreakout and test breakout signals on a live market without limitations. Who Is This Product For? For traders who prefer to trade breakout of flat ranges (breakout,
FREE
A simple but effective helper that will allow you to track both global and local market trends. The indicator combines the work of two oscillators: Stochastic and RSI. Both indicators can be set to any timeframe. Advantages of Use Multitimeframe - you can adjust both indicators to the desired timeframes. To obtain the entry points, you can use the Elder's triple screen system. Highly customizable - you can configure not only the parameters of the indicators, but also their appearance (color and
FREE
PZ Penta O MT4
PZ TRADING SLU
2.33 (3)
The Penta-O is a 6-point retracement harmonacci pattern which usually precedes big market movements. Penta-O patterns can expand and repaint quite a bit. To make things easier this indicator implements a twist: it waits for a donchian breakout in the right direction before signaling the trade. The end result is an otherwise repainting indicator with a very reliable trading signal. The donchian breakout period is entered as an input. [ Installation Guide | Update Guide | Troubleshooting | FAQ | A
FREE
This indicator has been created for finding the probable reversal points of the symbol price. A small candlestick reversal pattern is used it its operation in conjunction with a filter of extremums. The indicator is not redrawn! If the extremum filter is disabled, the indicator shows all points that have a pattern. If the extremum filter is enabled, the condition works – if the history Previous bars 1 candles back contains higher candles and they are farther than the Previous bars 2 candle, such
FREE
With this system you can spot high-probability trades in direction of strong trends. You can profit from stop hunt moves initiated by the smart money! Important Information How you can maximize the potential of the scanner, please read here: www.mql5.com/en/blogs/post/718109 Please read also the blog about the usage of the indicator: Professional Trading With Strong Momentum This FREE Version of the indicator works only on EURUSD and GBPUSD. The full version of the indicator can be found here:
FREE
SX Supply Demand Zones accurately identifies and draws high-probability Supply and Demand zones using a sophisticated algorithm. Unlike traditional indicators that clutter your chart, this indicator is designed with a focus on performance and a clean user experience. New Unique Feature: Interactive Legend System What truly sets this indicator apart from everything else is the Interactive Control Legend. You have a professional dashboard directly on your chart that allows you to: Show/Hide: Ins
FREE
Follow The Line
Oliver Gideon Amofa Appiah
3.94 (16)
FOLLOW THE LINE GET THE FULL VERSION HERE: https://www.mql5.com/en/market/product/36024 This indicator obeys the popular maxim that: "THE TREND IS YOUR FRIEND" It paints a GREEN line for BUY and also paints a RED line for SELL.  It gives alarms and alerts of all kinds. IT DOES NOT REPAINT and can be used for all currency pairs and timeframes. Yes, as easy and simple as that. Even a newbie can use it to make great and reliable trades. NB: For best results, get my other premium indicators for more
FREE
The indicator displays signals according to the strategy of Bill Williams on the chart. Demo version of the indicator has the same features as the paid, except that it can work only on a demo account . Signal "First Wise Man" is formed when there is a divergent bar with angulation.  Bullish divergent bar - with lower minimum and closing price in the upper half. Bearish divergent bar - higher maximum and the closing price at the bottom half. Angulation is formed when all three lines of Alligator
FREE
Head and Shoulders Pattern Indicator - Your Key to Recognizing Trend Reversals Unlock the power of pattern recognition with the "Head and Shoulders Pattern Indicator." This cutting-edge tool, designed for MetaTrader, is your trusted ally in identifying one of the most powerful chart patterns in technical analysis. Whether you're a novice or an experienced trader, this indicator simplifies the process of spotting the Head and Shoulders pattern, allowing you to make informed trading decisions. Key
FREE
The free version of the Hi Low Last Day MT4 indicator . The Hi Low Levels Last Day MT4 indicator shows the high and low of the last trading day . The ability to change the color of the lines is available . Try the full version of the Hi Low Last Day MT4 indicator , in which additional indicator features are available : Displaying the minimum and maximum of the second last day Displaying the minimum and maximum of the previous week Sound alert when crossing max . and min . levels Selecting an arb
FREE
OrderBlock TS Roman
Vladislav Vlastovskii
3.8 (5)
Индикатор строит блоки заказов (БЗ) по торговой системе (ТС) Романа. Поиск блоков осуществляется одновременно на двух таймфремах: текущем и старшем (определяемым в настройках). Для оптимизации и игнорирования устаревших блоков в настройках задается ограничение количества дней в пределах которых осуществляется поиск блоков. Блоки строятся по правилам ТС состоящем из трех шагов: какую свечу вынесли (что?); какой свечой вынесли (чем?); правило отрисовки (как?).
FREE
MACD indicator in MetaTrader 4/5 looks different than MACD does in most other charting software. That is because the MetaTrader 4/5 version of MACD displays the MACD line as a histogram when it is traditionally displayed as a line. Additionally, the MetaTrader 4/5 version computes the Signal line using an SMA, while according to MACD definition it is supposed to be an EMA. The MetaTrader 4/5 version also does not compute a true MACD Histogram (the difference between the MACD/Signal lines). This
FREE
Adjustable Fractal MT4 is a modification of Bill Williams' Fractals indicator. The fractal consists of a two sets of arrows - up (upper fractals) and down (lower fractals). Each fractal satisfies the following conditions: Upper fractal - maximum (high) of a signal bar exceeds or is equal to maximums of all bars from the range to the left and to the right; Lower fractal - minimum (low) of a signal bar is less or equal to minimums of all bars from the range to the left and to the right. Unlike a s
FREE
This indicator finds Three Drives patterns. The Three Drives pattern is a 6-point reversal pattern characterised by a series of higher highs or lower lows that complete at a 127% or 161.8% Fibonacci extension. It signals that the market is exhausted and a reversal can happen. [ Installation Guide | Update Guide | Troubleshooting | FAQ | All Products  |  Get Help ] Customizable pattern sizes Customizable colors and sizes Customizable breakout periods Customizable 1-2-3 and 0-A-B ratios It impl
FREE
The Auto Fibonacci Indicator is a professional technical analysis tool that automatically draws Fibonacci retracement levels based on the most recent closed Daily (D1) or 4-Hour (H4) candle. These levels are widely used by traders to identify key support , resistance , and trend reversal zones . This version is designed for manual trading and supports a powerful trading strategy using Fibonacci levels combined with a 50-period EMA (Exponential Moving Average) , which you can easily add from MT4
FREE
Free automatic Fibonacci is an indicator that automatically plots a Fibonacci retracement based on the number of bars you select on the BarsToScan setting in the indicator. The Fibonacci is automatically updated in real time as new highest and lowest values appears amongst the selected bars. You can select which level values to be displayed in the indicator settings. You can also select the color of the levels thus enabling the trader to be able to attach the indicator several times with differe
FREE
Tipu Heikin-Ashi Panel is the modified version of the original Heiken Ashi indicator published by MetaQuotes here . A professional version of this indicator is available here . Features An easy to use Panel that shows the Heiken Ashi trend of selected timeframe. Customizable Buy/Sell alerts, push alerts, email alerts, or visual on-screen alerts. Customizable Panel. The panel can be moved to any place on the chart or minimized to allow more space. Heikin means "the average", and Ashi means "foot
FREE
''Trendlines'' is an Indicator, that every Trader need and shows Trendline and  Support and resistance levels in all  Timeframe's. Also In 1-hour, 4-hour and daily time frames and Current timeframes, support, and resistance levels are specified and trend lines are drawn so that the trader can see all levels on a chart.   In   Properties   it is possible to turn off unnecessary Lines.  In ' Tendency indicator '' , as full package of Predictions that every Trader need, there  is also the Predict
FREE
このプロジェクトが好きなら、5つ星レビューを残してください。 このインジケータは、指定されたためのオープン、ハイ、ロー、クローズ価格を描画します 特定のタイムゾーンの期間と調整が可能です。 これらは、多くの機関や専門家によって見られた重要なレベルです トレーダーは、彼らがより多くのかもしれない場所を知るために有用であり、 アクティブ。 利用可能な期間は次のとおりです。 前の日。 前週。 前の月。 前の四半期。 前年。 または: 現在の日。 現在の週。 現在の月。 現在の四半期。 現年。
FREE
インジケータは、チャート上の端子RSI発振器に基づく信号を示しています。 繰り返し信号をフィルタリングすることができます。 ここでは、発振器は逆信号を検索するために使用されます。 これは、レベルからスイング戦略や取引のエントリポイントとして推奨されます。 マルチ通貨ダッシュボードが利用可能です。 それを使用すると、簡単にチャートを切り替えることができます。 製品のディスカッションでは、ダッシュボードを埋め込むことができるアルゴリズムを提案できます。 入力パラメータ 。 主な設定 。 Bars Count – インジケータが動作する履歴バーの数 。 RSI Period – オシレーター周期 。 RSI Level – オシレータのレベル。 発振器は0と100の間に行きます。 10を選択すると、信号は10以上90以下になります 。 RSI Applied Price 。 Repeat Signal - 繰り返し信号 。 Enable – すべての繰り返し信号は、矢印/アイコンで表示されます 。 No Signal – 繰り返されるものはすべて無視されます 。 視覚的な矢印 。
FREE
このプロダクトを購入した人は以下も購入しています
Miraculous Indicator – ガン・スクエア・オブ・ナインに基づく100%非リペイントのFXおよびバイナリーツール この動画では、FXおよびバイナリーオプションのトレーダー向けに特別に開発された、非常に正確で強力な取引ツールである Miraculous Indicator を紹介しています。このインジケーターがユニークなのは、伝説的な ガン・スクエア・オブ・ナイン と ガンの振動の法則 に基づいている点で、現代の取引で利用できる最も正確な予測ツールの一つとなっています。 Miraculous Indicatorは 完全に非リペイント であり、ローソク足が確定した後にシグナルが変化したり消えたりすることはありません。つまり、見たものがそのまま利用できます。これにより、トレーダーは自信を持ってエントリーおよびエグジットを行うための信頼性と一貫性のある根拠を得ることができます。 主な特徴: ガン・スクエア・オブ・ナインとガン理論に基づいて構築 100%非リペイントのシグナルシステム すべての時間枠(M1、M5、H1、H4、日足、週足)で機能 FXおよびバイナリーオプション取引
Precautions for subscribing to indicator This indicator only supports the computer version of MT4 Does not support MT5, mobile phones, tablets The indicator only shows the day's entry arrow The previous history arrow will not be displayed (Live broadcast is for demonstration) The indicator is a trading aid Is not a EA automatic trading No copy trading function The indicator only indicates the entry position No exit (target profit)  The entry stop loss point is set at 30-50 PIPS Or the front hi
Pulse Scalping Line - an indicator for identifying potential pivot points. Based on this indicator, you can build an effective Martingale system. According to our statistics, the indicator gives a maximum of 4 erroneous pivot points in a series. On average, these are 2 pivot points. That is, the indicator shows a reversal, it is erroneous. This means that the second signal of the indicator will be highly accurate. Based on this information, you can build a trading system based on the Martingale
El indicador "MR BEAST ALERTAS DE LIQUIDEZ" es una herramienta avanzada diseñada para proporcionar señales y alertas sobre la liquidez del mercado basándose en una serie de indicadores técnicos y análisis de tendencias. Ideal para traders que buscan oportunidades de trading en función de la dinámica de precios y los niveles de volatilidad, este indicador ofrece una visualización clara y detallada en la ventana del gráfico de MetaTrader. Características Principales: Canal ATR Adaptativo: Calcula
BinaryIndicator is a highly accurate indicator for trading binary options. It shows excellent results in scalping. This indicator is based in multifactor analysis of trend indicators, as well as confirmation oscillators, which in the end gives an increased accuracy of signals. Advantages of the indicator Increased accuracy of signals. Excellent results when trading binary options with a short expiration time from M30 to M1 . It works on any timeframes. Works with any trade symbols. Parameters
Rtc ML Ai | Predictor CORE MACHINE LEARNING ENGINE Adaptive ML Market Predictor – Multi-Bar Trend & Candle Forecast What This Indicator Does This indicator is a  real-time market prediction engine  designed to analyze price behavior and estimate  future market tendencies . Unlike conventional indicators, this system  does not rely on static parameters or historical curve-fitting , but adapts its internal state dynamically during live market operation. Instead of using static rules, the indic
FFx Engulfing Setup Alerter gives trade suggestions with Entry, Target 1, Target 2 and StopLoss. Below are the different options available: Entry suggestion - pips to be added over the break for the entry 3 different options to calculate the SL - by pips, by ATR multiplier or at the pattern High/Low 3 different options to calculate the 2 TPs - by pips, by ATR multiplier or at Risk/Reward Offset the dashboard - any place on the chart Remove the suggestion once the price reached the SL line Lines
FFx InsideBar Setup Alerter gives trade suggestions with Entry, Target 1, Target 2 and StopLoss. Below are the different options available: Entry suggestion - pips to be added over the break for the entry Minimum candle size - to avoid too close buy/sell entry suggestions 3 different options to calculate the SL - by pips, by ATR multiplier or at the pattern High/Low 3 different options to calculate the 2 TPs - by pips, by ATR multiplier or at Risk/Reward Offset the dashboard - any place on the c
FFx OutsideBar Setup Alerter gives trade suggestions with Entry, Target 1, Target 2 and StopLoss. Below are the different options available: Entry suggestion - pips to be added over the break for the entry. 3 different options to calculate the SL - by pips, by ATR multiplier or at the pattern High/Low. 3 different options to calculate the 2 TPs - by pips, by ATR multiplier or at Risk/Reward. Offset the dashboard - any place on the chart. Remove the suggestion once the price reached the SL line.
FFx PinBar Setup Alerter gives trade suggestions with Entry, Target 1, Target 2 and StopLoss. Below are the different options available: Entry suggestion - pips to be added over the break for the entry Minimum candle size - to avoid too small candles 3 different options to calculate the SL - by pips, by ATR multiplier or at the pattern High/Low 3 different options to calculate the 2 TPs - by pips, by ATR multiplier or at Risk/Reward Offset the dashboard - any place on the chart Remove the sugges
The purpose of this new version of the MT4 standard indicator provided in your platform is to display in a sub-window multiple timeframes of the same indicator with its divergences. See the example shown in the picture below. But the display isn't like a simple MTF indicator. This is the real display of the indicator on its timeframe. Here's the options available in the FFx divergences indicator: Select the timeframes to be displayed (M1 to Monthly) Define the width (number of bars) for each tim
The purpose of this new version of the MT4 standard indicator provided in your platform is to display in a sub-window multiple timeframes of the same indicator with its divergences. See the example shown in the picture below. But the display isn't like a simple MTF indicator. This is the real display of the indicator on its timeframe. Here's the options available in the FFx divergences indicator: Select the timeframes to be displayed (M1 to Monthly). Define the width (number of bars) for each ti
The FFx Dashboard MTF alerter will show you on a single chart all the timeframes (M1 to Monthly) with their own status for the indicator. 2 Alert Options: Single timeframe: each selected timeframe alert separately when a signal occurs Multi timeframes: all selected timeframes must agree for an alert to be triggered Both options have an input to select the timeframes to be used for the alert(s). How to Understand the Status: Green/Red square: histogram above/below 0 line Green square + Red bord
The FFx Dashboard MTF alerter will show you on a single chart all the timeframes (M1 to Monthly) with their own status for the indicator. 2 Alert Options: Single timeframe: each selected timeframe alert separately when a signal occurs Multi timeframes: all selected timeframes must agree for an alert to be triggered Both options have an input to select the timeframes to be used for the alert(s). How to understand the status: Green/Red square: RSI above/below 50 line Green square + Red border: R
The FFx Dashboard MTF alerter will show you on a single chart all the timeframes (M1 to Monthly) with their own status for the indicator. 2 Alert Options: Single timeframe: each selected timeframe alert separately when a signal occurs Multi timeframes: all selected timeframes must agree for an alert to be triggered Both options have an input to select the timeframes to be used for the alert(s). How to understand the status: Green/Red square: Stoch above/below 50 line Green square + Red border:
The FFx Dashboard MTF alerter will show you on a single chart all the timeframes (M1 to Monthly) with their own status for the indicator. 2 Alert Options: Single timeframe: each selected timeframe alert separately when a signal occurs Multi timeframes: all selected timeframes must agree for an alert to be triggered Both options have an input to select the timeframes to be used for the alert(s). How to understand the status: Green/Red square: Price above/below Cloud (Kumo) Green square + Red bo
The FFx Dashboard MTF alerter will show you on a single chart all the timeframes (M1 to Monthly) with their own status for the indicator. 2 Alert Options: Single timeframe: each selected timeframe alert separately when a signal occurs Multi timeframes: all selected timeframes must agree for an alert to be triggered Both options have an input to select the timeframes to be used for the alert(s). How to understand the status: Green/Red square: MA pointing Up/Down Green square + Red border: MA po
The FFx Dashboard MTF alerter will show you on a single chart all the timeframes (M1 to Monthly) with their own status for the indicator. 2 Alert Options: Single timeframe: each selected timeframe alert separately when a signal occurs. Multi timeframes: all selected timeframes must agree for an alert to be triggered. Both options have an input to select the timeframes to be used for the alert(s). How to understand the status: Green square: Price above PSAR Red square: Price below PSAR Options
The FFx Dashboard MTF alerter will show you on a single chart all the timeframes (M1 to Monthly) with their own status for the indicator. 2 Alert Options: Single timeframe: each selected timeframe alert separately when a signal occurs Multi timeframes: all selected timeframes must agree for an alert to be triggered Both options have an input to select the timeframes to be used for the alert(s). How to understand the status: Green/Red square: CCI above/below levels (ie. 100/-100) Grey square: C
The FFx Dashboard MTF alerter will show you on a single chart all the timeframes (M1 to Monthly) with their own status for the indicator. 2 Alert Options: Single timeframe: each selected timeframe alert separately when a signal occurs Multi timeframes: all selected timeframes must agree for an alert to be triggered Both options have an input to select the timeframes to be used for the alert(s). How to understand the status: Green/Red square: ADX above level Grey square: ADX below level Red bor
The FFx Dashboard MTF alerter will show you on a single chart all the timeframes (M1 to Monthly) with their own status. 2 Alert Options: Single timeframe: each selected timeframe alert separately when a signal occurs Multi timeframes: all selected timeframes must agree for an alert to be triggered Both options have an input to select the timeframes to be used for the alert(s). How to understand the status: Green/Red square: bullish/bearish candle Options available in the FFx Dashboard Alerter
The [GRAFF] III manual trading system is based on multiple MetaTrader (MT4) indicators. Together, the entire PACK of GRAFF III indicators makes an advanced trading tool. The system consists of over 20 different custom-built indicators which have been carefully selected and tested in the long term to produce strong and efficient trading signals. The particular indicators are based on different mathematical formulas, so the entire system is calibrated to remove false signals from its own indicator
FFx Universal Strength Meter PRO is more than a basic strength meter. Instead of limiting the calculation to price, it can be based on any of the 19 integrated strength modes + 9 timeframes. With the FFx USM, you are able to define any period for any combination of timeframes. For example, you can set the dashboard for the last 10 candles for M15-H1-H4… Full flexibility! Very easy to interpret... It gives a great idea about which currency is weak and which is strong, so you can find the best pai
Pan PrizMA CD Phase is an analogue of the МetaТrader 5 indicator , and is an option based on the Pan PrizMA indicator. Details . Averaging by a quadric-quartic polynomial increases the smoothness of lines, adds momentum and rhythm. Extrapolation by the sinusoid function near a constant allows adjusting the delay or lead of signals. The value of the phase - wave status parameter (which is close in meaning to the trigonometric phase or the angle of the radius-vector rotation in the trigonometric p
The Name Green Wall : Arrows hits a lot of TP, by changing the idea of non using SL as something bad, but instead use Small TP and a lot of free Margin and Patience. Use micro TP and a lot of Free Margin with this indicator on Forex. It also can be used with Binary Options. This strategy is intended to be traded Manually. This Indicator runs on Open Bar, arrows will delete when price are against it. The only Indicator Parameter is Alerts true/false, all the rest is included inside the code. Arro
Golden Monowave is monowave indicator, the monowave theory is one of Elliott wave approach and one of most complicate and accurate method. Golden Monowave can shortcut many major steps to identify and describe the monowave. It works on any timeframe and with any trading instrument, including currencies, indices, futures, etc. Input Parameters initial_Bars - set the initial number of bars to calculate. wave_color - select the color of the wave. label_color - select the color of labels. temp_labe
This indicator displays in a separate window the difference between the number of points which increased the price, and the number of points that decreased the price during the time interval specified in the settings. The time interval for calculation is expressed as the number of bars of the chart the indicator is attached to. This approach allows you to evaluate the movement direction (growth or fall) of the instrument's price, the strength of the movement and the size of the movement in point
作者のその他のプロダクト
*This is tradingview indicator converted to mql4* The Chandelier Exit Indicator is a popular technical analysis tool developed by Chuck LeBeau. It is designed to help traders identify potential exit points for their trades based on market volatility and the concept of trailing stops. The Chandelier Exit Indicator consists of three main components: Average True Range (ATR): The indicator utilizes the Average True Range, which measures market volatility. The ATR calculates the average range betwe
*This is TradingView indicator converted to mql4* The SuperTrend V indicator is a popular technical analysis tool used to identify trends and potential trend reversals in financial markets. It is based on the concept of the SuperTrend indicator but incorporates additional features and variations. The SuperTrend V indicator uses a combination of price action and volatility to determine the trend direction and generate trading signals. Here are the key components and features of the indicator: Ca
*This is tradingview indicator converted to mql4* The CM Slingshot System Indicator is a trading tool that aims to identify potential trade setups based on market volatility and price action. It is designed to help traders spot entry and exit points in trending markets. The CM Slingshot System Indicator combines multiple indicators and techniques to generate trading signals. Here are the key features and components of the indicator: Bollinger Bands: The indicator incorporates Bollinger Bands, w
*This is tradingview bot converted to mql4* The UT Bot Alert Indicator is an advanced technical analysis tool designed to help traders optimize their trading performance. This innovative indicator is based on the proven UT Bot system, which utilizes multiple indicators to deliver accurate signals that can help traders make better decisions. The UT Bot Alert Indicator provides a range of features that can help you stay on top of market trends and capitalize on opportunities. Here are some of its
UT Bot Alerts is a technical indicator for MetaTrader 5 that highlights potential directional changes based on momentum conditions. The indicator marks signal points directly on the chart and can generate optional notifications for convenience. The signal generation logic can operate in two modes: Closed-bar mode: signals are confirmed only after the bar closes. Live-bar mode: signals are displayed during the formation of the current bar. Both modes are available depending on the user's preferr
*This is trading view indicator converted in mql5* The HA Market Bias Indicator is a popular tool used in trading and technical analysis, designed to help traders identify market bias and potential trend reversals. It is commonly used in conjunction with candlestick charts and provides valuable insights into market sentiment. The indicator is based on the Heiken Ashi (HA) candlestick charting technique, which aims to filter out market noise and provide a smoother representation of price action.
The trendlines with breaks indicator return pivot point based trendlines with highlighted breakouts. Users can control the steepness of the trendlines as well as their slope calculation method. Trendline breakouts occur in real-time and are not subject to backpainting. Trendlines can however be subject to repainting unless turned off from the user settings. The indicator includes integrated alerts for trendline breakouts. Any valid trendlines methodology can be used with the indicator, users
Note: Kindly inbox me for setfile AI Range Breaker watches a time window you choose each day, marks that session’s high and low , then automatically places pending buy/sell orders just outside the range. If price breaks out, the EA manages the trade with breakeven, candle-based trailing, optional partial close, and a single scale-in once price moves in your favor. If nothing happens, the pending orders are removed after a set number of candles—keeping your chart and account clean. Best use Work
Trade. Allows you to perform basic trading operations in one click directly from the chart. Trading operations: Open Buy and Sell market positions with one click. Specify lot size manually before opening a trade. Set Stop Loss and Take Profit as price levels . Stop Loss and Take Profit are automatically initialized at a fixed distance from the current market price (default: ±50 pips , symbol-aware). Fully supports Forex, Metals (XAUUSD), Indices, and other MT5 symbols with correct price formatti
SMF Cloud is a clean, lightweight chart indicator that visualizes directional market flow using an adaptive trend “cloud”, dynamic volatility bands, retest markers, and a TradingView-style strength gauge. It is designed for fast decision-making: identify trend shifts, measure trend strength, and spot pullback/retest opportunities at a glance. Key Features Smart Money Flow Trend Cloud Smooth trend baseline (EMA or ALMA) with optional additional smoothing. Clear bullish/bearish flow visualization
This indicator builds a Pivot Anchored Volume Profile (VAP/VPOC approximation using tick volume) and automatically splits the profile into pivot-to-pivot segments , giving you a clean, TradingView-like view of where volume concentrated during each swing. It draws a horizontal histogram for every segment and highlights the Value Area and key levels, making it easy to spot acceptance/rejection zones, high-volume nodes, and potential support/resistance. Key Features Segmented Volume Profile (Pivot-
Chandelier Exit PRO A precise and reliable trend-following indicator for MetaTrader 5 Chandelier Exit PRO is a professionally engineered implementation of the Chandelier Exit indicator, designed to closely match the original version in both logic and signal behavior. It provides clear trend direction, dynamic stop levels, and well-timed reversal signals, making it suitable for traders who require consistency and accuracy in their decision-making. Core Features Accurate Logic This indicator repli
フィルタ:
1970282
94
1970282 2024.07.30 16:49 
 

ユーザーは評価に対して何もコメントを残しませんでした

レビューに返信