CrossMap MTF MA Zones
- インディケータ
- バージョン: 1.6
- アップデート済み: 26 7月 2026
- アクティベーション: 5

Stop switching between charts just to understand the moving-average structure. CrossMap MTF MA Zones brings every important crossover, gap, age, and origin zone onto one chart.
CrossMap MTF MA Zones is a clean, fully adjustable multi-timeframe moving-average indicator designed to show where each crossover began, how mature it is, and whether the distance between the averages is expanding or shrinking.
The indicator can monitor every standard timeframe from M1 to MN1 while displaying only the timeframes selected by the user.
It is suitable for fast combinations such as 5/13, medium-term combinations such as 9/50, or long-term combinations such as 50/200.
Multi-timeframe information panel
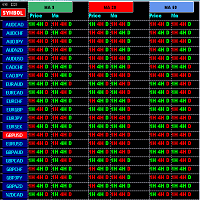
The clear InfoBox displays:
- TF — monitored timeframe
- CROSS — current bullish or bearish MA relationship
- X AGE — number of bars since the latest crossover
- LIVE GAP — current distance between the fast and slow averages
- GAP STATE — whether the MA gap is expanding or shrinking
Bullish information is displayed in lime, bearish information in red, and averages close to crossing can be highlighted in yellow using an adjustable threshold.
Each timeframe can be enabled or disabled independently, allowing the user to create a compact panel containing only the timeframes relevant to their trading.
Crossover lines and price zones
For every enabled timeframe, the indicator can display:
- The vertical line where the latest crossover occurred
- A clear bullish or bearish crossover label
- Horizontal rays from the high and low of the crossover candle
- Independent controls for crossover lines and rays
The vertical crossover line remains visible as a historical reference.
To avoid misleading support and resistance areas, the optional ray filter displays:
- Bullish crossover zones only when they are below current price
- Bearish crossover zones only when they are above current price
This keeps bullish zones functioning as potential support and bearish zones functioning as potential resistance.
Fully adjustable moving averages
Users can configure:
- Fast MA period
- Slow MA period
- SMA, EMA, SMMA, or LWMA method
- Applied price
- Color, width, and line style for each average
- Crossover confirmation settings
- Optional minimum crossover-gap buffer
Flexible gap analysis
The indicator measures the live distance between the two moving averages and classifies it as:
- EXP — the gap is expanding
- SHR — the gap is shrinking
The user can choose how many bars are used for this comparison.
An adjustable near-cross threshold can highlight small gaps in yellow, making developing crossover conditions easier to identify.
Typical use
A trader can use a higher timeframe for structure and a lower timeframe for execution.
For example:
Use the M5 crossover direction and cross-candle zone to identify the larger setup, then use M1 to time the entry.
The same approach can be applied to any selected combination of timeframes and moving-average periods.
Main features
- Works from M1 through MN1
- Fully adjustable fast and slow moving averages
- Multi-timeframe bullish and bearish crossover direction
- Bars elapsed since each crossover
- Live MA-gap measurement
- Adjustable EXP/SHR lookback
- Adjustable yellow near-cross threshold
- Latest crossover vertical lines
- Optional crossover-candle high/low rays
- Bullish support and bearish resistance ray filtering
- Independent timeframe controls
- Adjustable InfoBox size, location, colors, and columns
- Works with Forex, metals, indices, oil, and cryptocurrencies
- No trading, order management, or automated entry logic