Gold Session Liquidity Map Engine

Session Liquidity Map Engine — Sydney, Asia, German, UK & US Range Structure for MT4

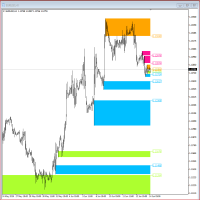
Session Liquidity Map Engine is a professional MetaTrader 4 indicator designed to map the most important intraday trading sessions directly on your chart.


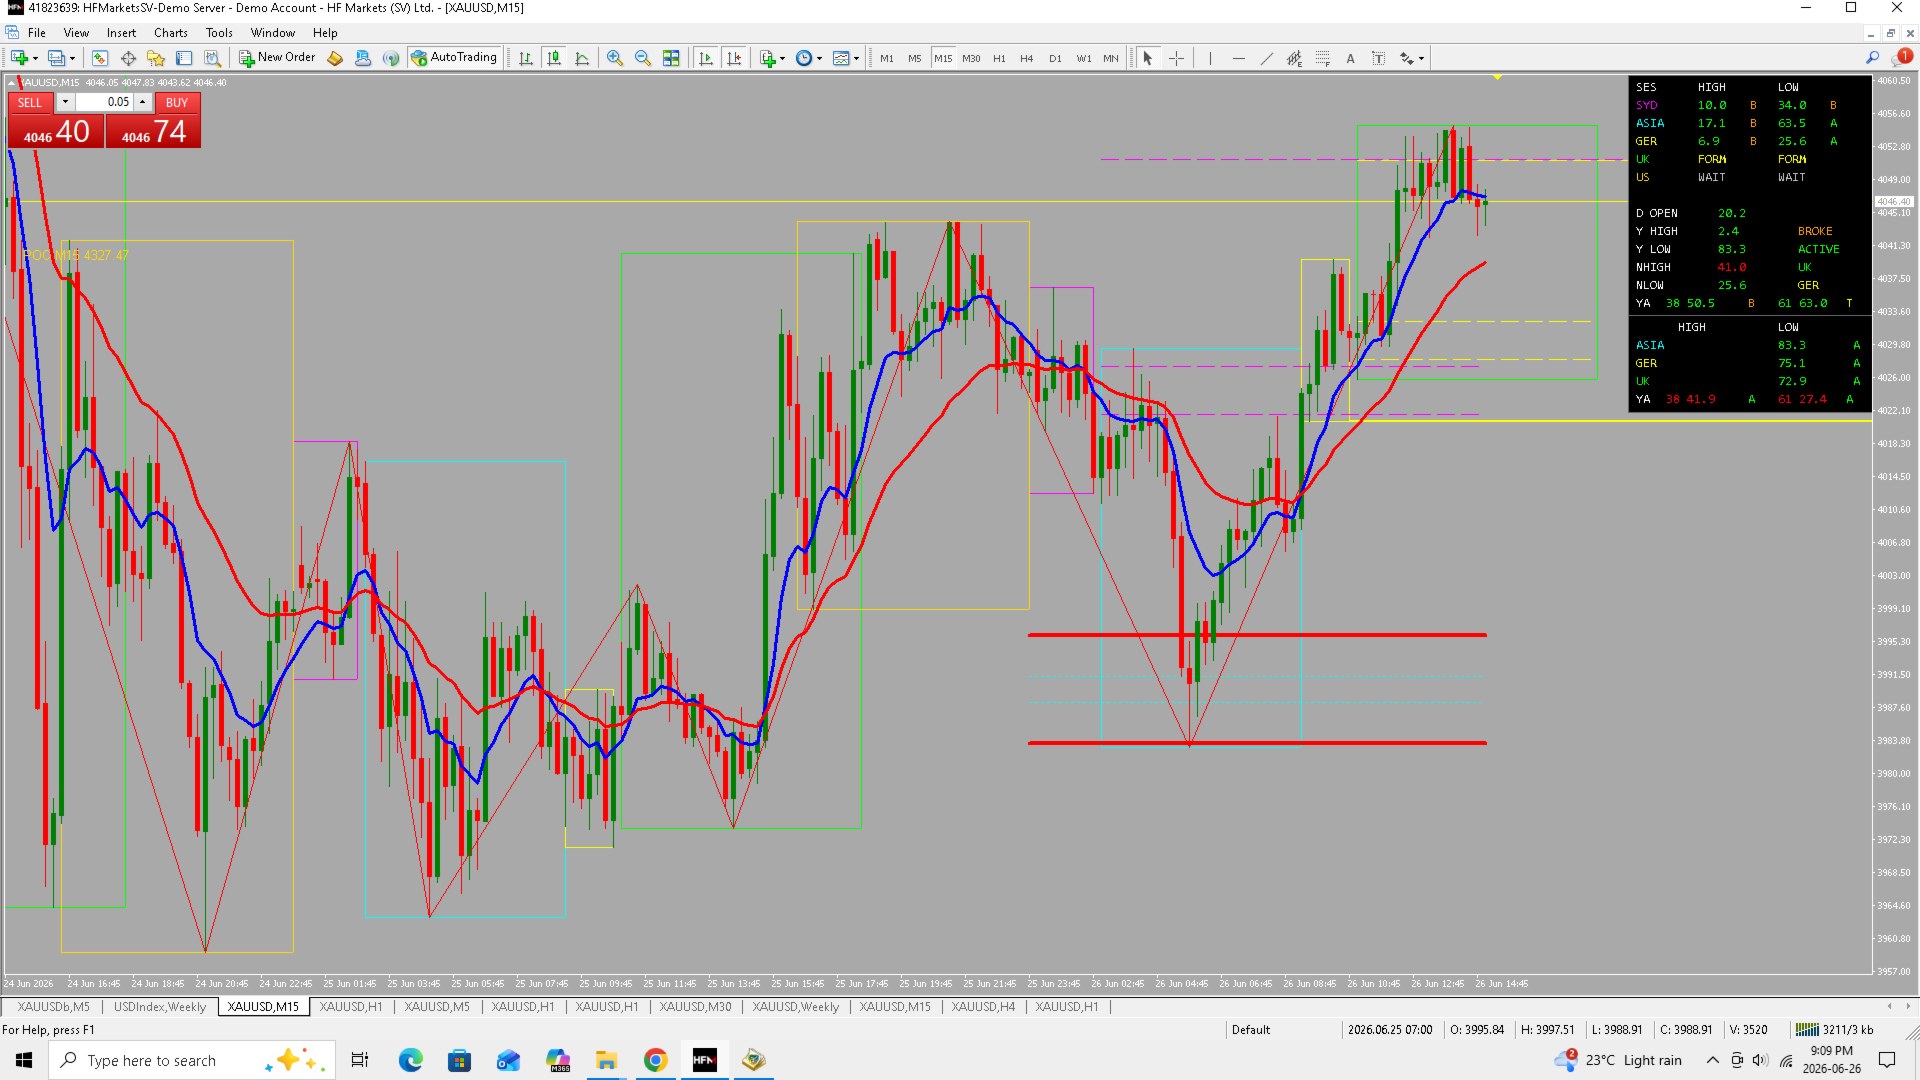
The indicator automatically draws key session boxes, tracks session highs and lows, identifies active and taken liquidity levels, and displays a compact real-time information panel so traders can quickly understand where price is in relation to the major market sessions.

This tool is built for traders who use session highs/lows, breakout structure, liquidity sweeps, range expansion, retests, and intraday market timing.

Instead of manually drawing session boxes every day, the indicator organizes the structure for you.

What This Indicator Does

The indicator tracks and displays important session-based market structure, including:

  • Sydney session range
  • Asia session range
  • German session range
  • UK session range
  • US session range
  • Daily open
  • Previous day high and low
  • Active session highs/lows
  • Taken and untaken liquidity levels
  • Live distance from important levels
  • Session breakout and retest areas
  • Clean visual boxes and projection levels

The goal is to help traders see where liquidity has formed, where price has already swept, and which levels may still be important during the trading day.

Main Features

Automatic Session Boxes

The indicator draws major market session ranges automatically, helping traders separate the trading day into clear structural zones.

Sydney / Asia / German / UK / US Session Tracking

Each session can be used to identify range formation, breakout direction, retests, and possible liquidity sweeps.

Liquidity Map Info Panel

A compact information box shows important session data in real time, including high/low status, active levels, and live distance from key prices.

Daily Open Awareness

The daily open is included as an important reference point for intraday bias, reaction, and price positioning.

Previous High / Low Tracking

The tool monitors previous day levels and helps traders see whether those levels are still active or already taken.

Active and Taken Level Logic

The indicator helps separate levels that are still active from levels that have already been swept or broken.

Range Projection and Reaction Zones

Session ranges can act as the base for future reaction levels, breakout targets, and retest zones.

Clean Chart Layout

The boxes and lines are designed to keep the chart readable while still giving useful structure.

Works on Multiple Timeframes

Useful on lower timeframes for intraday execution and higher intraday timeframes for broader session structure.

Why Session Structure Matters

Many intraday moves are built around session highs and lows.

A session range often becomes the base for the next expansion move. Price may break one side, return to the range, sweep liquidity, or continue toward the next important session level.

This indicator helps traders see that structure clearly.

For example:

  • Sydney may form the first liquidity range
  • Asia may expand or remain inside that structure
  • German and UK sessions may break or sweep Asia levels
  • US may revisit earlier session liquidity later in the day

By keeping these levels visible, traders can better understand the relationship between session ranges and price movement.

How Traders Can Use It

You can use this indicator to:

  • Mark session highs and lows automatically
  • Identify active liquidity levels
  • Watch for session breakouts
  • Monitor retests after a sweep
  • Track daily open reaction
  • See whether previous highs/lows are still active
  • Compare current session position against earlier sessions
  • Build a cleaner intraday trading plan
  • Reduce manual chart drawing

This is especially useful for traders who follow Asia range breaks, London/UK liquidity moves, German session structure, New York continuation, and intraday gold or forex price action.

Best For

  • Gold traders
  • Forex traders
  • Index traders
  • Intraday traders
  • Session traders
  • Liquidity traders
  • Breakout and retest traders
  • Price action traders
  • Traders who use daily open, session highs, and session lows

Important Note

This indicator is a visual analysis tool.
It does not open, manage, or close trades automatically.

It is designed to help traders read session structure more clearly and combine that information with their own strategy and risk management.

No indicator can predict the market with certainty. Always use proper risk control.

おすすめのプロダクト
Knowledge of the strength and weakness of each currency is vital for every forex trader. Our   Currency Strength Meter indicator   measures the strength of eight major currencies (USD, EUR, GBP, CHF, JPY, CAD, AUD, NZD) by using the Relative Strength Index indicator, also known as RSI. The Currency Strength Meter indicator shows you, simply and quickly, when a currency is oversold, overbought, or in "normal area". This way, you can identify which currency is the strongest and the weakest. Our
Multi Pivot Indicator - Professional Trading Tool MULTI PIVOT PRO INDICATOR Professional Multi Pivot Indicator for MT4 5-in-1 Pivot Indicator Professional Trading Tool for MetaTrader 4 ENGLISH TÜRKÇE Multi Pivot Indicator PRO Classic Fibonacci Camarilla Woodie DM What is Multi Pivot Indicator? Multi Pivot Indicator is a professional trading tool that displays 5 different pivot calculation methods on your MetaTrader 4 charts. Pivot points are critical support and resistance
製品概要 Global Session Zones Systemは、 MT4およびMT5 プラットフォーム専用に設計されたチャート補助インジケーターです。目に見えない時間サイクルを直感的なチャート言語に変換し、世界の4大外国為替取引セッション(ニューヨーク、ロンドン、東京、シドニー)の背景ボックス、主要な価格帯、統計パネルを自動的に描画します。これにより、トレーダーは市場の変動範囲とトレンドの強さを正確に把握し、信頼性の高いブレイクアウトシグナルを得ることができます。 主要機能 4セッションの可視化 : 4つの主要セッションの開始/終了時間と色をカスタマイズして設定でき、長方形の背景ボックスで各セッションの範囲を直感的に表示します。 多面的なテクニカル分析 : セッション内の線形回帰トレンドライン、平均線、VWAP(出来高加重平均価格)、高値/安値の延長線をオプションで表示し、トレンドの方向性を判断するのに役立ちます。 リアルタイムステータスパネル : 右上に各セッションのアクティブ状態を表示し、高度なモードではトレンドの強さ(R²)、標準偏差(σ)などの定量的データを提供します。 イ
Sinyal Tren Non-Repaint Cerdas Pro Smart Non-Repaint Trend Signal Pro adalah indikator teknis yang ampuh dan sangat andal yang dirancang untuk MetaTrader 4. Indikator ini menggabungkan logika pengikut tren yang cerdas dengan pelacakan pembalikan berbasis momentum untuk memberikan sinyal panah Beli dan Jual dengan probabilitas tinggi dan siap pakai langsung pada grafik Anda. Dengan menyaring kebisingan pasar, indikator ini membantu baik trader pemula maupun veteran untuk menangkap pergerakan pas
This indicator scans and displays currency pairs that have recently aligned moving averages on a given timeframe. You can configure which pairs the indicator will scan. It also includes all types of alert options. Bullish MA Alignment =  MA1>MA2>MA3>MA4>MA5 Bearish MA Alignment =  MA1<MA2<MA3<MA4<MA5 Features Attach to one chart and scans all the currency pairs configured and visible in the Market Watch Window It can monitor all the available timeframes from M1 to MN1 and sends alerts on every
you are in a trade making profit... should you take profit now or wait...? This easy to use Dynamic Take Profit Indicator  helps you to decide when to get out  of a winning trade. Or you can supervise or overrule any EA when to close an open order when manual trading, or read out the buffers[1][2] to integrate in an Expert! As soon as the price crosses  the yellow line, price direction should reverse soon and orders should be closed. The band is dynamic and changing with every new candle as it
SMART TRADE PANEL PRO MT4用 プロフェッショナル手動トレードユーティリティ Smart Trade Panel PRO V3 は、高速な注文執行、高度なポジション管理、そしてチャート上で直接利用できるプロフェッショナルツールを求めるトレーダー向けに開発された、MetaTrader 4 用の高機能トレードパネルです。 Smart Trade Panel PRO V3 は、手動トレード、スキャルピング、Forex Trading、Gold Trading、Crypto CFD Trading 向けに設計されています。 このユーティリティは、高速な操作性、プロフェッショナルなポジション管理、さらに Breakeven、Trailing Stop、Reverse Position、統合型 Recovery システムなどの高度な機能を組み合わせています。 シンプルで軽量かつ高効率なインターフェースを維持しながら、手動トレードをより簡単かつ快適に行えるよう開発されています。 対応市場: - Forex - Gold (XAUUSD) - 指数 - Crypto CFD -
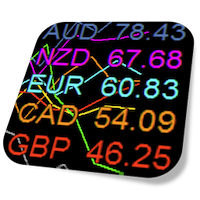
Currency Strength Meter is the easiest way to identify strong and weak currencies. This indicator shows the relative strength of 8 major currencies + Gold: AUD, CAD, CHF, EUR, GBP, JPY, NZD, USD, XAU. Gold symbol can be changed to other symbols like XAG, XAU etc. By default the strength value is normalised to the range from 0 to 100 for RSI algorithm: The value above 60 means strong currency; The value below 40 means weak currency; This indicator needs the data of all 28 major currency pairs a
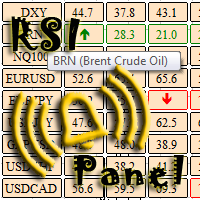
The RSI Panel MTF indicator has been created in order to have the ability to monitor the values of the standard RSI indicator from a multitude of timeframes and symbols on a single chart, as well as to receive timely notifications about the trading opportunities using an audio signal or a notification. The indicator can output both the indicator values, and only the indicator signals (confirmed and expected). A user-friendly feature for selecting the required symbol has been implemented - simply
SIGNALINE INDICATOR This indicator for all pairs and all timeframes I have just completed the M5 timeframe for deep optimization EURJPY yet. EURJPY M5 Optimization ( TP=150 , SL=130 , IndicatorPeriod=6 , Mov1=22 , Mov2=48 ) (*)Added 20.05.2019 You can find this signal page below https://www.mql5.com/en/signals/583477 Other optimizasyon results will be added on this signalpage. Input Parameters: IndicatorPeriod: Default is 8. Mov1               : Default is 21. Mov2               : Default is 48.
Switching between multiple tabs, applying multiple indicators at the same screen. All this overloads the screen and consumes the system resources. The "Scorpion Ultimate Dashboard" comes with the solution, combining 12 indicators in a simple dashboard. It provides the trader with the ability to observe a currency pair from many indicators, and thus being able to glimpse many currency pairs in a short amount of time. The available indicators in the dashboard : - Moving Average Period 5 - Moving
Market Structure ICT インジケーター 1. 自動化された市場構造 (Market Structure) 最大の利点は、主観的な判断によるミスを減らせることです。 正確なトレンド識別: トレンド継続のための BOS (Break of Structure) と、トレンド反転のための CHoCH (Change of Character) を自動的に識別します。 スイングの分類: ユーザーは市場構造のタイプ(短期、中期、長期)を選択でき、スキャルパーにもスイングトレーダーにも適しています。 2. プロフェッショナル・ダッシュボード 他のタイムフレームを確認するために画面を切り替える必要はありません。 一目でわかる分析: ダッシュボードは、1つの画面にすべてのタイムフレーム(M1からW1)のステータスを表示します。 スコアリングシステム: 小さなタイムフレームからのスコアを集計し、 全体的なバイアス (Overall Bias) (例:「強い強気」や「混在」)を要約します。これにより、自信を持ってエントリーできます。 トレンドの鮮度: BOSが「フレッシュブレイク(発生
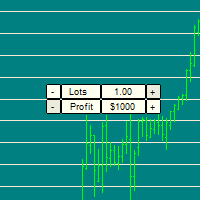
Easily manage your risk and position sizing! It can be tricky to size your trade in the moment, due to different currency / commodity values. For example, placing a 1 Lot position on XAUUSD can easily blow an account that could handle 1 lot on GBPUSD. See screenshots to see how Gold can move $500 on 1 lot much faster than GBPUSD. THe indicator draws horizontal lines that allow you to easily compare the potential risk/reward across timeframes and symbols. ---- Inputs are: Risk Size: The Loss/Pro
タイトル:   Global Session Timeline Dashboard MT4 (グローバルセッションタイムライン) 説明:   Global Session Timelineは、主要な外国為替市場(シドニー、東京、ロンドン、ニューヨーク)のオープンと締め切りをMT4チャートの上に直感的に表示するインタラクティブなインジケーターです。 リアルタイムダッシュボードと垂直線で現在開いている市場を即座に把握することができ、セッションオーバーラップ時に発生する流動性とボラティリティを活用するデートレーダーに不可欠な環境を提供します。 主な機能: インタラクティブダッシュボード: チャート内でマウスで自由にドラッグ(移動)できるきれいなUIパネルを介して、各セッションの進行状況をリアルタイムの水平バー(Bar)形式で表示します。 ワンクリックラインコントロール: ダッシュボードの[ON] / [OFF]ボタンをクリックして、開放/締め切りを示すチャート垂直線をすぐにオン/オフできます。 ステータスメモリ機能: タイムフレームを変更したりMT4端末を再起動しても、ユーザーがドラッグし
FREE
The Pairs Spread indicator has been developed for the popular strategy known as pairs trading, spread trading, or statistical arbitrage. This indicator measures the distance (spread) between prices of two directly (positively) correlated instruments and shows the result as a curve with standard deviations. So, traders can quickly identify when the instruments are too far apart and use this information for trade opportunities.  How to use the Pairs Spread indicator Best results are attained whe
Forex Meter Oscillator is an indicator that can give a whole view of forex market from a single chart, measuring currency strenghts among 28 forex pairs (majors and minors). The "oscillator" word is very meaningful: it normalizes currency strenghts in order to provide values in a predefined range (from -1 to 1). What are normalization's advantages? It's so simple, values will always be in a pre-defined range that reflect exactly the current value compared to the last N values. In this way you w
インジケータMTFクリスタリウム矢印は、半自動取引システムであります. これは、すべての通貨ペアで動作します。  インジケータは、三つのルールを使用しています:1)我々は唯一のトレンドで取引、2)"誰もが販売しているときに購入し、誰もが買うときに販売する"、3)価格  インジケータMTF矢印は、内蔵の指標を使用して、複数の時間枠全体のクリスタリウムフィルタルール。 トレンドは、選択した時間間隔で一致した場合、インジケータは、市場に参入するための矢印を与えます。 それからあなた自身の決定をする。 購入する-緑の矢印、売る-赤い矢印。 指標では、ロットを変更したり、EAの取引時間とシャットダウン時間を設定することができます。 また、作業期間と時間フィルタを変更することができます。 ビープ音が鳴ってる  推薦された働く期間D1。 フィルタH1とH4。  設定: TF働く期間(推薦されたD1) Cci_cperiodcomment CCIレベルアップ CCIレベルDn CCI価格 SARステップ SAR最大値 TFのFilter1–(推薦されたH1) TFのFilter
News Robo
Thushara Dissanayake
2 (1)
News Robo Expert Advisor は、ニューストレーダーがニュースリリース中に隠れストップロスを含む未決注文をオープンできるように設計された強力なツールです。取引体験を向上させ、取引を保護するいくつかの機能を提供します。 News Robo の重要な機能の 1 つは、ストップロスの隠蔽です。これは、マーケットメーカーブローカーからストップロスを隠したいニューストレーダーにとって理想的です。利益を得るポジションが得られるとストップロスが自動的に表示されるため、利益を効果的に確保できます。さらに、エキスパートアドバイザーは適切なリスク管理手法を採用して、取引資金を確実に保護します。 News Robo では、保留中の注文を開くには、クイック モードとタイム モードの 2 つのオプションがあります。クイック モードを使用すると、デフォルト設定に基づいて保留中の注文を迅速にオープンできるため、ニュース時間を手動で設定するのを忘れた場合に便利なソリューションとなります。一方、時間モードを使用すると、未決注文をオープンする正確な時間を指定できるため、より柔軟でカスタマイズが可能にな
Currency Strength Meter is the easiest way to identify strong and weak currencies. This indicator shows the relative strength of 8 major currencies + Gold: AUD, CAD, CHF, EUR, GBP, JPY, NZD, USD, XAU. Gold symbol can be changed to other symbols like XAG, XAU etc. By default the strength value is normalised to the range from 0 to 100 for RSI algorithm: The value above 60 means strong currency; The value below 40 means weak currency; This indicator needs the data of all 28 major currency pairs a
Close at time is a very useful EA to close specific positions at specific time. It also provides additional condition to setup. Close specific positions at time. Close specific positions which currently profits. Close specific long positions only. Close specific short positions only. Close specific pending orders. It is useful to support your trading strategies. Parameters description magic : Target magic number to close. close_time_hr: Hour to close. (MetaTrader 4 terminal time) close_time_min
FREE
その   ドンチャンブレイクアウトスキャナープロ   包括的な   マルチシンボル監視ツール   自動的に追跡する   ドンチャンチャネルブレイクアウト   様々な取引商品と時間枠にわたって、この高度なスキャナーは、古典的な手法を用いて継続的に価格動向を分析します。     ドンチャンチャネル法は 、選択した銘柄のポートフォリオ全体にわたって重要なブレイクアウトパターンを特定します。システムは、これらの取引機会を直感的な画面で提示します。     色分けされたボタンインターフェース 。緑色のボタンは   強気のブレイクアウト   赤いボタン信号   弱気なブレイクアウトは それぞれ時間枠が明確にラベル付けされており、すぐに評価できます。 これ   マルチタイムフレーム機能   トレーダーは、短期的なM1の動きから長期的なD1とW1のトレンドまで、さまざまな時間軸でブレイクアウトの収束を監視できます。スキャナーの   ダッシュボードスタイルのディスプレイ   現在の市場状況を体系的に概観し、どの商品が最も有望であるかを強調します。     ブレイクアウトの機会   様々な時間軸でシグナル
Note: After installation, please go to Tools>Options>Expert Advisors and add https://porsaj.com to 'Allow WebRequest for listed URL'. Still Problem?! Please check Internet connection! An economic calendar in the context of forex refers to a tool or resource that provides information about upcoming economic events, indicators, and data releases that can potentially impact the financial markets, particularly the foreign exchange market. It helps traders stay informed about key economic announce
****** Easy to understand, correct Trade direction indicator, quick and easy to visualize******* BING Proper Path Indicator(BPP) will show BUY/SELL signals on-screen in an easy-to-understand 'Traffic Light' format. Provides a final 'reassurance' and 'peace of mind' for taking an educated, high probability, low-risk, trade decision. In the same way, you use a rearview mirror for instantaneous information while taking a driving decision, the same way BING Proper Path Indicator(BPP) will help you
"Supply / Demand Zones" The concepts of supply and demand zones   are undoubtedly two of the most highly discussed attributes of technical analysis. Part of analysing chart of pattern , these terms are used by traders   to refer to price levels i n charts that tend to act as barriers, preventing the price of an asset from getting pushed in a certain direction. At first, the explanation and idea behind identifying these levels seems easy, but as you'll find out, supply and demand zones can come
Currency Strength Meter is the easiest way to identify strong and weak currencies. This indicator shows the relative strength of 8 major currencies + Gold: AUD, CAD, CHF, EUR, GBP, JPY, NZD, USD, XAU. Gold symbol can be changed to other symbols like XAG, XAU etc. By default the strength value is normalised to the range from 0 to 100 for RSI algorithm: The value above 60 means strong currency; The value below 40 means weak currency; This indicator needs the data of all 28 major currency pairs a
SFire Gold EA
Jacques Scholtz Fourie
This EA is a grid-based trading system. It incorporates several advanced features to manage trades dynamically and adapt to market conditions. Here's a summary of its functionality: I am happy to provide my settings file. Recomendation would be to run on a 20 000 cent account. Key Features: 1. Grid Trading Strategy:    - The EA uses a grid-based approach to open buy and sell trades at predefined price intervals.    - It dynamically adjusts the grid levels based on market conditions and risk se
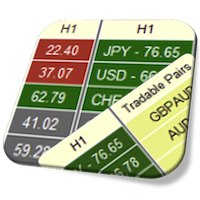
Currency Strength Matrix (CSM) is an indicator that will show you the current strength of the major currencies in several timeframes allowing you to sort the currencies for strength and spot possible trading setups. This indicator is ideal for scalping and in all those events of sudden big moves. This DEMO only shows 4 currencies and 4 timeframes, for the full version please check https://www.mql5.com/en/market/product/24252 How does it work? The CSM compares the value of the current moving ave
FREE
Virtual Exchange Reserve Equity Monitor In an environment where exchanges offer increasingly high leverage ratios, it is all the more important for traders to tightly regulate their level of equity .  This software is designed to be run in the background on any virtual private server that can run Meta Trader 4/5.  It implements basic equity control functions ahead of the broker---allowing users to set their own equity trailing stop, an equity limit to lock-in a certain profit margin, and a unive
FREE
DayTradingArrow v1
Nedyalka Zhelyazkova
5 (3)
" Step into Confident Trading with DayTradingArrow v1! " In trading, confidence comes from clarity, structure, and reliable signals . DayTradingArrow v1 is designed to give you exactly that – a tool that highlights opportunities, filters out noise, and supports smart, disciplined decisions. Every signal is confirmed and actionable , allowing you to trade with confidence rather than guesswork. Key Benefits Clear buy and sell signals for fast, confident decision-making Perfect for beginners and
This is  a dashboard indicator that displays the auto-calculated risk lot, with the given risk percentage & risk points (Stop Loss) and others. The main function of this indicator is to help you calculate your exact scalping risk lots and swing risk lots. Also it displays the active trades of each pair you've executed with the following: type of trade, lot size, symbol, & equity(+/-). Also displays the bar counter set in every 5-minute bar timer. (whichever time frame you're active, the bar time
このプロダクトを購入した人は以下も購入しています
Neuro Poseidon is a new indicator by Daria Rezueva. It combines precise trading signals with adaptive TP/SL levels - creating best possible trades as a result! Message me and get  Neuro Poseidon Assistant  as a gift to automize your trading process! What makes it stand out? 1. Proven profitability on all assets and timeframes 2. Only confirmed BUY and SELL signals present on the chart 3. Adaptive TP & SL levels generated by the software for each trade 4. Easy to understand - suitable for all
Gann Made Easy は、ミスター・ギャンの理論を使用した取引の最良の原則に基づいた、プロフェッショナルで使いやすい外国為替取引システムです。 W・D・ガン。このインジケーターは、ストップロスとテイクプロフィットレベルを含む正確な買いと売りのシグナルを提供します。 PUSH通知を利用して外出先でも取引可能です。 ご購入後、取引方法の説明と優れた追加インジケーターを無料で入手するには、私にご連絡ください! おそらく、ギャンの取引手法についてはすでに何度も聞いたことがあるでしょう。通常、ギャンの理論は初心者のトレーダーだけでなく、すでにある程度の取引経験がある人にとっても非常に複雑なものです。なぜなら、ギャンの取引手法は理論的にはそれほど簡単に適用できるものではないからです。私はその知識を磨き、最良の原則を私の外国為替インジケーターに組み込むために数年を費やしました。 このインジケーターは非常に簡単に適用できます。必要なのは、それをチャートに添付し、簡単な取引推奨事項に従うだけです。このインジケーターは常に市場分析の仕事を行い、取引の機会を探します。適切なエントリーポイントを検出す
M1 SNIPER は使いやすいトレーディングインジケーターシステムです。M1時間足向けに設計された矢印インジケーターです。M1時間足でのスキャルピングのためのスタンドアロンシステムとして、また既存のトレーディングシステムの一部としても使用できます。このトレーディングシステムはM1時間足での取引に特化して設計されていますが、他の時間足でも使用できます。元々、この手法はXAUUSDとBTCUSDの取引用に設計しましたが、他の市場においても役立つと考えています。 インジケーターのシグナルは、トレンドの方向と逆方向に取引できます。インジケーターのシグナルを利用して両方向に取引するのに役立つ特別な取引テクニックをご紹介します。この手法は、特別な動的なサポートとレジスタンスの価格帯を利用することに基づいています。 ご購入後、M1 SNIPER矢印インジケーターをすぐにダウンロードできます。さらに、M1 SNIPERツールのすべてのユーザーに、以下のスクリーンショットに表示されているApollo Dynamic SRインジケーターを無料で提供しています。この2つのインジケーターを組み合わせることで
Prop Firm Sniper MT4  is a professional market structure indicator that automatically identifies high-probability BUY and SELL opportunities using BOS and CHoCH analysis. Recommended Timeframes: For backtesting, use the indicator on   M5 or M15   for Gold (XAUUSD), and   M15 or H1   for more volatile Forex pairs such as   GBPUSD, USDJPY, EURGBP , and similar markets. CONTACT ME AFTER PURCHASE TO CLAIM YOUR FREE BONUSES! Prop Firm Sniper  is a professional market structure indicator designed t
BTMM State Engine Pro by G-Labs — Beat The Market Maker indicator for MetaTrader 4. Asian session range, London and New York kill zones, level progression (L1/L2/L3), peak formation detection (PFH/PFL), entry signals, and a multi-pair scanner from one chart. Stop scanning charts one pair at a time. The State Engine tracks the BTMM daily cycle automatically — Asian box, room boundaries, level blocks, peak formations, and filtered entries — while the scanner dashboard shows level, peak status,
KURAMA GOLD SIGNAL PRO(MT4版)— 7層フィルター・自動TP/SL・品質スコア・サイン履歴保存搭載 XAUUSD完全トレードシステム リアルタイムでリペイントしません。サインが出た瞬間、矢印・エントリー・TP・SLはその場で固定され、後から動きません。あなたがトレードするのは、この「リアルタイムで出たサイン」です。さらにv7.20では、実際に通知されたサインを自動保存し、再起動後もそのまま復元します。 購入者限定特典 買い切りライセンスをご購入いただいた方に、AI Zone Radar($59相当)+完全PDFマニュアルを無料プレゼント。本体価格に$59相当の特典が付いてきます。購入後にMQL5でメッセージをお送りください。 AI Zone Radar: https://www.mql5.com/en/market/product/175834 ゴールドトレーダーのコミュニティで実際に使用され、精度と使いやすさで高く評価されています。 あな
Scalper Inside PRO は、日中のトレンドを読み取り、エントリーする前にトレードを計画するのに役立ちます。独自の内蔵アルゴリズムを使って市場の方向性を評価し、シグナルが出た瞬間に主要な目標価格を計算するため、想定されるエントリー、ストップロス、利益目標を常に前もって確認できます。 本インジケーターは、ヒストリカルデータに基づく詳細なパフォーマンス統計も表示するため、さまざまな銘柄や戦略が過去にどう振る舞ったかを確認し、現在の市場状況に合ったものを選べます。さらに、ご自身の矢印インジケーターを接続して、同じ方法でその統計を確認することもできます。 Scalper Inside PRO マニュアルおよび設定説明: クリックして読む(英語) 本インジケーターはあらゆる銘柄・時間足で動作し(日中トレードには M5 を推奨)、3つの戦略を内蔵しています。単体のスキャルピングツールとしても、トレードシステムの分析コンポーネントとしても使用できます。初心者にも経験豊富なトレーダーにも適していますが、どんなツールでも同じように、最大限に活かすには多少の練習が必要です。 ご購入後、直接
DayTrader PRO DayTrader PROは、ジョン・エリュース(John Ehlers)のラグuerreフィルターと強力な自動最適化エンジンを組み合わせた、高度なトレーディング・インジケーターです。固定されたパラメーターを使用するのではなく、直近の市場状況に基づいて最適な設定を自動的に検索するため、手動による絶え間ない調整をすることなく、変化する市場のボラティリティに適応できます。 本インジケーターは、明確な「買い(BUY)」および「売り(SELL)」シグナルを生成し、現在の市場ボラティリティから算出された適応型のストップロス(Stop Loss)およびテイクプロフィット(Take Profit)レベルを表示します。トレンド、効率レシオ(Efficiency Ratio)、ボラティリティ、およびローソク足フィルターが内蔵されており、精度の低いセットアップを排除し、シグナルの精度を向上させます。 リアルタイム・パフォーマンスパネルには、現在最適化されている設定、プロフィットファクター(Profit Factor)、勝率(Win Rate)、ドローダウン(Drawdown)、
Dynamic Forex28 Navigator - 次世代の Forex 取引ツール。 現在 49% オフ。 Dynamic Forex28 Navigator は、長年人気のインジケーターを進化させたもので、3 つの機能を 1 つにまとめています。 Advanced Currency Strength28 インジケーター (レビュー 695 件)  + Advanced Currency IMPULSE with ALERT (レビュー 520 件) + CS28 コンボ シグナル (ボーナス)。 インジケーターの詳細 https://www.mql5.com/en/blogs/post/758844 次世代の Strength インジケーターが提供するもの  オリジナルで気に入っていたすべての機能が、新機能と精度の向上によって強化されました。 主な機能: 独自の通貨強度計算式。 すべての時間枠でスムーズかつ正確な強度ライン。 トレンドの特定と正確なエントリーに最適です。 ダイナミックマーケットフィボナッチレベル (マーケットフィボナッチ)。 このインジケーターに固有
現在30%OFF! このダッシュボードは、複数のシンボルと最大9つのタイムフレームで動作するソフトウェアの非常に強力な部分です。 このソフトは、弊社のメインインジケーター(ベストレビュー:Advanced Supply Demand)をベースにしています。    Advanced Supply Demand ダッシュボードは、素晴らしい概要を提供します。それは示しています。  ゾーン強度評価を含むフィルタリングされた需給値。 ゾーン内/ゾーンへのPips距離。 ネストされたゾーンがハイライトされます。 選択されたシンボルの4種類のアラートを全ての(9)時間枠で提供します。 それはあなたの個人的なニーズに合わせて高度に設定可能です。 あなたの利益! すべてのトレーダーにとって最も重要な質問です。 市場に参入するのに最適なレベルはどこか? 成功のチャンスとリスク/リターンを得るために、強力な供給/需要ゾーン内またはその近くで取引を開始します。 損切りの最適な位置はどこですか? 最も安全なのは、強力な供給/需要ゾーンの下/上にストップを置くことです。 最適な利益
SR Liquidity は、市場の流動性が集中し、価格が最も強く反応する「隠れたゾーン」を可視化するために設計されたトレーディング指標です。こうした流動性の高いエリアは強力なサポート(支持)およびレジスタンス(抵抗)レベルとして機能し、市場が反転する可能性が最も高いポイントを明確に示してくれます。 単なる一般的なサポートラインやレジスタンスラインを描画するのではなく、「SR Liquidity」は実際の価格変動を分析し、売りと買いの圧力が集中するゾーンを特定します。これらは、市場の真の動きを牽引する「流動性のプール(溜まり場)」そのものです。それらをチャート上に直接可視化することで、価格が実際に反応する前に、その動きを予測することが可能になります。つまり、このインジケーターは価格の方向性が変わる可能性を予測するのです。生のプライスアクションを、市場の重要な水準(転換点となり得るポイント)を示す、明確で実用的なロードマップへと変換してくれます。 このインジケーターは、FX、株価指数、貴金属、仮想通貨など、あらゆる銘柄や時間足で使用可能です。 ご購入後、取引手順や無料の優れた追加インジケ
ご紹介     Quantum Breakout PRO は 、ブレイクアウト ゾーンの取引方法を変革する画期的な MQL5 インジケーターです。 13年以上の取引経験を持つ経験豊富なトレーダーのチームによって開発された Quantum Breakout PROは 、革新的でダイナミックなブレイクアウトゾーン戦略により、あなたの取引の旅を新たな高みに押し上げるように設計されています。 クォンタム ブレイクアウト インジケーターは、5 つの利益ターゲット ゾーンを備えたブレイクアウト ゾーン上のシグナル矢印と、ブレイクアウト ボックスに基づいたストップロスの提案を提供します。 初心者トレーダーにもプロのトレーダーにも適しています。 量子EAチャネル:       ここをクリック MT5バージョン:   ここをクリック 重要!購入後、インストールマニュアルを受け取るためにプライベートメッセージを送ってください。 推奨事項: 時間枠: M15 通貨ペア: GBPJPY、EURJPY、USDJPY、NZDUSD、XAUUSD アカウントの種類: ECN、Raw、またはスプレッドが非
Trend Catcher ind
Ramil Minniakhmetov
5 (11)
トレンドキャッチャーインジケーター トレンドキャッチャーインジケーターは、開発者独自の適応型トレンド分析指標を組み合わせることで、市場価格の動きを分析します。短期的なノイズを除去し、根底にあるモメンタムの強さ、ボラティリティの拡大、価格構造の挙動に焦点を当てることで、真の市場方向性を特定します。また、移動平均線、RSI、ボラティリティフィルターなどの平滑化およびトレンドフィルタリング機能を備えたカスタマイズ指標も使用します。 実際の運用状況のモニタリングやその他の製品については、こちらをご覧ください: https://www.mql5.com/en/users/mechanic/seller ご注意ください。私はTelegramでEAや設定を販売していません。詐欺です。すべての設定はブログで無料で公開しています。 重要!ご購入後すぐにご連絡ください。手順とボーナスをお送りします!
Super Signal – Skyblade Edition プロ仕様のノンリペイント / ノーラグ・トレンドシグナルシステム。卓越した勝率を実現 | MT4 / MT5 対応 1分足、5分足、15分足などの低い時間足で最も効果を発揮します。 主な特徴: Super Signal – Skyblade Edition は、トレンド取引に特化したスマートなシグナルシステムです。マルチレイヤーのフィルターロジックを用いて、明確な方向性と実際のモメンタムに支えられた強力なトレンドのみを検出します。 このシステムは 天井や底を予測するものではありません 。次の3つの条件がすべて満たされた場合にのみシグナルを発生させます: 明確なトレンド方向 モメンタムの増加 健全なボラティリティ構造 市場セッションに基づく流動性分析と組み合わせることで、シグナルの精度とタイミングがさらに向上します。 シグナルの特性: すべての矢印シグナルは 100% 非リペイント / 遅延なし 一度出現したシグナルは固定され、点滅・消失しません チャート上の矢印、情報パネル、ポップアップ通知、音声アラート、プッシュ通知
Advanced Supply Demand
Bernhard Schweigert
4.91 (302)
現在30%オフ 初心者にもエキスパートトレーダーにも最適なソリューション このインジケーターは独自の機能と新しい公式を多数内蔵しており、ユニークで高品質かつ手頃な取引ツールです。このアップデートでは、2つの時間枠ゾーンを表示できるようになります。より長いTFだけでなく、チャートTFとより長いTF(ネストゾーンを表示)の両方を表示できます。すべてのSupply Demandトレーダーの皆さんのお気に召すはずです。:) 重要情報の公開 Advanced Supply Demandの可能性を最大化するには、 https://www.mql5.com/ja/blogs/post/720245 にアクセスしてください。   エントリーまたはターゲットの正確なトリガーポイントを正確に特定できれば取引がどのように改善されるか想像してみてください。新しい基盤となるアルゴリズムに基づいて構築されているため、買い手と売り手の間の潜在的な不均衡をさらに簡単に特定できます。これは、最も強い需要と供給のゾーンと、過去のパフォーマンス(古いゾーンを表示)がグラフィカルに表現されるためです。これらの機能は、最適な
Price & Time Market Structure Indicator A professional market structure tool that analyzes waves through both price and time — not price alone. Main Description NeoWave PRO is a professional market structure indicator for MetaTrader 4 designed for traders who want to move beyond traditional one-dimensional wave tools such as ZigZag, swing indicators, and basic high/low systems. Most wave indicators analyze only one thing: Price. But a real market wave is not only a price movement. A true wave de
AWキャンドルパターンインジケーターは、強力なキャンドルパターンスキャナーと組み合わせた高度なトレンドインジケーターの組み合わせです。これは、最も信頼性の高い30のローソク足パターンを認識して強調表示するための便利なツールです。さらに、それは色付きのバーに基づく現在の傾向分析器です。     サイズ変更と配置が可能なプラグインマルチタイムフレームトレンドパネル。トレンドフィルタリングに応じてパターンの表示を調整する独自の機能。 利点: キャンドルパターンを簡単に識別 結果を再描画しません 内蔵のマルチタイムトレンドパネル 無効なパターンタイプ(1、2、3キャンドル) パターン表示時のトレンドフィルタリングの調整 MT5 version - >   HERE   / Instructions and description  -> HERE 表示されるパターンのリスト: ハンマーパターン ピンアップ/ピンダウン 弱気なハラミ/強気なハラミ 弱気のハラミクロス/強気のハラミクロス ピボットポイント反転アップ/ピボットポイント反転ダウン ダブルバーローとハイクローズ/ダブルバーローとロークロ
All-in-One Trade Indicator (AOTI) – Since 2015. The All-in-One Trade Indicator (AOTI) determines daily targets for EURUSD, EURJPY, GBPUSD, USDCHF, EURGBP, EURCAD, EURAUD, AUDJPY, GBPAUD, GBPCAD, GBPCHF, GBPJPY, AUDUSD, and USDJPY. All other modules work with any trading instruments. The indicator includes various features, such as Double Channel trend direction, Price channel, MA Bands, Fibo levels, Climax Bar detection, and others. The AOTI indicator is based on several trading strategies, and
通貨強さウィザードは、取引を成功させるためのオールインワン ソリューションを提供する非常に強力な指標です。このインジケーターは、複数の時間枠のすべての通貨のデータを使用して、このまたはその外国為替ペアのパワーを計算します。このデータは、使いやすい通貨インデックスと通貨パワーラインの形式で表され、特定の通貨のパワーを確認するために使用できます。 必要なのは、取引したいチャートにインジケーターを接続することだけです。インジケーターは、取引する通貨の実際の強さを示します。このインジケーターは、トレンドに合わせて取引するときに有利に利用できる売買高の圧力の極値も示します。このインジケーターには、フィボナッチに基づく可能なターゲットも表示されます。 このインジケーターは、PUSH 通知を含むあらゆるタイプのアラートを提供します。 購入後ご連絡下さい。私の取引のヒントをあなたと共有し、素晴らしいボーナスインジケーターを無料で提供します! 幸せで有益な取引をお祈りします。
ECM Elite Channel is a volatility-based indicator, developed with a specific time algorithm, which consists of finding possible corrections in the market. This indicator shows two outer lines, an inner line (retracement line) and an arrow sign, where the channel theory is to help identify overbought and oversold conditions in the market. The market price will generally fall between the boundaries of the channel. If prices touch or move outside the channel, it's a trading opportunity. The ind
この製品は 2026 年の市場向けに更新され、最新の MT5 ビルドに最適化されています。 価格更新のお知らせ: Smart Trend Trading System は現在 $99 で提供されています。 次の 30 件の購入 後、価格は $199 に上がります。 特別オファー: Smart Trend Trading System を購入後、私にプライベートメッセージを送ることで、 Smart Universal EA を無料 で受け取り、Smart Trend のシグナルを自動売買に変えることができます。 Smart Trend Trading System は、リペイントなし、再描画なし、遅延なしの完全なトレーディングシステムです。よりクリーンなシグナル、より明確なトレンド方向、そしてより整理された取引方法を求めるトレーダー向けに作られています。 Online course , manual and [download presets] . このシステムは、トレンド検出、反転ゾーン、Smart Cloud、トレーリングストップロジック、サポートとレジスタンス、ローソク足の色分け
FX Power: 通貨の強弱を分析して、より賢い取引を実現 概要 FX Power は主要通貨と金の実際の強弱をあらゆる市場状況で理解するための必須ツールです。強い通貨を買い、弱い通貨を売ることで、 FX Power は取引の意思決定を簡素化し、高い確率の取引機会を見出します。トレンドを追従する場合でも、極端なデルタ値を使用して反転を予測する場合でも、このツールはあなたの取引スタイルに完全に適応します。ただ取引するだけではなく、 FX Power で賢く取引をしましょう。 1. なぜ FX Power がトレーダーにとって非常に有益なのか 通貨と金のリアルタイム強弱分析 • FX Power は主要通貨と金の相対的な強弱を計算し、マーケットダイナミクスに関する明確な洞察を提供します。 • どの資産がリードしているか、または後れを取っているかを監視して、取引するペアを賢く選びましょう。 マルチタイムフレームの包括的なビュー • 短期、中期、長期のタイムフレームで通貨と金の強弱を追跡し、マーケットトレンドに基づいて取引戦略を調整できます。 • スキャルピングからスイングトレード
Scalper Vault は、スキャルピングを成功させるために必要なすべてを提供するプロフェッショナルなスキャルピング システムです。このインジケーターは、外国為替およびバイナリー オプションのトレーダーが使用できる完全な取引システムです。推奨される時間枠は M5 です。 システムは、トレンドの方向に正確な矢印シグナルを提供します。また、トップとボトムのシグナルとギャン マーケット レベルも提供します。 インジケーターは、プッシュ通知を含むすべてのタイプのアラートを提供します。 インジケータの購入後にご連絡ください。私の個人的な取引の推奨事項と素晴らしいボーナス指標を無料で共有します! 幸せで有益な取引をお祈りします!
BUY 1 and GET 1 FREE - Promotion! Buy Trend Reader Indicator with a huge –60% discount and GET 1 FREE EA by your choice! Promo Price: $117 (Regular Price: $297 — You Save $180! Don't Miss!) After purchase contact me to get your GIFT EA! You can also contact me to get the list of available GIFT EAs! Trend Reader Indicator is a revolutionary trading indicator designed to empower forex traders with the tools they need to make informed trading decisions. This cutting-edge indicator utilizes compl
Volatility Trend System - a trading system that gives signals for entries. The volatility system gives linear and point signals in the direction of the trend, as well as signals to exit it, without redrawing and delays. The trend indicator monitors the direction of the medium-term trend, shows the direction and its change. The signal indicator is based on changes in volatility and shows market entries. The indicator is equipped with several types of alerts. Can be applied to various trading ins
ボリューム ブレイク オシレーターは、オシレーターの形で価格変動とボリューム トレンドを一致させるインジケーターです。 私はボリューム分析を戦略に統合したいと思っていましたが、OBV、マネー フロー インデックス、A/D、ボリューム加重 Macd など、ほとんどのボリューム インジケーターにいつもがっかりしていました。 そのため、このインジケーターを自分で作成し、その有用性に満足したので、市場に公開することにしました。 主な機能: ボリュームの増加 (ブレイク) によってサポートされる方向に価格が動くフェーズを強調します。 ボリュームの増加が止まり、市場が縮小するフェーズを強調します。 特に時間枠 (<=15 分) のデイトレードでは、価格もボリュームも動かないため、市場が将来の動きに備えられるフェーズを強調します。 ボリュームの増加によってサポートされていない場合、他のエキスパート アドバイザーからの誤ったシグナルをフィルターします。 トレンドとレンジ フェーズを非常に簡単に視覚化できます 入力パラメーター: 計算設定: 計算タイプ: FAST、NORMAL、SLOW。同じ
この製品は 2026 年の市場向けに更新され、最新の MT5 ビルドに最適化されています。 価格更新のお知らせ: Atomic Analyst は現在 $99 で提供されています。 次の 30 件の購入 後、価格は $199 に上がります。 特別オファー: Atomic Analyst を購入後、私にプライベートメッセージを送ることで、 Smart Universal EA を無料 で受け取り、Atomic Analyst のシグナルを自動売買に変えることができます。 Atomic Analyst は、リペイントなし、再描画なし、遅延なしの Price Action トレーディングインジケーターで、手動取引、シグナルの明確化、EA 自動化のために設計されています。 User manual: settings, inputs and strategy.     &   User Manual PDF . 価格行動、強さ、モメンタム、マルチタイムフレーム方向、高度なフィルターを分析し、トレーダーがノイズを減らし、弱いセットアップを避け、より構造化された取引判断を行えるようにします。 こ
Color Trend FX は現在のトレンド方向を表示し、エントリーポイント、trailing レベル、そして想定される決済ポイントをチャート上に直接示します。エントリー地点を確認し、決済のヒントを得て、過去のパフォーマンスを検証したいトレーダー向けの指標です。単独のツールとしても、ご自身のシステムの一部としても、Expert Advisors のベースとしても使えます。 この指標はシグナルを色付きのドットで表示します。ドットはトレンドに追随し、保有ポジションの trailing レベルとしても機能します。値動きが弱まり、価格が極値から戻し始めると、決済 / エグジットを促すシグナルが現れます。 ご購入後は、私に直接ご連絡ください。トレードでの活用方法や、ご自身のトレードシステムや Expert Advisors への正しい接続方法について、詳しくお伝えします。 主な機能 トレンドのドットが価格に追随し、保有ポジションの trailing レベルとして機能します。 値動きが弱まり、価格が極値から戻したときに決済シグナルが現れます。 リペイントしません。シグナルは確定した足の上に現れ、
Linear Trend Predictor ー - エントリ ポイントと方向サポート ラインを組み合わせたトレンド インジケーター。高値/安値チャネルを突破するという原理に基づいて機能します。 インジケーターのアルゴリズムは市場のノイズをフィルタリングし、ボラティリティと市場の動向を考慮します。 インジケーターの機能  平滑化手法を使用して、市場のトレンドと、買い注文または売り注文を開くためのエントリー ポイントを表示します。  任意の時間枠のチャートを分析して、短期および長期の市場の動きを判断するのに適しています。  あらゆる市場や時間枠に適応可能な入力パラメータにより、トレーダーはインジケーターを独自にカスタマイズできます。  設定されたインジケーター信号は消えず、再描画もされません。ローソク足の終値で決定されます。  いくつかの種類の通知が矢印と組み合わされています。  このインジケーターは、独立した取引システムとして使用することも、他の取引システムへの追加として使用することもできます。  あらゆるレベルの経験を持つトレーダーが使用できます。 主なパラメータ Vol
Gold Channel is a volatility-based indicator, developed with a specific timing algorithm for the XAUUSD pair, which consists of finding possible corrections in the market. This indicator shows two outer lines, an inner line (retracement line) and an arrow sign, where the theory of the channel is to help identify overbought and oversold conditions in the market. The market price will generally fall between the boundaries of the channel. If prices touch or move outside the channel it is a tradi
作者のその他のプロダクト
GOLD SESSION LIQUIDITY MAP Gold Session Liquidity Map is a multi-market MT4 indicator for session structure, liquidity, breakout probability, Fibonacci mapping and multi-timeframe momentum. Originally developed around Gold/XAUUSD, it can also be used on Forex, Oil, indices and cryptocurrencies. Calculations use the current chart symbol and timeframe. The indicator is built around three questions: LOCATION - Where is price relative to session structure? DIRECTION - Which side currently has st
Gold Phase Detector Gold Phase Detector is a MetaTrader 4 indicator designed to display RSI momentum, moving average alignment, and market phase conditions in a visual format. The indicator uses RSI, an RSI moving average, and a 5/13 moving average structure to help traders observe whether market conditions are trending, correcting, weakening, or transitioning. Gold Phase Detector is intended for chart analysis. It does not open, close, or manage trades. Main Features RSI phase coloring RSI 50 l
Gold Wick Support Resistance Map is a professional MT4 wick-reaction mapping indicator designed to help traders read hidden price reaction areas created by candle wicks, liquidity sweeps, rejection points, breakout zones, and market structure. Most support and resistance tools focus on simple highs, lows, or candle-body levels. This indicator takes a different approach. It focuses on wick structures, because wicks often show where price tested liquidity, reacted strongly, rejected, or completed
Wick & Liquidity Zones Tracker – Advanced Gold & Forex Cluster Indicator “See Where Big Players Move — Trade Gold & Forex Like an Insider!” Liquidity Zones instantly reveals hidden liquidity clusters, swing reversals, and breakout points, giving you the edge most traders only dream of. Key Features  Liquidity Zone Detection: Automatically identifies unbalanced bullish & bearish candles , marking zones where price is likely to reverse or accelerate. Cluster Analysis: Groups consecutive candles
Gold Weekly High Trap Zones Weekly High Trap Zones   is a clean MT4 weekly range-mapping indicator designed to help traders identify the key trap zone created around the current week’s high. The indicator finds the current weekly high, identifies the session range connected to that high, and then projects a structured trap-zone ladder from that range. It displays the important weekly high origin level, trap zone top and bottom, 100 level, 161.8 target, 261.8 target, and optional higher extensio
SmartADR v2.80 SmartADR v2.80   is an advanced Average Daily Range mapping indicator for MetaTrader 4. It is designed to help traders build a clear intraday range map using the Daily Open, ADR high/low projections, Fibonacci reaction levels, ADR zones, and previous unbroken ADR targets. Instead of showing only a simple ADR high and ADR low, SmartADR creates a full visual structure around the market open. This allows traders to see where price may expand, pause, reject, pull back, or complete it
GC Regime Divergence Panel GC Regime Divergence Panel   is a compact multi-timeframe market condition dashboard for MT4. It is designed to help traders quickly read trend regime, pullback conditions, and RSI divergence across multiple timeframes without switching charts. The indicator displays a clean on-chart panel showing each timeframe, the current market regime, and any detected RSI divergence. It combines moving average structure, MA gap behavior, RSI pressure, RSI 34SMA comparison, and s
RSI 34 Last Range Tracker RSI 34 Last Range Tracker   is a visual range-tracking indicator for MT4 that helps traders identify the most recent RSI momentum shift and project the important reaction zone from that candle. The indicator tracks crosses between RSI and its 34-period RSI moving average. When a bullish or bearish RSI cross occurs, the indicator marks the cross candle with a dot and draws the related price range, including the candle high, candle low, and the important 38.2 / 61.8 mi
GC Volume Profile GC Volume Profile   is a professional MT4 volume profile indicator designed to help traders see where market activity is concentrated, where buyers and sellers are positioned, and where important volume-based reaction zones may exist. The indicator builds a horizontal tick-volume profile directly on the chart using either a fixed lookback range or the visible chart area. It separates bullish and bearish volume, highlights important volume nodes, shows the Point of Control, di
Daily Weekly Monthly Open Map Daily Weekly Monthly Open Map   is a clean price-level mapping indicator for MT4 that helps traders track important open-price levels across the daily, weekly, and monthly market structure. If you purchase this indicator i will give you a free 40 minute zoom session one to one on how to use this. Many markets repeatedly react around previous daily, weekly, and monthly open prices. These levels can act as support, resistance, liquidity targets, unfinished-business a
MTF Phase Engine Mini Dashboard MTF Phase Engine Mini Dashboard   is a compact multi-timeframe market condition panel designed for traders who want to read trend phase, RSI pressure, moving average structure, and momentum strength quickly across multiple timeframes. Instead of loading several indicators or switching between charts, this dashboard displays the key condition data for M1, M5, M15, M30, H1, H4, D1, W1, and MN in one clean on-chart panel. The indicator combines 5/13 moving average
Daily Open Mirror Engine — Wick & Body Mirror Levels for MT4 Daily Open Mirror Engine   is a professional MetaTrader 4 indicator designed to project mirrored price levels from the current daily open. Many intraday moves react strongly around the daily open. This indicator uses the daily open as the central reference point and automatically projects mirrored levels from important wick and body extremes, helping traders identify possible reaction zones, liquidity targets, support, resistance, an
Gold Zones Liquidity Wick Zones Liquidity   is a visual support and resistance zone indicator designed to help traders identify important reaction areas created from swing highs, swing lows, wick zones, and liquidity candle clusters. Instead of drawing random horizontal levels, the indicator studies the most important visible swing high and swing low on your chart using ZigZag structure. From those swing points, it automatically builds clean 38.2 and 61.8 liquidity zones that can act as reacti
Swing Volume Phase Swing Volume Phase   is a visual market-structure and volume-pressure indicator designed to help traders quickly understand who is controlling the current move:   buyers or sellers . Instead of looking at candles alone, this tool focuses on the volume behind important swing highs, swing lows, and completed price legs. It helps identify whether the current market phase is being supported by stronger buying pressure, stronger selling pressure, or a possible shift in control. T

MA Gap Tracker Engine — Multi-Timeframe 5/13 SMMA Distance & Trend Panel for MT4 MA Gap Tracker Engine   is a professional MetaTrader 4 indicator designed to track the live relationship between price, the 5 SMMA, and the 13 SMMA across multiple timeframes. This tool helps traders quickly see whether price is above or below the moving averages, whether the 5/13 MA structure is bullish or bearish, and most importantly, whether the moving average gap is   expanding, shrinking, or flat . Instead of
Monday Asia Weekly Fib Engine — Weekly Session Projection Levels for MT4 Monday Asia Weekly Fib Engine   is a MetaTrader 4 indicator designed to project key weekly Fibonacci levels from the   Monday Asia trading session range . If you purchase this indicator i will give you a free 40 minute zoom session one to one on how to use this. Many weekly moves begin with a clear liquidity range during the early Asia session. This indicator automatically identifies that Monday Asia range and projects F
This dashboard shows you what is happening on all timeframes at the sametime. State - tells you what state that timeframe is currently in. R34 - tells you how many candles have closed above or below the 34sma G5 - tells you how far the price is from the 5sma moving average G13 - tells you how far the price is from the 13sma moving average RD - this tells you how far RSI is from the 34sma 34v50 - this tells you how far the 34sma is from 50 Gap - this tells you the current gap between the 5sma a
GapZone Pro – Dynamic Gap Trading Engine for MT4 The Gap That Evolves with the Market Most gap indicators detect a gap once, draw a box, and never change it again. GapZone Pro is different. Its proprietary Dynamic Gap Engine continuously recalculates the active market gap as price evolves. As the size of the gap expands or contracts, every Fibonacci level, retracement zone, and distance calculation updates automatically in real time. Instead of trading yesterday's gap, you're trading the marke
Gold Session Trap Distance Map Gold Session Trap Distance Map is a clean intraday liquidity-mapping indicator designed for XAUUSD traders who want to track where price still has unfinished business from major trading sessions. Instead of filling the chart with random support and resistance, this indicator focuses on one simple idea: unbroken session trap zones can act like future liquidity magnets. The indicator tracks key session trap areas from the major trading periods and displays live dista
Gold Fuel  is a professional MT4 chart-mapping indicator designed for traders who study price-leg movement, candle structure, reaction zones, and 161.8 completion targets. The indicator uses a selected market leg as the active structure, then automatically projects the working direction and displays the relevant zone and target map. It shows only the active directional zone, helping keep the chart clean and focused. When the selected leg projects downward, the indicator displays the active sell
Gold Swing Break Target Map is a MetaTrader 4 indicator designed to display projected target levels after a confirmed swing high or swing low is broken. The indicator is intended to help traders answer a common chart question: If price breaks this swing high, where could it continue upward? If price breaks this swing low, where could it continue downward? The tool does not open, close, or manage trades. It is designed for chart analysis and discretionary trading decisions. Main Purpose Gold Swin
Stop switching between charts just to understand the moving-average structure. CrossMap MTF MA Zones brings every important crossover, gap, age, and origin zone onto one chart. CrossMap MTF MA Zones is a clean, fully adjustable multi-timeframe moving-average indicator designed to show where each crossover began, how mature it is, and whether the distance between the averages is expanding or shrinking. The indicator can monitor every standard timeframe from M1 to MN1 while displaying only the ti
フィルタ:
レビューなし
レビューに返信