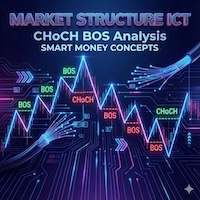
Smart Structure Zones ict
- インディケータ
-
Astik Jaura
 Hi, my name is Astik Jaura, but you can call me AJ.
I have been studying and trading the Forex market for over four years. For the past year, I have focused on developing automated trading systems and Expert Advisors for MetaTrader 5. I currently have three algorithms running profitably. - バージョン: 1.2
- アクティベーション: 5
Smart Structure Zones ICT is a MetaTrader 5 chart indicator for structure-based price analysis. It displays market structure, BOS, CHoCH, order block zones, fair value gaps, equal highs and lows, premium/discount areas, and higher-timeframe highs and lows directly on the chart.
The indicator is made for traders who use price action, structure analysis, liquidity zones, order blocks, fair value gaps, and multi-timeframe levels as part of their chart study.
Main Features
Market Structure
The indicator detects and displays important structure events, including:
- BOS — Break of Structure
- CHoCH — Change of Character
- Bullish structure breaks
- Bearish structure breaks
- Internal structure
- Swing structure
Users can choose to show all structure signals, only BOS, or only CHoCH. Bullish and bearish structure colors can be adjusted separately.
Internal Structure
Internal structure helps display shorter-term movement inside the larger price structure.
Features include:
- Show or hide internal structure
- Bullish and bearish structure filters
- Custom structure colors
- Confluence filter
- Adjustable label size
Swing Structure
Swing structure shows larger market movement and major structure changes.
Features include:
- Show or hide swing structure
- Bullish and bearish BOS/CHoCH detection
- Adjustable swing length
- Optional swing point labels
- HH, HL, LH, LL marking
- Strong high and weak high marking
- Strong low and weak low marking
Order Block Zones
The indicator can draw bullish and bearish order block zones on the chart.
Features include:
- Internal order blocks
- Swing order blocks
- Bullish order block zones
- Bearish order block zones
- Adjustable number of recent zones displayed
- ATR or cumulative mean range filter
- Automatic removal of broken zones
- Optional popup alerts for order block breakouts
Equal Highs and Equal Lows
The indicator can mark equal highs and equal lows as possible liquidity areas.
Features include:
- EQH — Equal Highs
- EQL — Equal Lows
- Adjustable bars confirmation
- Adjustable threshold
- Custom label size
Fair Value Gaps
The indicator detects bullish and bearish fair value gaps and displays them as chart zones.
Features include:
- Bullish fair value gaps
- Bearish fair value gaps
- Auto threshold option
- Custom FVG colors
- Adjustable FVG extension
- Maximum visible FVG zones setting
- Maximum stored FVG zones setting
Premium, Discount, and Equilibrium Zones
The indicator can draw premium, discount, and equilibrium areas based on the active swing range.
Features include:
- Premium zone
- Discount zone
- Equilibrium zone
- Custom zone colors
Multi-Timeframe Highs and Lows
The indicator can display previous highs and lows from higher timeframes.
Supported levels include:
- Previous Daily High and Low
- Previous Weekly High and Low
- Previous Monthly High and Low
Each level has customizable color and line style.
Candle Coloring
Optional candle coloring can be enabled based on internal trend direction.
Features include:
- Bullish candle color
- Bearish candle color
- Colored style
- Monochrome style
Alerts
Popup alerts can be enabled for order block breakout events.
Performance Settings
The indicator includes performance options for smoother chart loading.
Performance options include:
- Update only after candle closes
- Limit maximum bars calculated
- Limit maximum FVG zones drawn
- Limit maximum FVG zones stored in memory
These options help reduce chart object load and improve performance on lower timeframes or charts with large history.
Important Note
Smart Structure Zones ICT is a chart analysis indicator only. It does not open, close, or manage trades. Use it together with your own analysis, risk management, and trading rules.