Fib Smc Pro

🦉 OWL Fibonacci SMC Elite v2.0

 **The most intelligent Fibonacci tool on the MQL5 marketplace.**  

 Automatic swing detection · OTE zone · Smart Money Order Blocks · FVG alignment · Confluence scoring 0–100% · Non-repainting arrows · Professional dark dashboard


⚡ WHY OWL FIBONACCI SMC ELITE IS DIFFERENT?

Every other Fibonacci indicator draws lines and leaves you to figure out which levels matter.

**OWL Fibonacci SMC Elite v2.0 tells you EXACTLY which levels to trade — and scores each one from 0 to 100%.**

It combines two frameworks that institutional traders use together — Fibonacci retracement/extension and Smart Money Concepts (ICT methodology) — into a single, automated engine. Every Fibonacci level is validated against real Order Blocks and Fair Value Gaps before being scored. Only levels with institutional backing receive high scores. Only the highest-scoring setups produce a signal arrow.

The result: fewer signals, much higher quality. Exactly how professional desks operate.


 🏦 THE FOUR ANALYTICAL PILLARS

 1. AUTO SWING DETECTION ENGINE

OWL automatically identifies the most recent significant swing high and swing low on your chart — no manual drawing required. Up to 3 swing pairs are detected simultaneously, with the most recent (and relevant) swing always displayed prominently.


The swing direction (Bullish or Bearish) determines how Fibonacci levels are drawn:

- **Bullish swing** (impulse UP): Fibonacci retracements draw downward from swing high — showing pullback zones to buy

- **Bearish swing** (impulse DOWN): Fibonacci retracements draw upward from swing low — showing pullback zones to sell


2. OTE ZONE — OPTIMAL TRADE ENTRY

The OTE Zone (0.618 to 0.705 Fibonacci range) is automatically highlighted as a filled zone on your chart. This is the exact zone Michael Huddleston (ICT) identified as the highest-probability entry area — where institutions place their orders during pullbacks.

The dashboard shows live OTE status:

- Price above OTE → Awaiting entry

- **Price IN OTE ZONE → Optimal entry area active**

- Price below OTE → Move passed


3. SMC CONFLUENCE ENGINE — ORDER BLOCKS + FAIR VALUE GAPS

This is what separates OWL from every other Fibonacci indicator:

**Order Block Detection**: Automatically finds the last bullish or bearish candle before a major breakout move — the exact zone where institutional buy/sell orders were placed. Displayed as semi-transparent boxes on the chart.

**Fair Value Gap Detection**: Automatically identifies 3-candle price gaps (imbalances) that price is magnetically attracted to fill. Displayed as lighter transparent boxes on the chart.


**Alignment Scoring**: When a Fibonacci level falls INSIDE an Order Block or FVG, the confluence score for that level increases dramatically. This is the institutional confirmation that the level is real — not just a mathematical coincidence.


4. CONFLUENCE SCORING SYSTEM (0–100%)

Every Fibonacci level receives an individual score calculated from multiple factors:


| Factor | Score Bonus |

|--------|------------|

| Base (any level) | +10% |

| Key level (0.500, 0.618, 0.705, 1.618) | +20% |

| OTE zone (0.618 or 0.705) | +20% |

| Aligns with active Order Block | +30% |

| Aligns with active Fair Value Gap | +20% |

| Both OB AND FVG alignment | +10% bonus |

| OTE + OB or FVG alignment | +10% bonus |

| **Maximum score** | **100%** |


Levels scoring 80%+ are highlighted in gold. Levels scoring 60–79% are highlighted in amber. Low-score levels remain dimmed.


📊 PROFESSIONAL DARK DASHBOARD


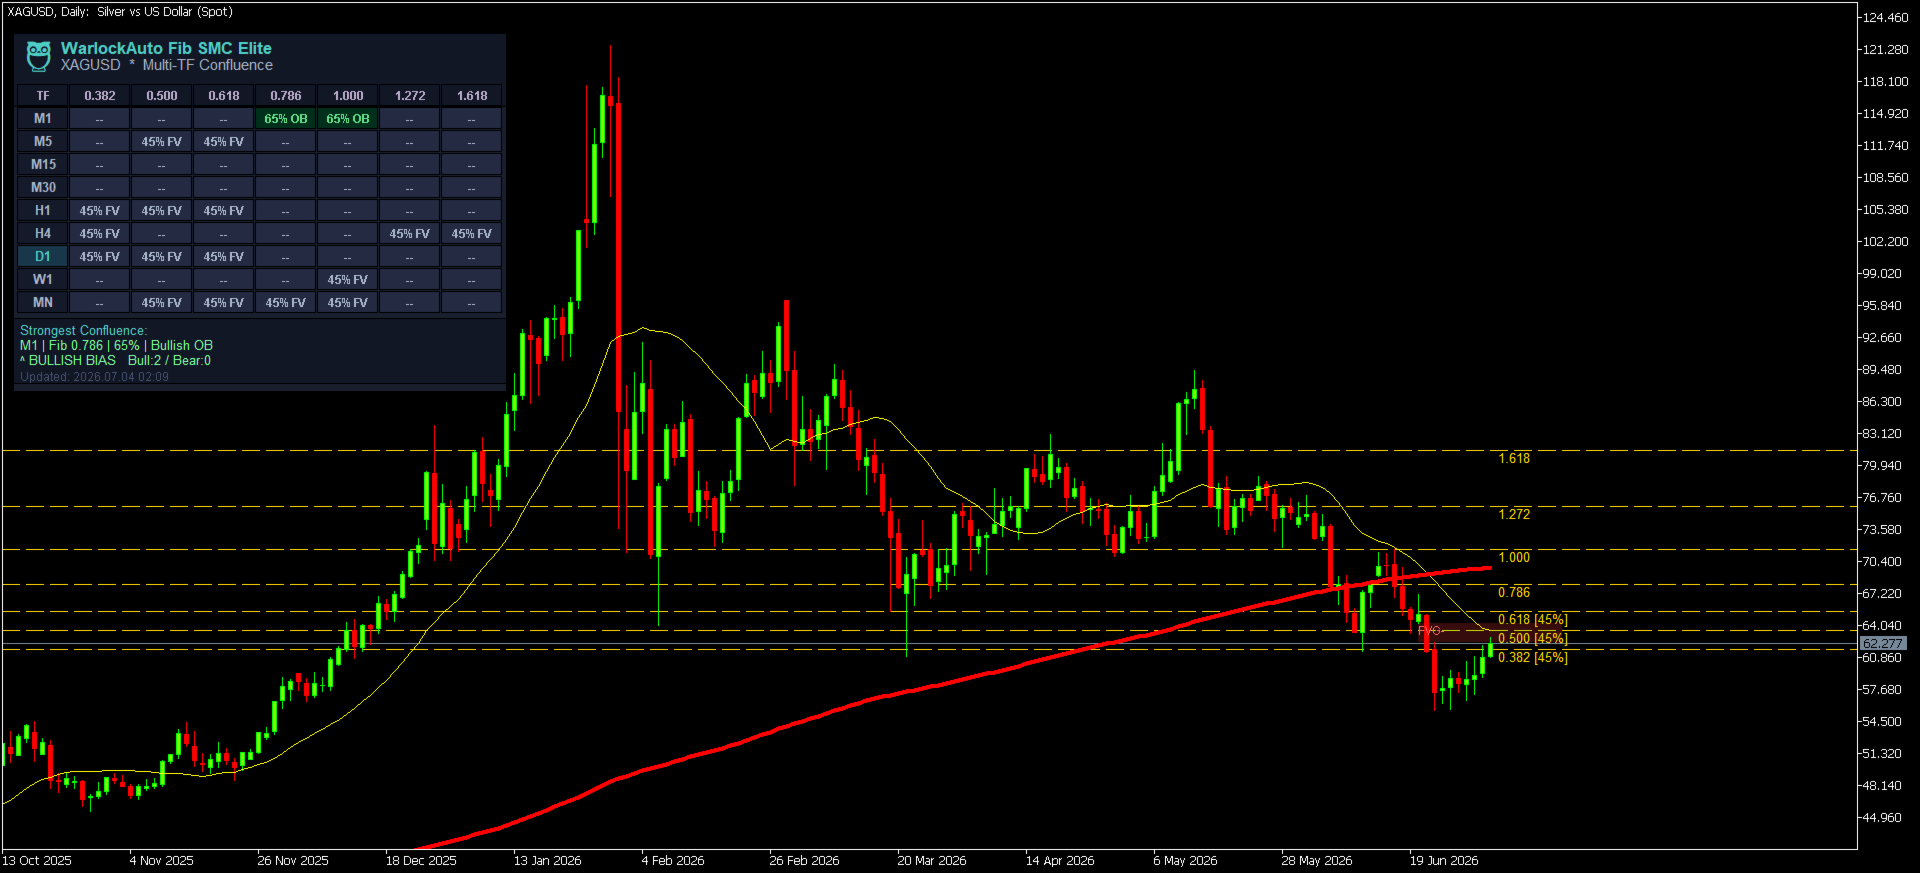
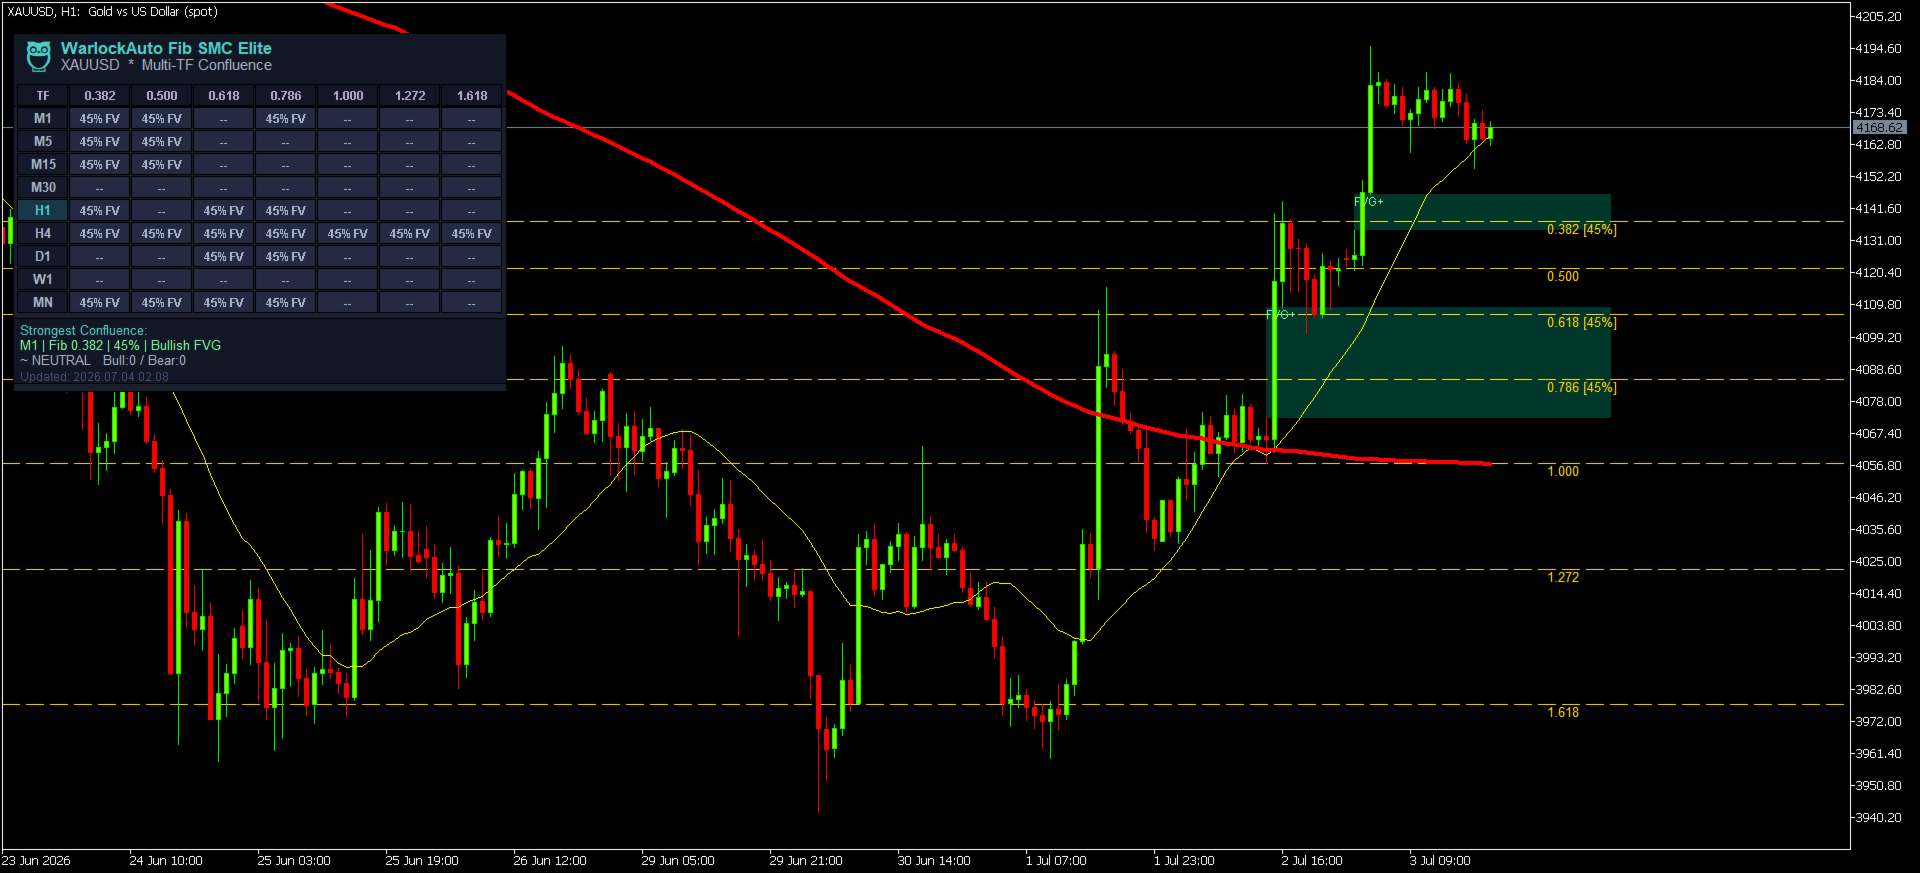
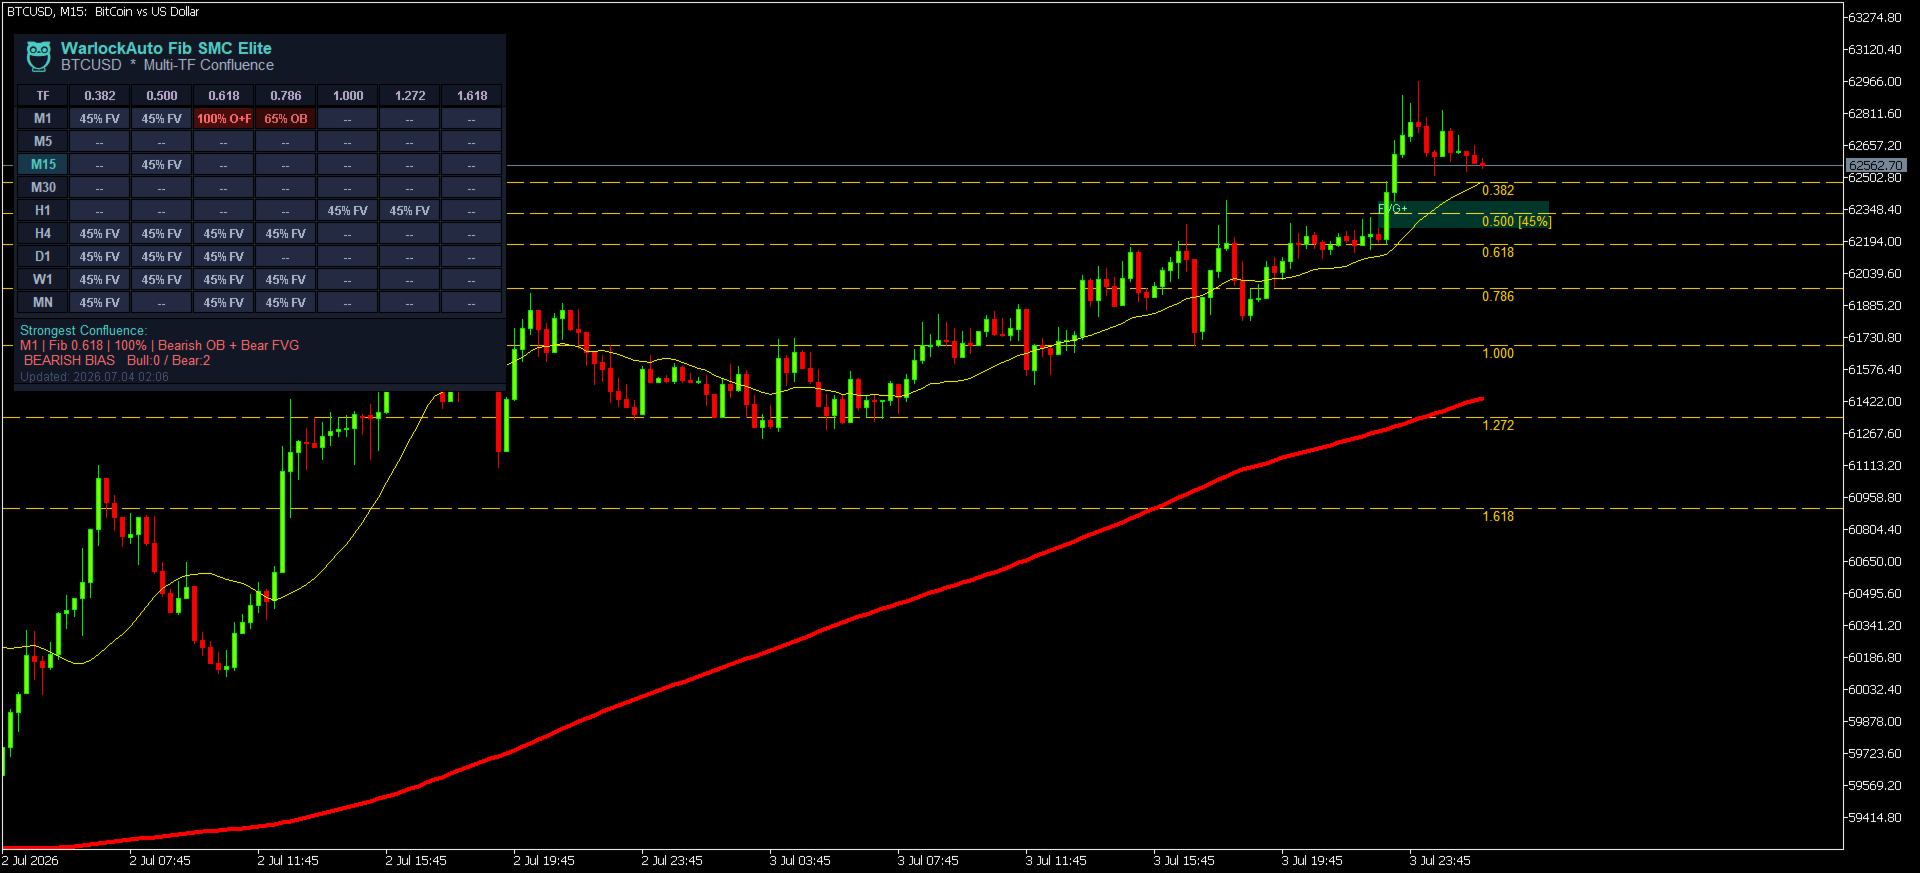
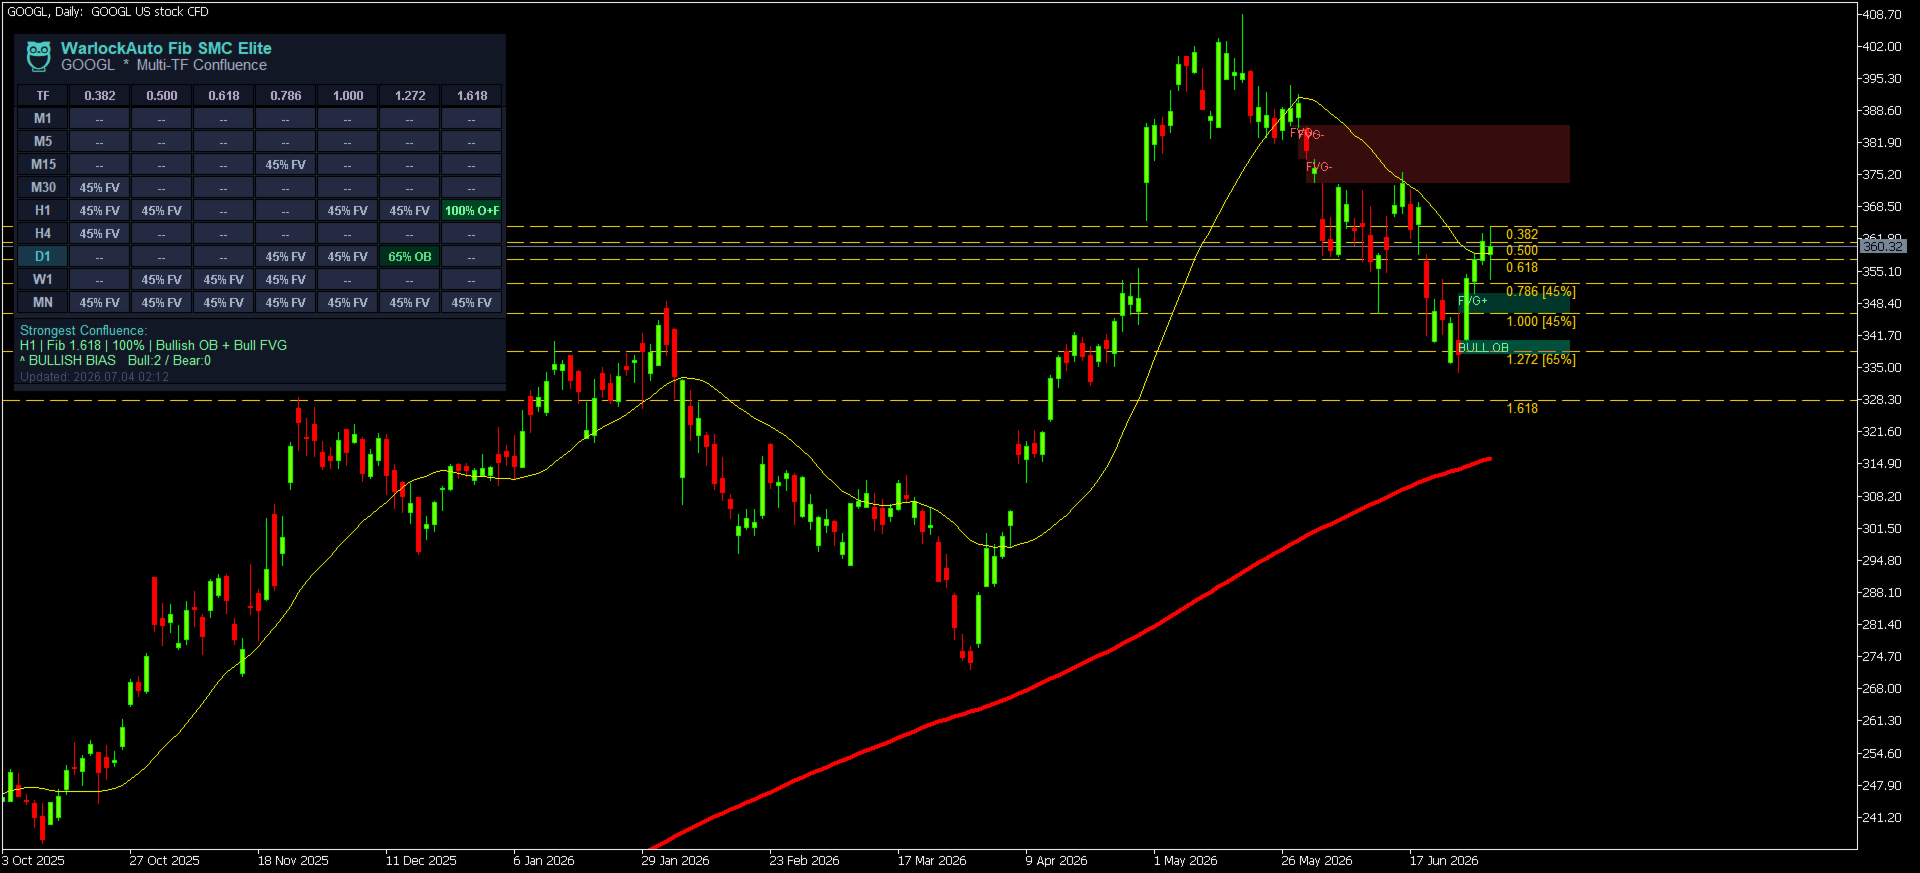
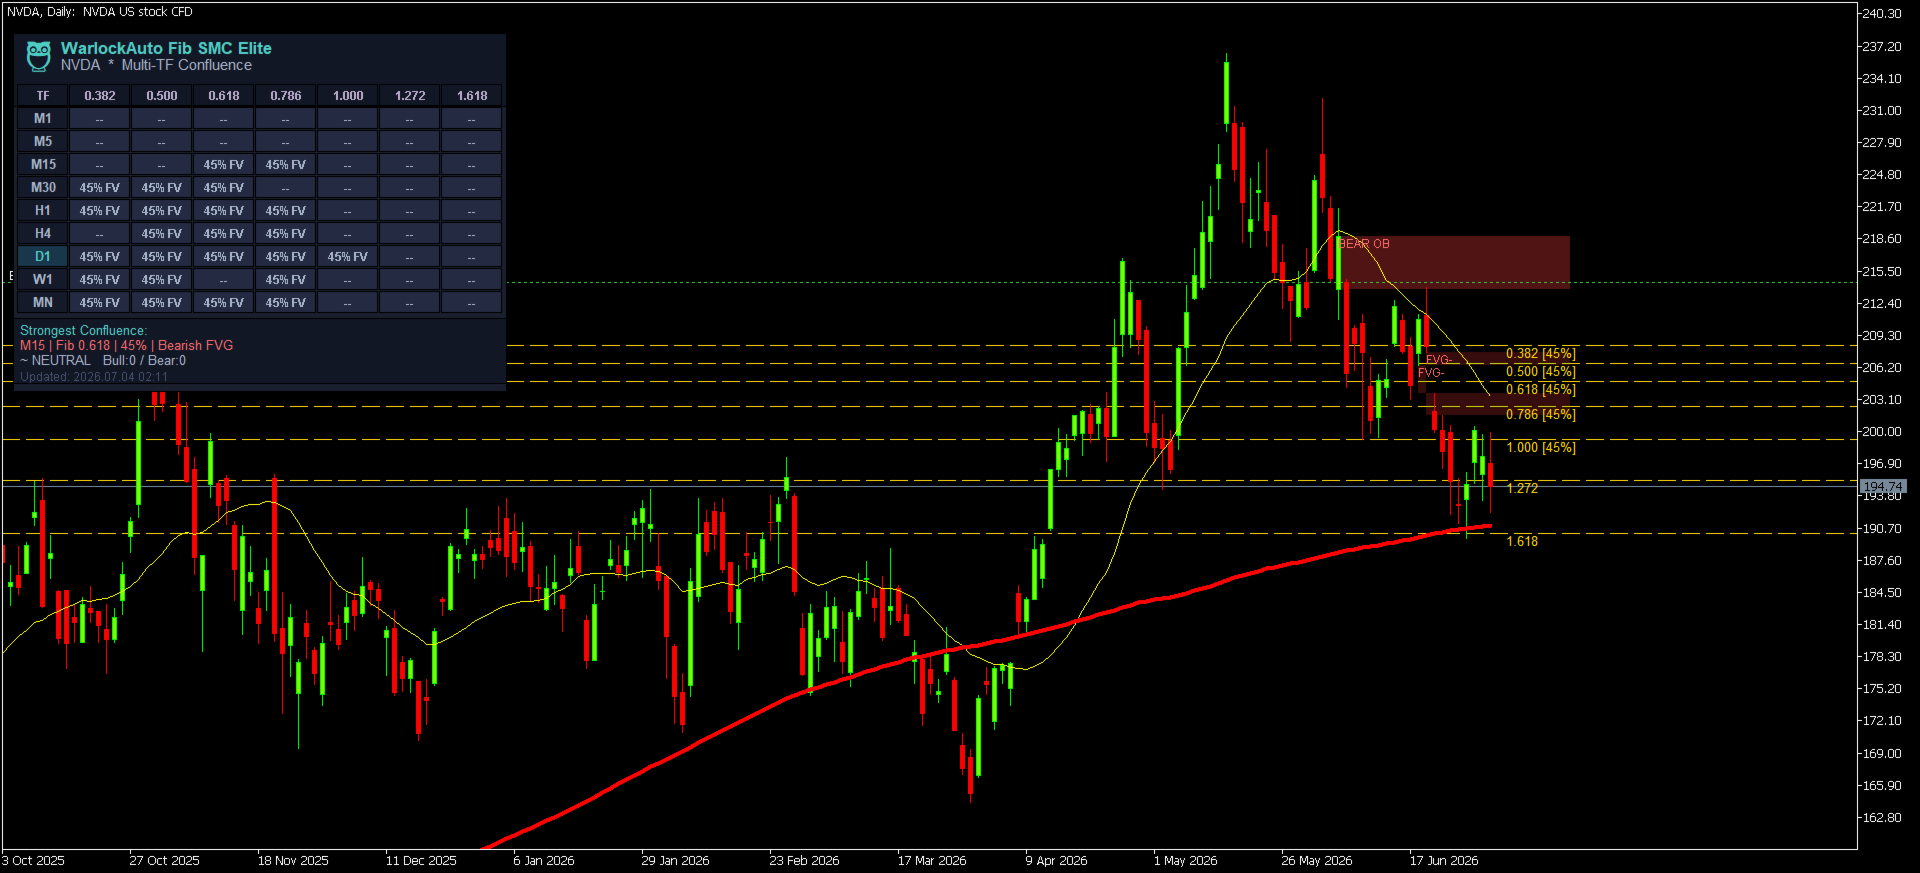
The 🦉 branded dark panel gives you a complete institutional briefing at a glance, organized into five sections:


 🔲 SWING ANALYSIS

- Direction: **▲ BULLISH** or **▼ BEARISH** (colour-coded live)

- Swing High / Low prices

- Range in points and price units


 🔲 MARKET POSITION

- **Live price** updated every tick

- Status: Above High / Below Low / **IN OTE ZONE** / Shallow / Mid / Deep Retrace

- Retracement % from swing (0% = at high, 100% = at low for bullish)


 🔲 SMC CONFLUENCE

- Active Order Blocks and Fair Value Gaps count

- **Signal**: ▲ BUY XX% / ▼ SELL XX% / WATCH XX% / SCAN XX%


 🔲 FIBONACCI LEVEL TABLE

8-row live table showing for each active level:

- **RATIO**: 0.236 through 2.618 — colour-coded by type

- **PRICE**: Exact level price — highlighted in green when price is near

- **DIST**: Distance from current price in points (+ = above, - = below)

- **SCORE**: Confluence score 0–100% — green/amber/dim based on quality


 🔲 FOOTER

- Last update timestamp

- Swing count + top score summary


 🎯 BUY/SELL SIGNAL ARROWS


Signal arrows appear on the chart **only when three conditions are met simultaneously**:


1. Price is within the OTE zone (0.618–0.705 with tolerance)

2. The OTE zone score meets your minimum threshold (default 60%)

3. The current bar has opened


**Zero Repaint Guarantee**: Arrows are placed using the bar open price — a value that is fixed the moment the bar opens and **never changes**. Only one arrow is visible at any time. Historical arrows clear on each new bar so you always see the current setup only.


Arrow colours:

- **🟢 Green ▲** = BUY signal (bullish swing, price in OTE, institutional confirmation)

- **🔴 Red ▼** = SELL signal (bearish swing, price in OTE, institutional confirmation)


 ⚙️ COMPLETE INPUT PARAMETER GUIDE


 MAIN SETTINGS

| Parameter | Default | Range | Description |

|-----------|---------|-------|-------------|

| **InpSwingLB** | 20 | 5–100 | Bars each side to confirm a swing. Higher = fewer but stronger swings. Lower = more swings, more noise. |

| **InpMaxSwings** | 2 | 1–3 | How many swing pairs to display simultaneously. 1 = cleanest, 3 = full historical context |

| **InpOBLookback** | 60 | 10–200 | How many bars to scan for Order Blocks and FVGs. Match to your trading timeframe. |

| **InpMinScore** | 60 | 0–100 | Minimum confluence score required to show a signal arrow. 60 = balanced, 75 = selective, 85 = only elite |


 RETRACEMENT LEVELS

Toggle any Fibonacci retracement level on or off. **0.618** and **0.705** are the OTE levels and are recommended always-on. **0.382** and **0.500** are key institutional reference levels.


 EXTENSION LEVELS

Toggle extension levels (>1.000). **1.272** and **1.618** are the most respected institutional targets. Enable **InpShowExt** to show all extensions.


 VISUAL SETTINGS

| Parameter | Description |

|-----------|-------------|

| **InpShowOTE** | Show/hide the OTE zone fill (highly recommended ON) |

| **InpShowOBs** | Show/hide Order Block boxes on chart |

| **InpShowFVGs** | Show/hide Fair Value Gap boxes |

| **InpShowLabels** | Show price labels and score tags on each Fib line |

| **InpShowArrows** | Show/hide signal arrows |

| **InpColBull/Bear** | Customize bullish and bearish Fib line colours |

| **InpColOTE** | OTE zone fill colour (default: institutional purple) |

| **InpLineW** | Line thickness 1–3 |


 DASHBOARD

| Parameter | Default | Description |

|-----------|---------|-------------|

| **InpShowDash** | true | Show/hide dashboard panel |

| **InpDashX** | 23 | Horizontal position from left edge |

| **InpDashY** | 33 | Vertical position from top edge |


 ALERTS

| Parameter | Description |

|-----------|-------------|

| **InpAlertArrow** | Popup alert when a BUY or SELL arrow fires |

| **InpAlertOTE** | Alert when price enters the OTE zone (max every 5 minutes) |

| **InpAlertPush** | Send push notifications to MetaTrader mobile app |


 📱 HOW TO USE — STEP BY STEP


 STEP 1: INITIAL CONFIGURATION

The default settings are calibrated for **H1 and H4 timeframes** on major pairs (EURUSD, GBPUSD, XAUUSD, BTCUSD). For other setups, adjust:


**For scalping (M1–M5):**

- InpSwingLB = 8–12

- InpOBLookback = 30

- InpMinScore = 55


**For day trading (M15–H1):**

- InpSwingLB = 15–25 *(default)*

- InpOBLookback = 50–80 *(default)*

- InpMinScore = 60 *(default)*


**For swing trading (H4–Daily):**

- InpSwingLB = 30–50

- InpOBLookback = 100–150

- InpMinScore = 70


 STEP 2: READING THE CHART


**What you see on the chart:**

- **Purple filled zone**: OTE zone (0.618–0.705) — your primary entry area

- **Green semi-transparent boxes**: Bullish Order Blocks (institutional buy zones)

- **Red semi-transparent boxes**: Bearish Order Blocks (institutional sell zones)

- **Blue semi-transparent boxes**: Bullish Fair Value Gaps (price magnets)

- **Dark pink boxes**: Bearish Fair Value Gaps

- **Horizontal lines**: Fibonacci levels, colour-coded by type and score

- **H / L labels**: Swing high and swing low anchor points

- **▲ ▼ Arrows**: Entry signals at high-confluence OTE levels


STEP 3: READING THE DASHBOARD


Open the dashboard and go through it top to bottom:


1. **Swing Analysis**: Confirm the direction. If it shows ▲ BULLISH, you're looking for BUY setups. If ▼ BEARISH, you're looking for SELL setups.


2. **Market Position**: Watch the Status row. When it shows **▶ IN OTE ZONE**, price has entered your primary entry area. The Retrace % tells you exactly where in the swing you are.


3. **SMC Confluence**: Check the Signal row. **▲ BUY XX%** means an arrow has fired with that confluence score. **WATCH XX%** means conditions are approaching but not met. **SCAN XX%** means no qualified setup.


4. **Fibonacci Table**: Find levels scoring 70%+ (shown in green). These are your highest-probability price zones. Levels shown in gold (80%+) have both OB and FVG alignment — the strongest setups.


STEP 4: EXECUTING A TRADE


**BUY SETUP CHECKLIST:**

- [ ] Dashboard shows ▲ BULLISH direction

- [ ] Price is IN OTE ZONE (Status row, 0.618–0.705 retrace range)

- [ ] One or more Fibonacci levels score 65%+ in the table

- [ ] A green OB box is near the OTE zone

- [ ] A green ▲ arrow has appeared on the chart

- [ ] RSI or Stochastic is oversold (optional confluence from your other indicators)


**Execution**: Place a limit BUY order at or near the 0.618 Fibonacci level. Your Stop Loss goes below the swing low (0 line). Take profits at swing high (1.000 line), 1.272, and 1.618 for extensions.


**SELL SETUP CHECKLIST:**

- [ ] Dashboard shows ▼ BEARISH direction

- [ ] Price is IN OTE ZONE (0.618–0.705 retrace measured from low UP)

- [ ] One or more Fibonacci levels score 65%+ in the table

- [ ] A red OB box is near the OTE zone

- [ ] A red ▼ arrow has appeared on the chart


**Execution**: Place a limit SELL order at or near the 0.618 Fibonacci level. Stop Loss goes above swing high. Take profits at swing low (1.000), 1.272, and 1.618 extensions.


STEP 5: RISK MANAGEMENT

- **Maximum risk per trade**: 1–2% of account capital

- **Recommended R:R**: Minimum 1:2 (TP1) to 1:4 (TP3 at 1.618)

- **Position sizing**: Calculate based on distance from entry to swing low/high SL

- **Best session**: London open (08:00–12:00 UTC) and London/NY overlap (13:00–17:00 UTC) for highest institutional participation


💡 PROFESSIONAL TIPS


 Tip 1: The Confluence Stack

The highest probability trades occur when you have ALL FOUR factors aligned:

- ✅ Price in OTE zone (0.618–0.705)

- ✅ Order Block in OTE area (OB box overlaps OTE zone)

- ✅ Fair Value Gap pointing to the same level

- ✅ Swing direction matches higher timeframe trend


When all four align, score reaches 90%+ and the trade is institutional-grade.


Tip 2: Multi-Timeframe Confirmation

Use OWL on two timeframes simultaneously:

- **Higher TF (H4/Daily)**: Identify the primary swing direction and OTE zone

- **Lower TF (M15/H1)**: Time your entry precisely when the score fires


 Tip 3: Score as a Filter, Not a Signal

Don't treat the arrow as a "click and trade" signal. Use the score as a quality filter:

- Score 80–100%: Highest conviction. Can enter at market when OTE reached.

- Score 65–79%: Good setup. Wait for a confirming candle close inside OTE.

- Score 50–64%: Moderate. Reduce position size or skip.

- Score < 50%: Avoid. Not enough institutional backing.


 Tip 4: Order Block Quality

Fresh (unmitigated) OBs are far more powerful than tested ones. If an OB box is near your entry AND it has never been retested since its formation, the probability of a reaction increases significantly.


 Tip 5: Fair Value Gap as Target

When entering a BUY at a bullish OTE level, check if there's a Bearish FVG above the entry — this is often your first take-profit target, since price seeks to fill the imbalance.


 Tip 6: Session Timing

The OTE setups work best during:

- **London Open (08:00–10:00 UTC)**: New York institutional hours begin

- **London/NY Overlap (13:00–17:00 UTC)**: Maximum liquidity, sharpest moves

- Avoid OTE entries during Asian session (00:00–07:00 UTC) — lower participation


 🔧 TECHNICAL SPECIFICATIONS:


| Specification | Details |

|--------------|---------|

| **Platform** | MetaTrader 5 |

| **Build** | 3000+ |

| **Indicator Type** | Chart window (overlaid on price) |

| **Arrow Buffers** | 2 (Buy + Sell) |

| **Repaint** | ❌ Zero repaint — arrows set at bar open price |

| **Arrows on chart** | Maximum 1 at any time |

| **DLL required** | ❌ No |

| **External files** | ❌ No |

| **Strategy Tester** | ✅ Fully compatible |

| **Works on** | All symbols (Forex, Gold, Indices, Crypto, Stocks) |

| **Works on** | All timeframes M1 through Monthly |

| **Dashboard** | Dark professional panel, 333px wide |

| **Dashboard update** | Live price every tick |

| **Signal update** | Once per bar (new-bar gate) |

| **CPU load** | Minimal — heavy analysis runs once per bar only |


❓ FREQUENTLY ASKED QUESTIONS


**Q: Does OWL work on cryptocurrency and gold?**  

A: Yes. OWL works on any symbol available in your MetaTrader 5 broker — Forex pairs, XAUUSD (Gold), BTCUSD, indices (US30, NAS100, SP500), stocks, and commodities. The Fibonacci and SMC methodology is universal.


**Q: Why are there no arrows even though price is near the OTE zone?**  

A: The OTE score may be below your InpMinScore threshold. Check the dashboard → Fibonacci Table for the score of the 0.618 and 0.705 rows. If the score is low, no OB or FVG is aligned with those levels. Lower InpMinScore to 45–50 to see arrows in lower-confluence environments, or wait for the OB/FVG alignment to form naturally.


**Q: How many swings should I display at once?**  

A: Start with InpMaxSwings = 1 for a clean chart, focusing on the most recent swing only. Use 2 swings to see if older structure confirms the current setup. Use 3 only for historical analysis.


**Q: The swing detection picks a very small swing. How do I fix this?**  

A: Increase InpSwingLB (e.g., from 20 to 35). A higher lookback requires more bars on each side to qualify as a swing, filtering out minor fluctuations and keeping only major structural swings.


**Q: Is this indicator repainting?**  

A: No. Arrows are placed using `open[0]` — the price at which the current bar opened, which is permanently fixed and never changes. The `ArrayInitialize` call on each new bar clears old arrows to keep exactly one visible at all times, but the current bar's signal, once placed, uses a fixed price.


**Q: Can I use OWL with my Expert Advisor?**  

A: Yes. Read Buffer 0 (BUY signal) and Buffer 1 (SELL signal) using `iCustom()`. A non-EMPTY_VALUE at index 0 indicates an active signal.


**Q: What's the difference between an Order Block and an FVG in OWL?**  

A: An **Order Block** is the specific candle before a major move — the zone where institutions placed large orders. An **FVG** (Fair Value Gap) is a price gap left between three candles that price hasn't returned to fill. Both are institutional footprints. When a Fibonacci level aligns with BOTH, it's the highest-conviction setup available.


 🔄 VERSION HISTORY


**v2.0 (Current) — Complete Rewrite**

- ✅ Fixed: `Wipe()` was O(n²) — replaced with `ObjectsDeleteAll()`

- ✅ Fixed: Dashboard rebuilt every bar — now Create/Update pattern (OnInit only)

- ✅ Fixed: Swing direction logic mismatch between comment and code

- ✅ Fixed: `posRatio` division-by-zero guard on zero range

- ✅ Fixed: Alert throttle now per-symbol (not per-level, preventing spam)

- ✅ Fixed: Chart and dashboard object namespaces now fully separated

- ✅ Fixed: Fib level table rows previously shared `g_oc` counter with chart objects

- ✅ New: SMC Order Block detection (volume-weighted, most-recent-first)

- ✅ New: Fair Value Gap detection and chart visualization

- ✅ New: Confluence scoring 0–100% per Fibonacci level

- ✅ New: Non-repainting arrows placed at bar open price

- ✅ New: Single arrow only — `ArrayInitialize` clears history on each bar

- ✅ New: Score-coloured Fibonacci lines (gold = 80%+, amber = 60–79%)

- ✅ New: Live price update every tick in dashboard

- ✅ New: OTE active status in dashboard


**v1.0 (Original)**

- Basic auto swing detection

- Retracement and extension levels

- OTE zone fill

- Dashboard with swing info and Fib table


---


## ⚠️ RISK DISCLAIMER


Trading financial instruments carries substantial risk of loss. OWL Fibonacci SMC Elite is a technical analysis tool designed to assist experienced traders in identifying high-probability setups using Fibonacci and ICT/Smart Money Concepts methodology. It does not guarantee profits. Past performance does not guarantee future results.


Always use proper risk management:

- Never risk more than 1–2% of capital per trade

- Always use a Stop Loss placed beyond the swing structure

- Test on a demo account before using on a live account

- OWL is a decision-support tool, not a fully automated trading system


---


*© 2026 OWL Trading Systems. All rights reserved. OWL Fibonacci SMC Elite v2.0 is built exclusively for MetaTrader 5 and distributed through the MQL5 Marketplace.

おすすめのプロダクト
Arcane Fibonacci Indicator v2.0  **The most intelligent Fibonacci tool on the MQL5 marketplace.**    Automatic swing detection · OTE zone · Smart Money Order Blocks · FVG alignment · Confluence scoring 0–100% · Non-repainting arrows · Professional dark dashboard WHY Arcane Fibonacci Indicator v2.0 IS DIFFERENT? Every other Fibonacci indicator draws lines and leaves you to figure out which levels matter. ** Arcane Fibonacci Indicator v2.0 tells you EXACTLY which levels to trade — and scores
指定した時間枠の高値と安値に基づいて、自動的にフィボナッチレベルをプロットします 複数のバー   を結合できます:例えば、10日間の高値と安値に基づいてフィボナッチを取得できます 私の   #1   ツール : 66以上の機能、このインジケーターを含む  |   ご質問はこちら  まで  |    MT4版 潜在的な反転レベルを確認するのに役立ちます; フィボナッチレベルで形成されるパターンはより強力になる傾向があります; 手動で   プロットする   時間を   大幅に   削減 ; 設定: 基準となる高値と安値を計算する時間枠 基準価格を計算する期間の数 現在(フローティング)のバーを含める/除外する 各レベルはカスタマイズ可能、または無効化可能(0に設定でオフ) レベルグループ全体を無効にすることも可能:メイン、上方拡張、下方拡張を個別に ラインの色、スタイル、太さ  レベルの価格を有効/無効にできます
Harmonic Trader V4 Premium Professional Harmonic Pattern Trading System for MetaTrader 5 Overview Harmonic Trader V4 Premium is a fully automated trading system designed to identify and trade high-quality harmonic reversal structures. The robot continuously scans the market and evaluates pattern quality before opening any position. Unlike many pattern-based systems, Harmonic Trader does not trade every detected structure. Additional confirmation and filtering layers are applied before any order
インジケーター技術仕様 – Delta Profile for MetaTrader 5 Delta Profile は MetaTrader 5 用に開発されたインジケーターで、指定されたローソク足範囲内の出来高フローを詳細に分析するためのものです。異なる価格レベルにおける正の出来高(上昇に関連)と負の出来高(下降に関連)の不均衡を構造化し、可視化します。その結果、ユーザーは最も多くの取引が集中する価格帯や実際の市場不均衡が形成される領域を明確に把握できます。 以下に、本インジケーターの主要な技術特性と設定パラメータを示します。 基本コンセプト インジケーターは 価格レベル を識別し、それらを正の出来高、負の出来高、および純 Delta(正負の出来高差)に分類します。 各価格レベルは 水平バー としてチャートに表示され、市場の活動ゾーンや不均衡領域を視覚的に確認できます。 ユーザーは 分析対象ローソク足数 、 価格の丸め精度 、 最大表示レベル数 、および 表示スタイル を自由に設定できます。 主要機能 価格レベルのマッピング :設定された精度に基づき価格を丸め、対応するローソク足の
Fibonacci Sessions インジケーターは、精密なスキャルピングと日中取引戦略のために設計された強力なトレーディングツールです。  ニューヨーク、ロンドン、アジアの各セッションの主要なフィボナッチレベルを自動的にプロットし、トレーダーに主要市場セッションにおける価格変動の明確なビューを提供します。  各セッションでは、価格が最も反応するユニークな「ゴールデンゾーン」が強調表示されます。  これにより、反転、ブレイクアウト、継続パターンのための非常に信頼性の高いゾーンが作成されます。  インジケーターは、価格がどのように一つのゴールデンゾーンから別のゴールデンゾーンへと頻繁に移動するかを視覚的に示し、トレーダーが安定したチャンスを捉えるのに役立ちます。  XAUUSDのM5タイムフレームに最適化されており、他の通貨ペアや世界の指数でも優れたパフォーマンスを発揮します。  ゴールド、通貨ペア、または株価指数を取引する場合でも、このセッションベースのフィボナッチマッピングは、高確率の取引ゾーンを特定する上で追加の優位性を提供します。  赤い線: 極限利益ターゲットレベル。  黄色
FREE
Fibonacci Advanced Indicator – Precision Meets Intelligence The Fibonacci Advanced Indicator is a cutting-edge technical analysis tool designed for traders who demand more than conventional retracement levels. Built on the foundational principles of Fibonacci mathematics, this indicator transcends tradition by integrating dynamic market behavior , multi-timeframe analysis , and adaptive algorithms to deliver high-probability trading zones with surgical accuracy. 1. Multiple Fibonacci Levels
Master Editionは、ボリュームとマネーフローの視点を通じて市場構造を可視化するために設計されたプロフェッショナルグレードの分析ツールです。標準のボリュームインジケーターとは異なり、このツールはチャート上に日足ボリュームプロファイルを直接表示し、価格発見がどこで行われたか、そして「スマートマネー」がどこに位置しているかを正確に確認できます。 このMaster Editionは、明確さとスピードを考慮して設計されており、ロード時にチャートレイアウトを即座に美化するユニークな自動テーマ同期システムを備えています。 主な機能: 真のマネーフロー計算: 標準のティックボリュームを超えます。「Use Money Flow」を有効にすると、ボリュームは価格によって重み付けされ、特定の価格レベルでの実際の資本コミットメントが明らかになります。 バリューエリア (VA) の可視化: バリューエリア(デフォルトではボリュームの70%)を自動的に計算します。 VA Fill: コントロールゾーンを即座に識別するために、バリューエリアの背景をシェーディングします。 主要レベル: コントロールポイン
Fibonacci Alert MT5は、トレーダーがリアルタイムで重要なFibonacciレベルを特定するのを助けるために設計された高度なトレーディングインジケーターです。価格がこれらの重要なレベルに近づいたり、突破したりしたときにタイムリーなアラートを提供することで、トレーダーが情報に基づいた意思決定を行い、トレーディング戦略を最適化できるようにします。 このインジケーターは、初心者と経験豊富なトレーダーの両方にとって有益であり、Fibonacciレベルの追跡という複雑な作業を簡素化し、取引機会を逃さないための重要な通知を提供します。 MQL製品のインストールガイド | MT5で購入したMQL製品の更新 | 一般的なトラブルシューティングガイド | インジケーター設定 / ガイド 主な機能 迅速かつバックテスト可能: MetaTraderのネイティブOnCalculate()エンジンに基づいて構築されており、高速な計算と戦略テスターとの完全な互換性を確保しています。 ポップアップアラート: シグナルイベントでMetaTraderアラートポップアップを発生させ、取引セットアップを見逃
FREE
Overview Harmonic Patterns MT5 is a technical analysis indicator designed for the MetaTrader 5 platform. It identifies and displays harmonic price patterns, such as Butterfly, Cypher, Crab, Bat, Shark, and Gartley, in both bullish and bearish directions. The indicator calculates key price levels, including entry, stop loss, and three take-profit levels, to assist traders in analyzing market movements. Visual elements and customizable alerts enhance usability on the chart. Features Detects six ha
Utility for show on charts the visual informations about: - a vertical line at start of each bar of selected timeframe - a vertical line at start of each day - a vertical line at start of each week - vertical lines at start / end of trading sessions selected - bid / ask prices, spread, money value for each point (of 1 standard lot) and last tick time recived" You can enable / disable each information and set the color for each line
FREE
SCALPER INDICATOR MT5 (IntraScalper)   IntraScalper Indicator Free Version is a simple and lightweight trading indicator designed for intraday traders who want clear visual signals and clean chart analysis.  This free version introduces traders to the core logic of the IntraScalper system using a single internal strategy. The indicator highlights potential buy and sell opportunities directly on the chart while keeping the interface simple and easy to read. It is ideal for traders who want quick
FREE
VIEW THE LIVE TRACKING SIGNAL HERE REGISTER AN ACCOUNT WITH THE BROKER HERE ACCESS THE OFFICIAL COPYTRADING INVESTMENT OFFER HERE Fx Vol 20 Titan -- Professional Expert Advisor for Weltrade (H1) Fx Vol 20 Titan is a high-precision automated algorithmic trading system designed exclusively for the Weltrade broker, natively optimized for the Fx Vol 20 synthetic index on the one-hour (H1) timeframe. The algorithm utilizes an advanced mathematical engine based on the recognition of volatility patte
Harmonic Pattern Structure Harmonic Pattern Structure is a professional MetaTrader 5 indicator that automatically detects classic harmonic patterns using strict Fibonacci ratio validation and XABCD price structure. Designed for traders who value precision, clean visuals, and structured analysis, the indicator highlights potential reversal zones based on price geometry, supporting consistent and objective decision-making. SUPPORTED HARMONIC PATTERNS Gartley (222) Butterfly Bat Crab Shark Cy
TRharmonic v21 — Harmonic Pattern Detector A professional MetaTrader 5 harmonic pattern indicator. Detects 29 classic and advanced pattern types in real time, automatically projects Entry, SL, TP1, TP2, and TP3 levels at every pattern commit, and locks active patterns at bar close (no repaint). Works with every broker and produces consistent signals across forex, metals, indices, crypto, and stocks. What It Does Detects 29 harmonic patterns in real time (Classic, Advanced, Anti, Swan, Exotic gro
This indicator is a   technical tool based on harmonic approximations   of solar and lunar cycles. It   does not use exact astronomical positions. This indicator uses   mathematical waves to approximate daily solar and monthly lunar cycles   for trading purposes. It captures general market rhythms influenced by day/night and moon phases, but it   does not track exact astronomical positions . Do your analysis and study on back test before purchase.  The   Advanced Astrological Indicator   is a m
MetaTrader 5 向けスマート多層ブレイクアウト&プルバック検出器 「スマート・シンプル・ファスト!」 高確率のブレイクアウトエントリーを見逃すことにうんざりしていませんか? 複数のチャートを何時間もスキャンし、ブレイクアウトをトレンド方向と通貨のモメンタムに合わせようとして、それでも動きを逃してしまうことはありませんか? Break Pullback は、1つのインジケーターでそのすべてを解決します。 Break Pullback とは何ですか? Break Pullback は、マーケットストラクチャー、ブレイクアウト、トレンド継続のセットアップを取引するトレーダー向けに特別に設計されたプロフェッショナルグレードの MetaTrader 5 インジケーターです。 リアルタイムで複数の通貨ペアにわたるブレイクとプルバックの形成を自動的に検出し、3層の確認を通じてすべてのシグナルをフィルタリングします: ストラクチャラルブレイクアウト検出 — チャート上の主要なブレイクレベルを特定 HTF 日足バイアス — エントリーを支配的な日足トレンド方向に合わせる 通貨強弱指数 —
Professional Opening Range Breakout (ORB) indicator designed for precision session trading with automatic time handling, breakout alerts, and advanced target levels. This indicator automatically identifies the Opening Range for any configurable session, plots the High, Low, and Midpoint levels, and extends them across the trading day. Built-in breakout detection and alerts, range measurements, and extension targets provide traders with clear structure and actionable levels. Ideal for traders usi
VibeFox Gartley — Fibonacci で検証されたエントリーポイントを備えたハーモニック XABCD パターン VibeFox Gartley は MetaTrader 5 向けのリアルタイムなハーモニックパターンインジケーターです。価格のスイング構造をスキャンし、古典的な Gartley XABCD パターンを見つけ、Fibonacci 比率で検証し、パターン完成時のエントリーポイントを価格チャート上に直接マークします。すべての操作は一つのモダンでインタラクティブなパネルにまとめられているため、レッグを手で測る代わりに、ハーモニックパターンとトレードアイデアが形成されるその瞬間に確認できます。 インジケーターの仕組み インジケーターは3つの段階で動作します。まず相場のスイング骨格を構築し、次にその骨格から有効な Gartley パターンを探し、最後に完成点 D に買いまたは売りのマーカーを配置します。 1. スイングピボット(ZigZag) 組み込みの ZigZag エンジンが小さな価格ノイズを除去し、意味のある転換点だけ — スイング高値(ピーク)とスイング安値(
これはほぼ間違いなく、MetaTraderプラットフォームで見つけることができる最も完全な調和価格形成自動認識インジケーターです。 19種類のパターンを検出し、フィボナッチプロジェクションをあなたと同じように真剣に受け止め、潜在的逆転ゾーン(PRZ)を表示し、適切なストップロスとテイクプロフィットレベルを見つけます。 [ インストールガイド | 更新ガイド | トラブルシューティング | よくある質問 | すべての製品 ] 19の異なる調和価格形成を検出します プライマリ、派生および補完フィボナッチ投影(PRZ)をプロットします 過去の価格行動を評価し、過去のすべてのパターンを表示します この指標は、独自の品質とパフォーマンスを分析します 適切なストップロスとテイクプロフィットのレベルを表示します ブレイクアウトを使用して適切な取引を通知します すべてのパターン比をグラフにプロットします 電子メール/音声/視覚アラートを実装します スコット・M・カーニーの本に着想を得て、この指標は最も純粋で急を要するトレーダーのニーズを満たすように設計されています。ただし、トレードを容易にする
Noize Absorption Index - is the manual trading system that measures the difference of pressure between bears forces and bulls forces. Green line - is a noize free index that showing curent situation. Zero value of index shows totally choppy/flat market.Values above zero level shows how powerfull bullish wave is and values below zero measures bearish forces.Up arrow appears on bearish market when it's ready to reverse, dn arrow appears on weak bullish market, as a result of reverse expectation.
Multi-Timeframe Heiken Ashi (Smoothed with Dashboard) Professional Market Structure Visualization with Weighted Confluence Scoring Transform your trading with crystal-clear multi-timeframe analysis. This indicator combines smoothed Heiken Ashi candles with an intelligent weighted scoring system to give you unprecedented clarity in any market condition. YOUR TRADING QUESTIONS – ANSWERED INSTANTLY: 1. What's the REAL trend direction? Dashboard Reveals:   Higher timeframe (MN1, W1, D1, H4) trend a
Phantom Edge SMC — The Ultimate Smart Money Indicator for MT5 Tired of manually drawing structures while trading SMC or ICT concepts? Let Phantom Edge SMC do the heavy lifting for you. Key Features Internal & Swing Structure: Automatically detects BOS and CHoCH across two structural levels. Order Blocks (OB): Identifies Internal and Swing OBs with automated mitigation tracking. Equal Highs / Lows: Highlights EQH / EQL to pinpoint Liquidity pools. Fair Value Gaps (FVG): Displays FVGs with
Zone Structure Scanner Panel for MT5 Find better setups faster — without scanning charts for hours. The Zone Structure Scanner Panel for MT5 helps you automatically scan multiple symbols, detect key weekly and daily support/resistance zones, read market structure, highlight confluence, and flag H4 rejection-confirmed setups from one powerful panel. Instead of jumping from chart to chart, you get ranked opportunities in one place so you can focus on the setups that matter most. Why it stands
Your Trend Friend
Luigi Nunes Labigalini
5 (1)
The trend is your friend! Look at the color of the indicator and trade on that direction. It does not  repaint. After each candle is closed, that's the color of the trend. You can focus on shorter faster trends or major trends, just test what's most suitable for the symbol and timeframe you trade. Simply change the "Length" parameter and the indicator will automatically adapt. You can also change the color, thickness and style of the lines. Download and give it a try! There are big movements w
CosmiCLab SMC FIBO CosmiCLab SMC FIBO is a professional trading indicator designed for traders who use Smart Money Concepts (SMC), market structure analysis and Fibonacci retracement levels. The indicator automatically detects market swings and builds Fibonacci levels based on the latest impulse movement. It also identifies market structure changes such as BOS (Break of Structure) and CHOCH (Change of Character), helping traders understand the current market direction. CosmiCLab SMC FIBO also pr
Fibo Box Santai — Indicator Description What is this indicator? A custom MetaTrader 5 (MQL5) indicator that combines three main features in one tool: a colored ZigZag , automatic Fibonacci levels , and candle coloring based on trend direction. Main Features 1. Color ZigZag Draws a classic ZigZag line connecting swing high and swing low points. The line turns blue when price moves up (toward a peak) and red when moving down (toward a bottom).  2. Automatic Fibonacci Levels Each time a new confirm
CompraOuro
Iz Zozz-os-iz Movamcetaz Z
Indicador "Precision Entry Timer" - O Relógio do Timing Perfeito Este indicador revoluciona sua estratégia de trading ao identificar o   momento exato para entrar em uma operação , combinando análise técnica e temporização de mercado. Ele utiliza um algoritmo avançado que cruza dados de: Volume Real   (fluxo de ordens institucionais) Padrões de Candles   (sequências de alta/procura com confirmação) Convergência de Médias   (EMAs rápidas e lentas em alinhamento) Fuso Horário de Liquidez   (períod
CRT Candle Range Theory HTF MT5.   Ultimate CRT Indicator: Advanced ICT Concepts and Malaysian SnR Trading System Master the Market Maker's Footprints with the Most Advanced Candle Range Theory Indicator Discounted   Price $50  !!     Secure your lifetime access now before it switches to subscription-only ! Unlock the true power of Smart Money Concepts (SMC) and trade precisely like the institutions with the Ultimate CRT Indicator . Built exclusively for serious traders, this indicator automate
This system is very useful for trading because it solves several classic problems: 1. Objectivity & Precision Benefit: It eliminates the trader's personal bias. Every trader might draw a trendline slightly differently, but this indicator uses a precise mathematical logic (Fractals) to find the pivot points. The resulting lines are objective and consistent every time. 2. ️ Dynamic Updates Benefit: Your chart is always current. As soon as a new pivot is confirmed, the new trendline is drawn au
RRtoolbox - Professional Tools: Risk:Reward Trading Tool (SL/TP Horizontals + Pending orders + Diagonals), Alerts set on trend lines (for alerts on diagonal levels), SelfManagement (BE, partials...), close/cancelling by time, Statistics, Info and trading on chart. One-Click Trading with Visual Risk:Reward Management RRtoolbox is a comprehensive trading panel that combines one-click order execution,  statistics and  powerful visual Risk:Reward tools, alerts set with trendlines, on chart butt
このプロダクトを購入した人は以下も購入しています
SuperScalp Pro
Van Minh Nguyen
4.69 (29)
SuperScalp Pro – プロフェッショナル多層コンフルエンス・スキャルピングシステム SuperScalp Pro は、複数のコンフルエンスを組み合わせたプロフェッショナル向けスキャルピングシステムです。より高い確率のトレードチャンスを見つけられるよう設計されており、明確なエントリー確認、ATRに基づくStop LossとTake Profit、さらにXAUUSD、BTCUSD、主要なFX通貨ペアに対応した柔軟なシグナルフィルター機能を提供します。 完全なドキュメントは製品ブログにあります: [User Guide] SuperScalp Pro Auto Trader EA による自動売買が利用可能です: [Auto Trader] SuperScalp Pro は、Supertrend、VWAP、EMA、RSI、ADX、出来高分析、ボリンジャーバンド、MACDダイバージェンスを組み合わせ、低品質なトレードセットアップをフィルタリングし、偽のブレイクアウトシグナルを減らし、エントリー精度の向上を目指します。 XAUUSD、BTCUSD、および主要なForex通貨ペア向け
この製品は 2026 年の市場向けに更新され、最新の MT5 ビルドに最適化されています。 価格更新のお知らせ: Smart Trend Trading System は現在 $99 で提供されています。 次の 30 件の購入 後、価格は $199 に上がります。 特別オファー: Smart Trend Trading System を購入後、私にプライベートメッセージを送ることで、 Smart Universal EA を無料 で受け取り、Smart Trend のシグナルを自動売買に変えることができます。 Smart Trend Trading System は、リペイントなし、再描画なし、遅延なしの完全なトレーディングシステムです。よりクリーンなシグナル、より明確なトレンド方向、そしてより整理された取引方法を求めるトレーダー向けに作られています。 Online course , manual and [download presets] . このシステムは、トレンド検出、反転ゾーン、Smart Cloud、トレーリングストップロジック、サポートとレジスタンス、ローソク足の色分け
まず正直に言いましょう。 どんなインジケーターも、それ単体であなたを利益化させることはできません。もしそう言う人がいるなら、それは夢を売っているだけです。完璧な売買シグナル(矢印)を表示するインジケーターは、いくらでも“完璧に見せる”ことができます。正しい過去の区間を拡大して、勝ちトレードだけを切り取ればいいだけです。私たちはそれをしません。 SMC Intraday Formula はツールです。 市場構造を読み取り、最も高い確率の価格ゾーンを特定し、今この瞬間のスマートマネーの痕跡をシンプルな言葉で正確に示します。最終判断はあなたが行います。トレードを実行するのもあなたです。しかし今は「希望」ではなく「精度」でエントリーできます。 私たちはこのインジケーターを、ゴールド(XAUUSD)および主要FX通貨ペアで約3年間、日々のスキャルピングに使用してきました。M1、M5、M15、M30の主要ツールです。これは未来を予測しようとするのではなく、今まさに形成されている高確率セットアップを示し、その理由を説明します。 他のすべてのインジケーターと何が違うのか? ほとんどのトレーディングイ
Neuro Poseidon is a new indicator by Daria Rezueva. It combines precise trading signals with adaptive TP/SL levels - creating best possible trades as a result! Message me and get  Neuro Poseidon Assistant  as a gift to automize your trading process! What makes it stand out? 1. Proven profitability on all assets and timeframes 2. Only confirmed BUY and SELL signals present on the chart 3. Adaptive TP & SL levels generated by the software for each trade 4. Easy to understand - suitable for al
Trend Sniper X
Sarvarbek Abduvoxobov
5 (6)
Trend Sniper X は、MetaTrader 5 用のマルチタイムフレーム・トレンドフォロー・インジケーターです。トレーダーがトレンドの方向性と反転ポイントを明確かつ正確に特定できるよう支援します。 価格情報: 現在の価格はキャンペーン価格であり、今後のアップデートや新機能のリリースに伴い変更される可能性があります。 Code2Profit チャンネル マルチタイムフレーム分析で市場をマスターしよう! 技術仕様 プラットフォーム MetaTrader 5 インジケータータイプ マルチタイムフレーム・トレンドインジケーター 操作タイムフレーム あらゆるチャートタイムフレームに対応。個別に選択可能な上位タイムフレーム (M1–MN1) を搭載 主要銘柄 FX、ゴールド (XAUUSD)、およびその他のCFD 推奨口座 あらゆる口座タイプに対応 視覚化 色分けされたトレンドローソク足 (買い/売り/弱気/変化) + 買い/売り矢印 追加モジュール セッション市場ボックス (シドニー、東京、ロンドン、ニューヨーク) 主な機能 マルチタイムフレーム・トレンド分析: 上位タイムフレームの
Welcome to ENTRY IN THE ZONE AND SMC MULTI TIMEFRAME Entry In The Zone and SMC Multi Timeframe is a professional trading indicator built on Smart Money Concepts (SMC) , combining market structure analysis with a No Repaint BUY / SELL signal system in a single indicator. It helps traders understand market structure more clearly, identify key price zones, and focus on higher-quality trading opportunities. By combining Multi-Timeframe Analysis , Points of Interest (POIs) , and real-time signals, th
M1 Quantum を使用したライブトレードシグナル : シグナル (取引は 自動的に Quantum Trade Assistant によって実行され、この製品に 無料 で含まれています。) 価格プラン: 現在価格: $169 (早期購入者向けオファー) 次回予定価格: $189 予定小売価格: $299 開発者からのお知らせ: ご購入後、 最新の推奨設定ファイル(Set File) 、運用アドバイス、および他の M1 Quantum ユーザーと交流できる VIPサポートグループ への招待をご希望の場合は、お気軽にご連絡ください。 よくある質問 - 設定ファイル - インストールガイド M1 Quantum は、M1専用のプロフェッショナルトレーディングシステムであり、ストップロス、テイクプロフィット、スマートな資金管理を内蔵した、迅速かつ正確な取引シグナルを提供します。 M1 Quantum は、 連続勝利 に重点を置いて口座を素早く成長させるために設計されたプロフェッショナルな資金管理を備えています。 M1 Quantum インジケーター の主な特徴 M1時間足 およびすべ
伝説が帰ってきました:Entry Points Pro 10。 MQL5 Marketのトップ3に3年間入り続けた伝説的インジケーターの再始動です。 2つのバージョンで合計589件の高評価レビュー、毎日数千人のトレーダーが実際のトレードに使用し、デモのダウンロードは31,000件以上   MT4+MT5 。 私はこの5年間に寄せられたレビューをすべて読み、約束を並べる代わりに、その答えをバージョン10に組み込みました。1999年から相場に携わり、 誠実さ、自らの評判、そして顧客を大切にする 作者による製品です。 Entry Points Proのエントリーシグナルは、リペイント(再描画)を一切行いません。 そして今回初めて、これは作者の言葉ではなく検証可能な事実になりました。確定シグナルはローソク足の終値確定後にのみ表示され、自動テストで リペイントはゼロ と確認されています(EURUSD、XAUUSD、BTCUSDで2,486,568回の不変条件チェック、違反0件)。検証方法は公開されており、ストラテジーテスターでご自身で再現できます。 ご購入後は、必ずすぐにダイレクトメッセージでご
Gann Made Easy   は、ミスター・ギャンの理論を使用した取引の最良の原則に基づいた、プロフェッショナルで使いやすい外国為替取引システムです。 W・D・ガン。このインジケーターは、ストップロスとテイクプロフィットレベルを含む正確な買いと売りのシグナルを提供します。 PUSH通知を利用して外出先でも取引可能です。 ご購入後、取引方法の説明と優れた追加インジケーターを無料で入手するには、私にご連絡ください! おそらく、ギャンの取引手法についてはすでに何度も聞いたことがあるでしょう。通常、ギャンの理論は初心者のトレーダーだけでなく、すでにある程度の取引経験がある人にとっても非常に複雑なものです。なぜなら、ギャンの取引手法は理論的にはそれほど簡単に適用できるものではないからです。私はその知識を磨き、最良の原則を私の外国為替インジケーターに組み込むために数年を費やしました。 このインジケーターは非常に簡単に適用できます。必要なのは、それをチャートに添付し、簡単な取引推奨事項に従うだけです。このインジケーターは常に市場分析の仕事を行い、取引の機会を探します。適切なエントリーポイントを検
M1 SNIPER は使いやすいトレーディングインジケーターシステムです。M1時間足向けに設計された矢印インジケーターです。M1時間足でのスキャルピングのためのスタンドアロンシステムとして、また既存のトレーディングシステムの一部としても使用できます。このトレーディングシステムはM1時間足での取引に特化して設計されていますが、他の時間足でも使用できます。元々、この手法はXAUUSDとBTCUSDの取引用に設計しましたが、他の市場においても役立つと考えています。 インジケーターのシグナルは、トレンドの方向と逆方向に取引できます。インジケーターのシグナルを利用して両方向に取引するのに役立つ特別な取引テクニックをご紹介します。この手法は、特別な動的なサポートとレジスタンスの価格帯を利用することに基づいています。 ご購入後、M1 SNIPER矢印インジケーターをすぐにダウンロードできます。さらに、M1 SNIPERツールのすべてのユーザーに、以下のスクリーンショットに表示されているApollo Dynamic SRインジケーターを無料で提供しています。この2つのインジケーターを組み合わせることで
Power Candles V3 - 自己最適化型強弱インジケーター Power Candles V3は 、通貨や銘柄の強さを、適用されたすべてのチャート上で実行可能なトレードプランに変換します。単にローソク足を色分けするだけでなく、バックグラウンドでリアルタイムの自動最適化を実行し、目の前の銘柄に対して最適なストップロス、テイクプロフィット、およびシグナルの閾値を提示します。ワンクリックで実取引に適用でき、エントリーポイント、ストップロス、テイクプロフィットのラインが正確な価格位置にチャート上に表示され、方向性を示すアラートがリアルタイムで発動します。 このツールは、Stein Investmentsのエコシステムの一部です。  18種類以上のツールをすべて閲覧し、AIを活用したセットアップの推奨事項を入手し、  https://stein.investments でコミュニティに参加しましょう クローズしたバーごとに3,000回以上のトレードシミュレーション。9つの強さの状態。2つの戦略を並行してテスト。勝率の高い設定をワンクリックで適用。 なぜこれが必要なのか ほとんどの強
GoldenX Entryは、MT5向けのインジケーターであり、適応型Smart Entry Trendアルゴリズム、シグナルスコアリングシステム、マーケットレジーム検出機能、およびボラティリティフィルターを備えています。各シグナルには、計算されたエントリーレベル、3つのテイクプロフィット(TP1、TP2、TP3)、およびストップロスレベルが含まれます。本インジケーターは、異なる市場環境に適応するために設計された複数の分析レイヤー上に構築されており、マルチレイヤー分析システムと内蔵オプティマイザーおよび統計トラッキングシステムを組み合わせています。リスク・リワード(RR)指標および過去のトレード履歴に基づく定量分析を提供します。 使い始めは簡単です — 選択した時間足でオプティマイザーを実行し、そのままチャート上でインジケーターを使用します。 コア機能 GoldenX Entryは、シグナルエンジンとトレード管理機能、そして過去統計トラッキングを1つのチャートに統合しています: - 内蔵オプティマイザー: オプティマイザーはチャート上でワンクリックで実行できます。200通りのパラメー
このインジケーターを購入された方には、以下の特典を 無料 で提供しています: 各トレードを自動で管理し、ストップロスとテイクプロフィットを設定し、戦略ルールに基づいてポジションを決済する補助ツール 「Bomber Utility」 様々な銘柄に合わせたインジケーターの設定ファイル(セットファイル) 「最小リスク」、「バランスリスク」、「待機戦略」 の3つのモードで使用できる Bomber Utility 用の設定ファイル このトレーディング戦略をすぐに導入・設定・開始できる ステップバイステップのビデオマニュアル ご注意: 上記の特典を受け取るには、MQL5のプライベートメッセージシステムを通じて販売者にご連絡ください。 オリジナルのカスタムインジケーター 「Divergence Bomber(ダイバージェンス・ボンバー)」 をご紹介します。これは、MACDのダイバージェンス(乖離)戦略に基づいた 「オールインワン」型のトレーディングシステム です。 このテクニカルインジケーターの主な目的は、価格とMACDインジケーターの間に発生するダイバージェンスを検出 し、将来の価格の動きを示す
Crystal Heikin Ashi Signals - Professional Trend & Signal Detection Indicator Advanced Heikin Ashi Visualization with Intelligent Signal System for Manual & Automated Trading Final Price: $149 ---------> Price goes up $10 after every 10 sales . Limited slots available — act fast . Overview Crystal Heikin Ashi Signals is a professional-grade MetaTrader 5 indicator that combines pure Heikin Ashi candle visualization with an advanced momentum-shift detection system. Designed for both manual traders
ARIPoint
Temirlan Kdyrkhan
1 (1)
ARIPoint is a powerful trading companion designed to generate high-probability entry signals with dynamic TP/SL/DP levels based on volatility. Built-in performance tracking shows win/loss stats, PP1/PP2 hits, and success rates all updated live. Key Features: Buy/Sell signals with adaptive volatility bands Real-time TP/SL/DP levels based on ATR Built-in MA Filter with optional ATR/StdDev volatility Performance stats panel (Success, Profit/Loss, PP1/PP2) Alerts via popup, sound, push, or email Cu
通貨強さウィザードは、取引を成功させるためのオールインワン ソリューションを提供する非常に強力な指標です。このインジケーターは、複数の時間枠のすべての通貨のデータを使用して、このまたはその外国為替ペアのパワーを計算します。このデータは、使いやすい通貨インデックスと通貨パワーラインの形式で表され、特定の通貨のパワーを確認するために使用できます。 必要なのは、取引したいチャートにインジケーターを接続することだけです。インジケーターは、取引する通貨の実際の強さを示します。このインジケーターは、トレンドに合わせて取引するときに有利に利用できる売買高の圧力の極値も示します。このインジケーターには、フィボナッチに基づく可能なターゲットも表示されます。 このインジケーターは、PUSH 通知を含むあらゆるタイプのアラートを提供します。 購入後ご連絡下さい。私の取引のヒントをあなたと共有し、素晴らしいボーナスインジケーターを無料で提供します! 幸せで有益な取引をお祈りします。
この製品は 2026 年の市場向けに更新され、最新の MT5 ビルドに最適化されています。 価格更新のお知らせ: Atomic Analyst は現在 $99 で提供されています。 次の 30 件の購入 後、価格は $199 に上がります。 特別オファー: Atomic Analyst を購入後、私にプライベートメッセージを送ることで、 Smart Universal EA を無料 で受け取り、Atomic Analyst のシグナルを自動売買に変えることができます。 Atomic Analyst は、リペイントなし、再描画なし、遅延なしの Price Action トレーディングインジケーターで、手動取引、シグナルの明確化、EA 自動化のために設計されています。 User manual: settings, inputs and strategy.   &   User Manual PDF . 価格行動、強さ、モメンタム、マルチタイムフレーム方向、高度なフィルターを分析し、トレーダーがノイズを減らし、弱いセットアップを避け、より構造化された取引判断を行えるようにします。 このイ
Reversion King Indicator
Eugen-alexandru Zibileanu
5 (5)
新たな王者が登場 - インジケーター + 注文管理表示(TP1 + TP2 + TP3)+ オプションのTelegramシグナル送信機能付き(無料) (完全なトレード&シグナルシステム) ゴールド向け最高のEA: Gold Slayer このインジケーターには、高度な戦略、カスタマイズ可能な注文管理システム、そしてエンベロープ拡張を組み合わせた平均回帰システムが搭載されています。さらに、RSIなど複数のインテリジェントな確認フィルターによって、高確率の反転エントリーをBUY・SELLシグナルとして検出します。 単にトレードを学ぶだけでなく、複数ポジションを効果的に管理し、過去に利益を出しているオープンポジションで損失トレードをカバーする方法も学べます。 M5向けに構築・最適化されており、流動性が高くシグナルの精度が安定しているBTCUSDとXAUUSDで優れたパフォーマンスを発揮します。 このインジケーターは、ATRを基に自動計算されたエントリー、ストップロス、テイクプロフィットレベルを備えた明確なLong・Shortシグナルを提供するため、リスク管理が最初から組み込まれています。 マ
Quantum TrendPulse を ご紹介します。これは、   SuperTrend   、   RSI   、および Stochastic のパワーを 1 つの包括的なインジケーターに組み合わせて、取引の可能性を最大限に引き出す究極の取引ツールです。精度と効率を求めるトレーダー向けに設計されたこのインジケーターは、市場のトレンド、勢いの変化、最適なエントリー ポイントとエグジット ポイントを自信を持って特定するのに役立ちます。 主な特徴: SuperTrend 統合: 現在の市場動向に簡単に追従し、収益性の波に乗ることができます。 RSI精度: 買われすぎと売られすぎのレベルを検出し、市場の反転のタイミングに最適で、SuperTrendのフィルターとして使用されます。 確率的精度: 確率的振動を活用して、変動の激しい市場で隠れたチャンスを見つけます。SuperTrend のフィルターとして使用されます。 マルチタイムフレーム分析:   M5 から H1 または H4 まで、さまざまなタイムフレームで市場を常に把握します。 カスタマイズ可能なアラート: カスタム取引条件が満たされ
IX Power MT5
Daniel Stein
4.92 (13)
IX Power: 指数、商品、暗号資産、外国為替市場の洞察を発見 概要 IX Power は、指数、商品、暗号資産、外国為替市場の強弱を分析するための多用途ツールです。 FX Power が全ての利用可能な通貨ペアデータを活用して外為ペアで最高の精度を提供する一方、 IX Power は基礎資産の市場データにのみ焦点を当てています。この特性により、 IX Power は非外為市場に最適であり、単純な外為分析にも信頼性の高いツールです。どのチャートでもスムーズに機能し、取引判断を向上させるための明確で実行可能な洞察を提供します。 1. IX Power がトレーダーにとって価値がある理由 複数市場での強弱分析 • IX Power は指数、商品、暗号資産、外為シンボルの強弱を計算し、それぞれの市場に合わせた洞察を提供します。 • US30、WTI、ゴールド、ビットコイン、または通貨ペアなどの資産を監視して取引機会を発見できます。 幅広い市場に適応 • 外為取引では、 FX Power が関連する全ての通貨ペアを分析することで比類のない精度を提供します。 • IX Power
Gold Scalper Pro PSAR ADX Dashboard MT5 高度なシグナル検出機能を備えたプロフェッショナル向けマルチタイムフレーム取引インジケーター。 概要 Parabolic SAR V3 + ADX は、トレンド追随型の Parabolic SAR とトレンド強度を測定する Average Directional Index (ADX) を組み合わせた高性能テクニカル分析インジケーターです。この改良版は、ペアごとの最適化、多言語アラートシステム、そしてプロトレーダー向けの多時間足ダッシュボードを搭載しています。 主な特徴 基本機能 - PSAR 統合:ステップ値と最大値を調整可能なトレンド反転検出。 - ADX フィルターシステム:トレンド強度に基づき弱いシグナルを除外。 - +DI / -DI クロス検出:追加のシグナル確認を提供。 - ADX クラウド表示:動的な高さ調整によるトレンド強度の可視化。 ペア別最適化 主要な取引ペアに対する保守的なプリセット設定: - XAUUSD(金):貴金属のボラティリティに最適化。 - EURUSD:主要通貨ペア向けに調
ZORYK — MetaTrader 5専用 XAUUSDシグナル・トレードプランニングシステム このような経験はありませんか。 ゴールドを分析し、エントリーを待ち、ようやくポジションを持った直後に価格が逆方向へ動く。 早すぎる決済をしてしまったり、Stop Lossを動かしたり、数秒迷っている間にチャンスを逃したりする。 その後、相場は自分が最初に予想していた方向へ進み、目標へ到達する。 問題は常に方向判断ではありません。 本当の問題は、明確な計画がなかったことです。 どこでエントリーすべきか。 どこでトレードの前提が無効になるのか。 近い利益を確保すべきか、より大きな値動きを待つべきか。 現在のsetupが本当に強いのか、それとも無理にトレードを探しているだけなのか。 ゴールドは非常に速く動きます。 正しい分析でも、明確なプランがなければ数秒で悪い判断に変わることがあります。 ZORYKは、その問題を解決するために開発されました。 ZORYKとは ZORYKは、MetaTrader 5とXAUUSDのM5チャート専用に開発された、シグナルとトレードプ
KAMA Confluence Engine トレンドに沿って取引し、反転した瞬間にエントリー、ストップ、ターゲットを即座に把握する。 KAMA Confluence Engine は、カウフマン適応型移動平均(KAMA)を中心に構築されたオールインワンのトレンド指標であり、ティック出来高の加重、マルチタイムフレーム確認、自動トレードレベルを組み合わせています。市場環境に応じて適応し、トレンド時は素早く反応し、レンジ時はノイズを抑えて安定した動きを示します。常に「正しい側」に立てるよう設計されています。 特徴 出来高加重型アダプティブエンジン 実際のティック出来高が増えると KAMA ラインが加速し、出来高が減ると減速します。強いトレンドに乗り、偽の動きを避けることができます。 視認性の高いネオンリボン 明るく滑らかなラインで、下に濃い影が描かれています。緑=上昇、赤=下降、灰色=レンジ/ノートレード。遠くからでも一目でトレンドが分かります。 トレンドカラーのローソク足 ローソク足自体がトレンド色に塗られ、チャート全体が一つのストーリーとして視覚的にまとまります。 自動エントリー/SL
Smc Pro ToolKit
Talal N Z Aljarusha
5 (3)
SMC Pro ToolKit  is a professional chart-based Smart Money Concepts indicator for MetaTrader 5. It helps traders read market structure, identify key liquidity areas, organize trade context, and plan setups directly from the chart. This is not a simple buy/sell arrow indicator. It is a complete visual trading toolkit that combines Smart Money Concepts, multi-timeframe analysis, session context, setup planning, risk assistance, and professional dashboard tools in one clean workspace. Watch setup
FX Power: 通貨の強弱を分析して、より賢い取引を実現 概要 FX Power は主要通貨と金の実際の強弱をあらゆる市場状況で理解するための必須ツールです。強い通貨を買い、弱い通貨を売ることで、 FX Power は取引の意思決定を簡素化し、高い確率の取引機会を見出します。トレンドを追従する場合でも、極端なデルタ値を使用して反転を予測する場合でも、このツールはあなたの取引スタイルに完全に適応します。ただ取引するだけではなく、 FX Power で賢く取引をしましょう。 1. なぜ FX Power がトレーダーにとって非常に有益なのか 通貨と金のリアルタイム強弱分析 • FX Power は主要通貨と金の相対的な強弱を計算し、マーケットダイナミクスに関する明確な洞察を提供します。 • どの資産がリードしているか、または後れを取っているかを監視して、取引するペアを賢く選びましょう。 マルチタイムフレームの包括的なビュー • 短期、中期、長期のタイムフレームで通貨と金の強弱を追跡し、マーケットトレンドに基づいて取引戦略を調整できます。 • スキャルピングからスイングトレード
Quant Direction は、3次元の市場分析ツールです。完全に客観的なアルゴリズムベースの市場分析を提供し、様々なパラメータにわたる正確なパーセンテージ偏差を同時に算出します。高度なAI搭載モデリングツールで開発され、厳密なテストを経て開発されたこのアルゴリズムは、かつてない精度で市場を分析するように設計されています。プラットフォーム上では、あらゆる通貨ペアや金融商品を分析できます。 短期取引、デイトレード、スイングトレードなど、どのような取引スタイルに も、Quant Directionは最適な選択肢です。 オペレーターの本当の利点 Quant Directionの真の利点は、感情、眼精疲労、過剰分析を完全に排除できる点にあります。方向性を探るために何十ものチャートを手作業で精査したり、自分の好みを常に疑ったりする必要がなくなります。このシステムは、8つの時間間隔(5ヶ月から月単位まで)をミリ秒単位で処理します。あらゆる瞬間に市場を支配している主体を正確に明らかにし、常に成功確率が最も高い方向で取引できるようにします。 市場分析の3つの側面 このアルゴリズムは市場を3つの
BTMM State Engine Pro is a MetaTrader 5 indicator for traders who use the Beat The Market Maker approach: Asian session context, kill zone timing, level progression, peak formation detection, and a multi-pair scanner from a single chart. It combines cycle state logic with a built-in scanner dashboard so you do not need the same tool on many charts at once. What it does Draws the Asian session range; session times can follow broker server offset or be set in inputs. Tracks level progression (L
この製品は 2026 年の市場向けに更新され、最新の MT5 ビルドに最適化されています。 価格更新のお知らせ: Smart Price Action Concepts は現在 $200 で提供されています。 次の 30 件の購入 後、価格は $299 に上がります。 特別オファー: 購入後、私にプライベートメッセージを送ることで、 無料ボーナス + ギフト を受け取ることができます。 まず、このトレーディングツールはリペイントなし、再描画なし、遅延なしのインジケーターであり、プロフェッショナルな取引に最適であることを強調しておきます。 Online course , and manual Smart Price Action Concepts Indicator は、初心者から経験豊富なトレーダーまで使える非常に強力なツールです。20 種類以上の便利なインジケーターを 1 つにまとめ、Inner Circle Trader Analysis や Smart Money Concepts Trading Strategies などの高度な取引アイデアを組み合わせています。このインジケ
UZFX {SSS} スキャルピング・スマートシグナル v4.0 MT5は、変動の激しい市場において正確かつリアルタイムのシグナルを求めるスキャルパー、デイトレーダー、スイングトレーダー向けに設計された、リペイントのない高性能な取引インジケーターです。(UZFX-LABS)によって開発されたこのインジケーターは、価格行動分析、トレンド確認、スマートフィルタリングを組み合わせることで、すべての通貨ペアおよび時間軸において、高確率の売買シグナル、警告シグナル、トレンド継続の機会を生成します。 トレードの判断に迷うのはもうやめましょう。明確さ、正確さ、そして規律ある市場執行を求めるトレーダーのために設計された、体系的なシグナルシステムに従い始めましょう。 私のおすすめ* 最適な時間足:15分足以上。 {H1} が私のお気に入りです。そして、その成果は驚異的です…!! 主な機能の更新 • 自動売買シグナル検出 • 高度な反転認識ロジック • 市場反転の可能性に先立つ早期警告シグナル • トレンド継続確認シグナル • エントリー、ストップロス、TP1、TP2、TP3レベルを備えた組み込み型
AXIOM MATRIX MT5 ローンチ価格:$99 Axiom Matrix はローンチ価格 $99 でご利用いただけます。 最初の30件の購入後、価格は $199 に上がります。 ご購入後、手順のご案内と限定ギフトボーナスの受け取りのために、直接DMをお送りください。 Axiom Matrix は、MetaTrader 5 用のプロフェッショナルなマルチシンボル・マルチタイムフレーム市場スキャナー兼意思決定ダッシュボードです。 Market Watch をスキャンし、複数の時間足を分析し、複数のエビデンスエンジンを読み取り、最も強いチャンスを比較し、1つのクリーンなマトリックスダッシュボード内で最適な BUY、SELL、WAIT、またはブロック状態を表示します。 私が Axiom Matrix を作った理由は、市場スキャンという重い作業を代わりに行ってくれる1つのツールが欲しかったからです。 RSI だけを確認したくありませんでした。 次に MACD だけ。 次に移動平均線。 次に出来高。 次にボラティリティ。 次にサポートとレジスタンス。 そして、1つのトレードアイデアを作るた
作者のその他のプロダクト
OWL Volume Profile & Order Flow MT5 Indicator Professional Volume Profile with Real-Time Order Flow Analysis OWL Volume Profile & Order Flow is a powerful, clean, and highly customizable indicator for MetaTrader 5 that combines classic Volume Profile analysis with advanced Order Flow elements. It displays the Point of Control (POC) , Value Area High (VAH) , Value Area Low (VAL) , buy/sell volume delta , and imbalance detection directly on your chart. Designed for day traders, scalpers, and sw
Fuzzy Trend Scanner
Gabriel Alejandro Sanchez Lledo
WARLOCK Trend Screener AI Fuzzy MT5 — 最先端のマルチシンボルAI搭載トレンドスキャナー 市場全体の高確率なトレンドトレードを数秒で発見 — リアルなAIスタイルの確率スコアリングを搭載。 WARLOCK Trend Screener AI Fuzzy MT5 は、誰よりも早く最強のトレンドを掴みたい本格的なトレーダーのために設計された、究極の次世代トレンドスキャナーです。 もう28個のチャートを切り替える必要はありません。動きの強さを予測する必要もありません。 ファジー論理 (Fuzzy Logic) + AIコンフルエンス・スコアリング を備えた洗練されたダッシュボードで、市場全体を一目で把握できます。 WARLOCK Trend Screener AI Fuzzy が選ばれる理由 主要28通貨ペア・9つの時間足 を同時にスキャン。 正確なトレンド確率% (0-100%) を各セルに表示。 100% リペイントなしのシグナル — 確定足でのみ矢印が表示されます。 プレミアム・ダークパステルデザイン を採用。 フルインタラクティブ&ドラッグ可能 な
Warlock Gold Liquidity Reaper Pro v4 — HEDGE FUND EDITION は、XAUUSD(ゴールド)のM15(15分足)専用に設計された機関投資家レベルのエキスパートアドバイザー(EA)です。プロのトレンドフォロー型ファンドと同じ原則に基づいて構築されており、4つのタイムフレームによるトレンド合致システムと、ICT/SMC(スマートマネーコンセプト)のプライスアクション根拠を組み合わせ、一貫性のある方向性のある利益成長を実現します。 コア・フィロソフィー — 決してトレンドに逆らわない 多くのゴールドEAが失敗する理由は、H4、日足、週足のマクロトレンドが逆方向を向いているにもかかわらず、M15でICTセットアップを取ってしまうからです。ゴールドは2022年から2024年にかけて、中央銀行の需要や地政学的リスクを背景に長期的な強気トレンドにありました。この期間にショート(売り)を仕掛けたシステムは一貫して損失を出しています。 Gold Liquidity Reaper Pro v4 は、交渉の余地のないルールでこれを解決します。「週足が上昇
Warlock Signal Liquidity Reaper Dashboard v1.2 は、 MetaTrader 5 専用のプロフェッショナルなマルチタイムフレーム信号インジケーターです。当社の Gold Liquidity Reaper Pro EA シリーズと同じ機関投資家の手法に基づいて設計されており、週足のマクロトレンドから5分足の精密なエントリーまで、市場の全体像を一目で把握することができます。 一言で言うと 6つのタイムフレームを同時に読み取り、それぞれを 強気(BULLISH) 、 弱気(BEARISH) 、または 中立(NEUTRAL) としてスコアリングします。十分な一致が見られた場合、エントリー価格、ストップロス、テイクプロフィットを含む完全な ICT トレードセットアップをチャート上に直接生成します。 6タイムフレーム・バイアスパネル パネルの上部には、各主要タイムフレームの方向性のバイアスがリアルタイムで表示されます。 W1 — 週足(最高マクロバイアス): 機関投資家の方向性を示します。価格が週足EMA200の上にあるか下にあるかで、市場が構造的な強
Magic Signals Indicator
Gabriel Alejandro Sanchez Lledo
Warlock Magic Signals — マルチタイムフレーム信号インジケーター v3.2 8つのタイムフレームで高確率シグナルを提供 | チャート上に Entry + SL + 3×TP を自動表示 Warlock Magic Signals は、明確さ・精度・信頼性を重視する本格的なトレーダー向けに開発された、高度なマルチタイムフレーム信号インジケーターです。 同時に 8つのタイムフレーム (M1、M2、M5、M15、H1、H4、D1、W1)を分析し、各タイムフレームで以下の4つの重要なテクニカル条件を評価します: EMA 50/200 のアライメント → トレンド方向の判断 ADX(14) ≥ 閾値 → トレンドの強さ確認 RSI(14) の反発・反転 → モメンタムの検証 Bollinger Bands のタッチ → ボラティリティに基づく精密なエントリータイミング 各タイムフレームごとに明確なシグナルを生成: LONG(買い) | SHORT(売り) | NEUTRAL(中立) さらに 強度スコア(0〜4) をスタイリッシュなミニプログレスバーで表示します。
Owl Multi Symbol Dashboard
Gabriel Alejandro Sanchez Lledo
OwlElite Pro Multi-Symbol SMC Dashboard MT5 プロフェッショナル・スマートマネーコンセプト(SMC)ダッシュボード + リペイントなしシグナル 製品概要: OwlElite Proは、機関投資家レベルの根拠(コンフルエンス)をクリーンでプロフェッショナルなインターフェースで求める、本格的なFX・ゴールド・株価指数トレーダーのために設計されたプレミアムな多通貨ペア**SMC(スマートマネーコンセプト)**ダッシュボードです。 この強力なMT5インジケーターは、最大 30通貨ペアと9つの時間足 のリアルタイムスキャン機能に加え、高度なSMCツール( オーダーブロック、フェアバリューギャップ(FVG)、ボス(BOS)、チョーチ(ChoCH)、流動性の確保(Liquidity Grab) )を搭載。さらに、平均足、EMA 50/200、RSIの根拠を融合させることで、勝率の高いエントリーポイントを特定します。 主な特徴 多通貨ペア × 多時間足ダッシュボード — 主要ペア(EURUSD, GBPUSD, XAUUSD等)の強気・弱気の勢いを、M1から
PropFirm Guardian Dashboard MT5 プロップトレーダーのための、究極のリアルタイム・リスク管理ツール 資金提供アカウントを守り抜き、あらゆるチャレンジを確かな自信で突破しましょう。 PropFirm Guardian Dashboard MT5 は、FTMO、The5ers、Funding Pips、SurgeTrader などのプロップファームを利用するトレーダー向けに特別設計された、最も先進的でプロフェッショナルな監視ツールです。 リスクの「勘」に頼るのはもう終わりにしましょう。1日の最大ドローダウン制限に怯える必要もありません。1秒ごとの正確な状況を常に把握できます。 選ばれる理由 圧倒的な視認性: 洗練されたダッシュボードで、アカウントの健康状態をリアルタイムに一目で確認。 即時アラート通知: ルール違反を犯す前に警告を発し、失格のリスクを回避。 プロフェッショナル・デザイン: 高級感のあるダークパステルカラーを採用した、ハイエンドな外観。 高いカスタマイズ性: パラメータ調整が可能で、MQL5ストラテジーテスターにも100%対応。 主な機能 1日
Heiken Ashi SMC
Gabriel Alejandro Sanchez Lledo
WARLOCK Heiken Ashi SMC Elite MT5: 究極の平均足インジケーター(リペイントなし)+ スマートマネーコンセプト (SMC) ついに、 リペイント(再描画)一切なし の平均足と、強力なスマートマネーコンセプト(SMC)が融合——。最高峰のプレミアムツールが誕生しました。 WARLOCK Heiken Ashi SMC Elite MT5 は、MQL5マーケットで最も先進的かつクリーンな非リペイント型インジケーターです。平均足の滑らかなトレンド把握と、機関投資家レベルのSMC(オーダーブロック、FVG、BOS/ChoCH)を統合。圧倒的な視認性と高い勝率を誇るエントリーポイントを提供します。 偽のシグナルや、後から消える矢印に悩まされる日々はもう終わりです。プロフェッショナルで信頼性の高いトレードを実現しましょう。 多くのトレーダーに選ばれる理由 100% リペイントなしのシグナル: 矢印はローソク足の確定時にのみ表示され、一度出たら消えません。 強力なコンフルエンス(根拠の重なり): 平均足 + SMC + EMA + RSI。 プロ仕様のマルチタイムフ
Session Killer SMC
Gabriel Alejandro Sanchez Lledo
Warlock Session Killer SMC MT5 — 2026年最強のセッションベース・スマートマネーコンセプト(SMC)インジケーター 最も勝率の高い「キルゾーン」でのみトレードしましょう。 そこは、本物の機関投資家の資金が市場を動かす場所です。 Warlock Session Killer SMC MT5 は、時間軸を極めた究極のSMCインジケーターです。アジア、ロンドン、ニューヨークの各セッションを自動的に検出し、強力なキルゾーン(セッションの重なり)を強調表示します。オーダーブロック(OB)、フェアバリューギャップ(FVG)、BOS/ChoCH、リクイディティ・グラブ(流動性の確保)を活用し、 リペイントなし の高確率なエントリーポイントを提供します。 出来高の少ない時間帯に「盲目的に」トレードするのはもう終わりにしましょう。スマートマネーが最も活発になる時間帯に、銀行と同じようにトレードを開始してください。 プロトレーダーが Warlock Session Killer SMC MT5 を選ぶ理由 3つの主要セッションと正確なキルゾーン期間を自動強調表示 SMCの
Owl Mtf Trend Dashboard
Gabriel Alejandro Sanchez Lledo
OWL MTF Trend Dashboard Multi-Timeframe Trend Strength Scanner with ADX + MA Alignment + Confluence Score Professional Edition v1.05 – Market Ready Professional Product Description (Ready for MQL5 Market) OWL MTF Trend Dashboard is a sleek, high-performance multi-timeframe trend analyzer that instantly shows you the true market direction across 9 timeframes (M1 to MN) for up to 5 symbols simultaneously . It combines three powerful trend confirmation tools in one beautiful dashboard: Triple MA Al
OWL Supply & Demand Detector v1.01 Simple & Complete User Guide What is it? The OWL Supply & Demand Detector is a MetaTrader 5 indicator that automatically finds Supply zones (selling areas) and Demand zones (buying areas) on the chart. It also shows how strong each zone is, whether it has been tested, and includes a clean dashboard with useful information. Main Features Automatically draws Supply and Demand zones Gives each zone a strength score from 1 to 5 stars () Shows if a zone is Fres
OWL Volatility & ATR Multi-Symbol Dashboard Unlock the Power of Market Volatility – Trade Smarter, Faster, and with Greater Confidence Introducing the OWL Volatility & ATR Multi-Symbol Dashboard — a professional-grade, all-in-one volatility analysis tool designed for serious Forex, Gold, and Indices traders on MetaTrader 5. In today's fast-moving markets, understanding true volatility is the key to better entries, smarter risk management, and higher-probability trades. This sleek, real-time d
OWL Trend Predictor PRO
Gabriel Alejandro Sanchez Lledo
OWL AI Trend Predictor PRO & Bias Score is a professional, non-repainting technical indicator for MetaTrader 5 that combines linear regression channels , multi-factor statistical scoring, and an AI-style bias engine to deliver a clear, real-time market bias and next-candle forecast. Designed for serious traders who want more than simple moving averages or oscillators, this tool fuses classical statistical analysis with modern multi-timeframe machine-learning-inspired scoring to help you identify
ARCANE ADAPTIVE TREND QUANTUM — AATQ v1.6 The Most Sophisticated Adaptive Trend Intelligence System Ever Built for MetaTrader 5 "Not just an indicator. A complete autonomous trading intelligence engine that thinks, adapts, and scores every market condition in real time — then tells you exactly when and where to act." WHAT MAKES AATQ DIFFERENT FROM EVERYTHING ELSE ON THE MARKET Most indicators on MQL5 are wrappers around a single idea — a moving average crossover, an RSI threshold, a Bolling
ARCANE PROFESSIONAL — ICT Multi-Confluency Trade Engine v2.0 The most sophisticated Smart Money Concepts indicator on the MQL5 marketplace. Built for traders who demand institutional-grade precision — not just signals, but the exact price level where banks place their orders. WHAT MAKES ARCANE DIFFERENT Most indicators tell you when to trade. ARCANE tells you where to place your order — down to the exact price, calculated from the same confluency framework used by institutional desks world

Arcane Fibonacci Indicator v2.0  **The most intelligent Fibonacci tool on the MQL5 marketplace.**    Automatic swing detection · OTE zone · Smart Money Order Blocks · FVG alignment · Confluence scoring 0–100% · Non-repainting arrows · Professional dark dashboard WHY Arcane Fibonacci Indicator v2.0 IS DIFFERENT? Every other Fibonacci indicator draws lines and leaves you to figure out which levels matter. ** Arcane Fibonacci Indicator v2.0 tells you EXACTLY which levels to trade — and scores
フィルタ:
レビューなし
レビューに返信