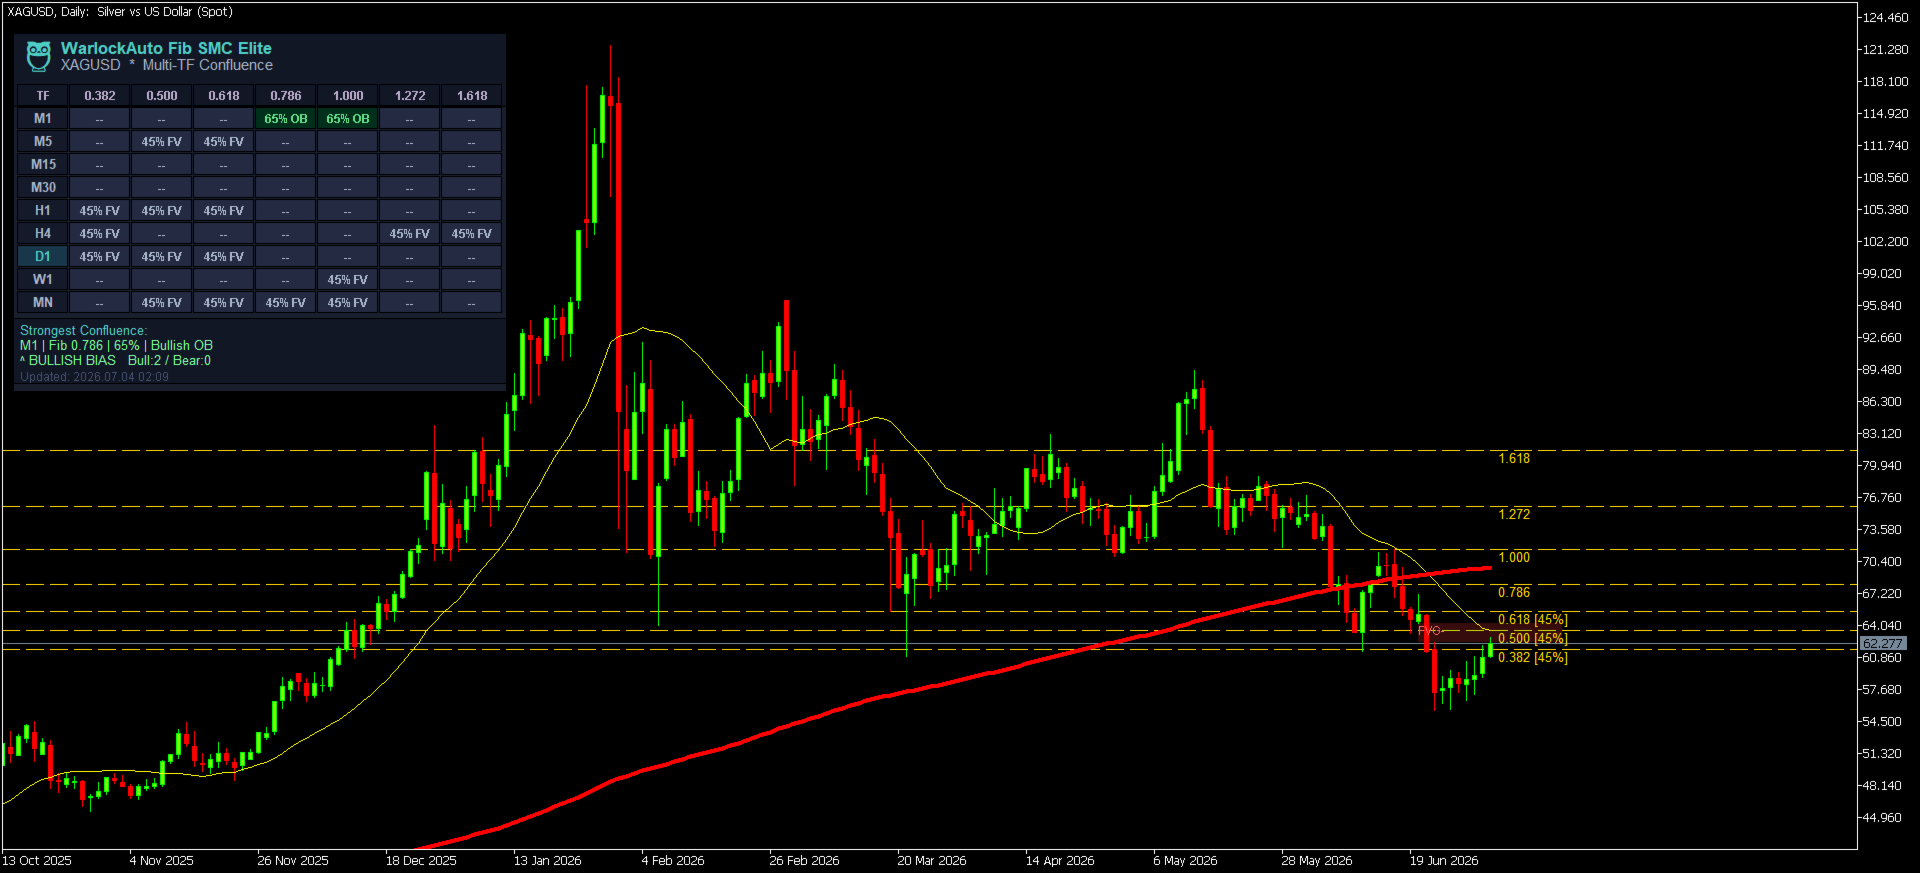
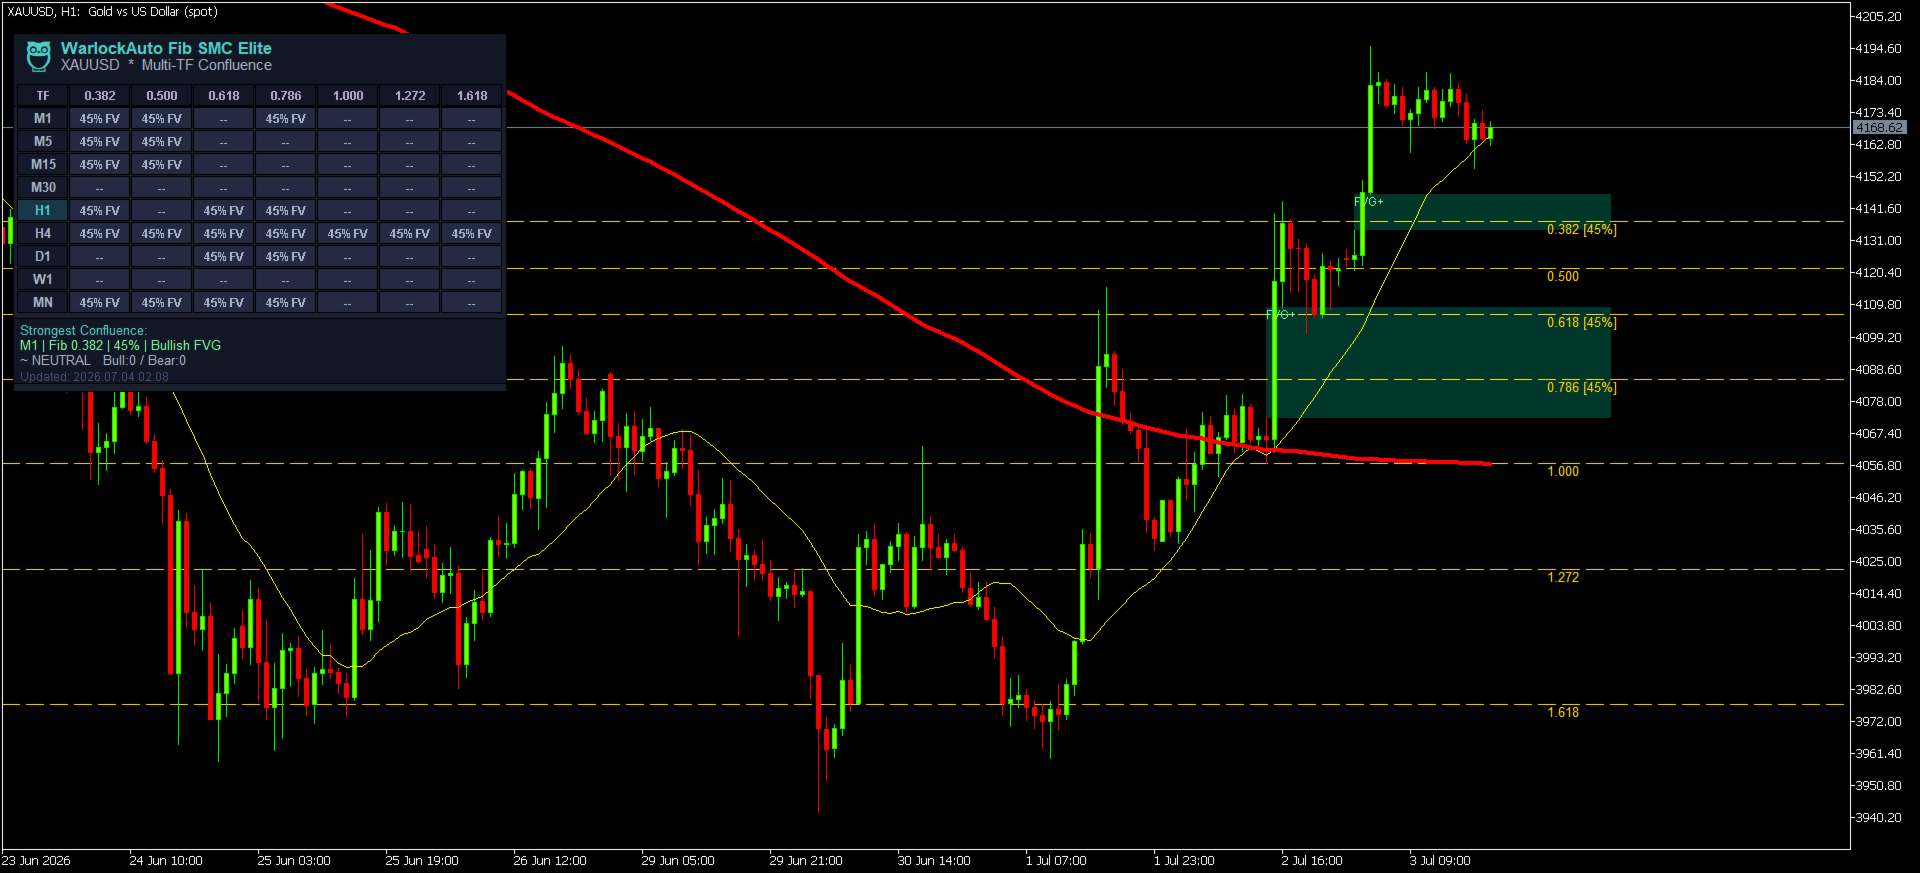
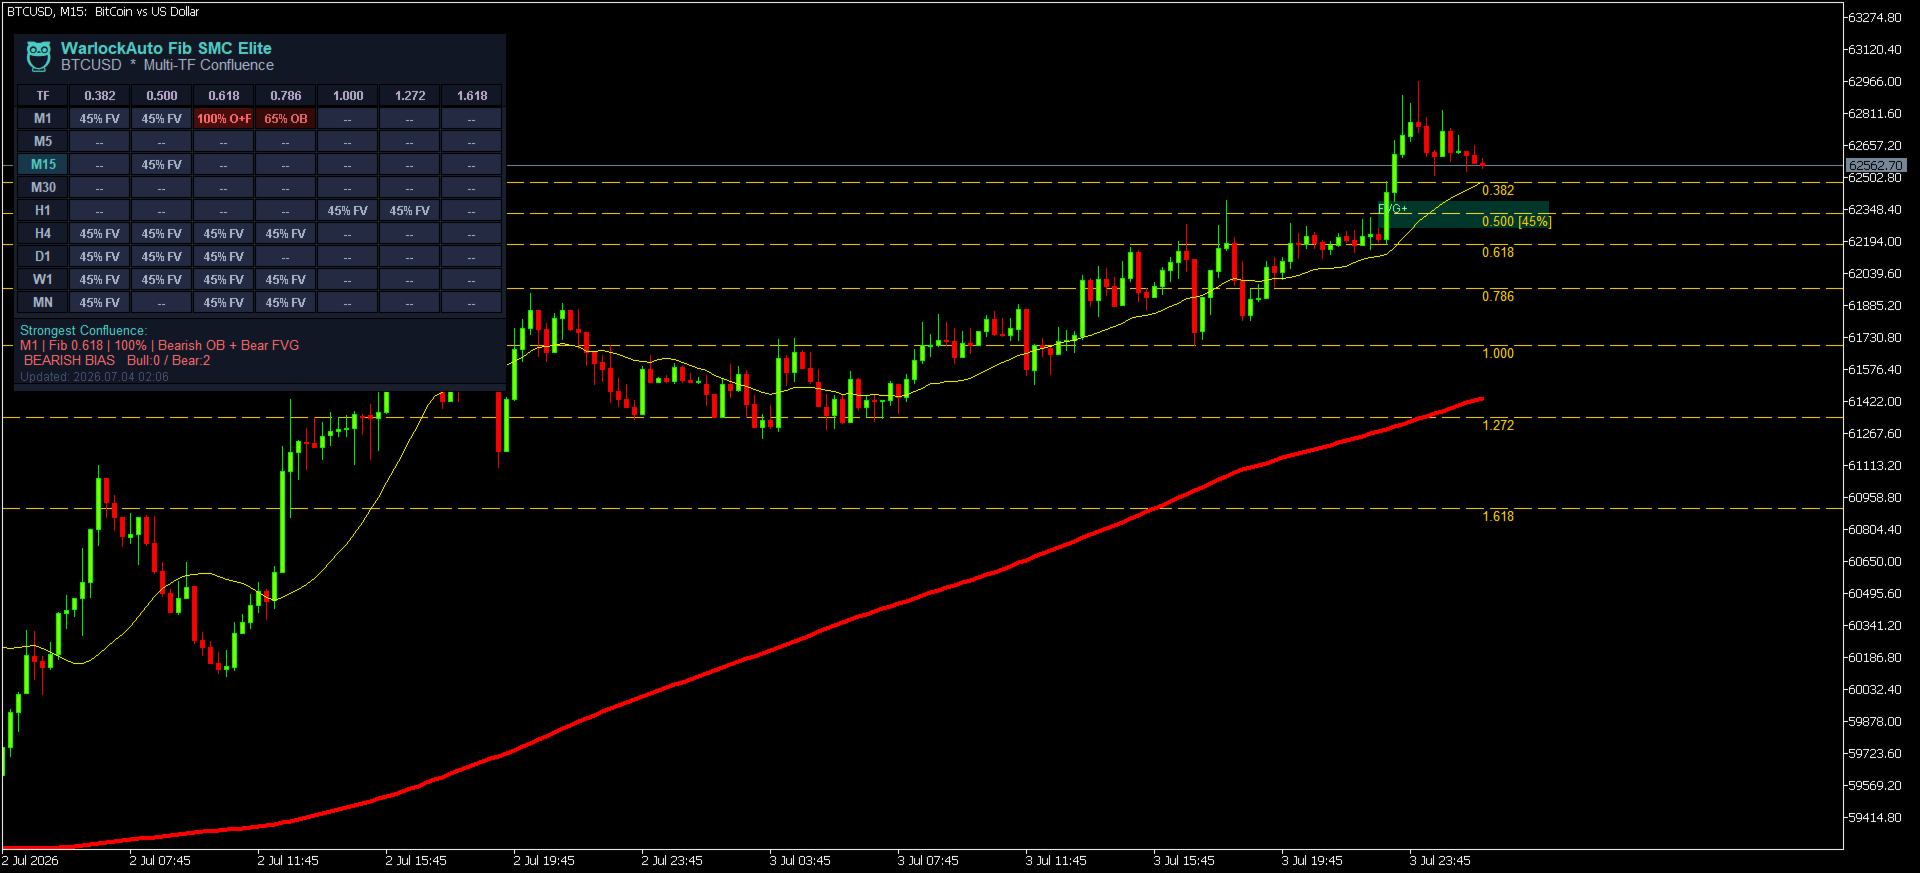
Fib Smc Pro

🦉 OWL Fibonacci SMC Elite v2.0

 **The most intelligent Fibonacci tool on the MQL5 marketplace.**  

 Automatic swing detection · OTE zone · Smart Money Order Blocks · FVG alignment · Confluence scoring 0–100% · Non-repainting arrows · Professional dark dashboard


⚡ WHY OWL FIBONACCI SMC ELITE IS DIFFERENT?

Every other Fibonacci indicator draws lines and leaves you to figure out which levels matter.

**OWL Fibonacci SMC Elite v2.0 tells you EXACTLY which levels to trade — and scores each one from 0 to 100%.**

It combines two frameworks that institutional traders use together — Fibonacci retracement/extension and Smart Money Concepts (ICT methodology) — into a single, automated engine. Every Fibonacci level is validated against real Order Blocks and Fair Value Gaps before being scored. Only levels with institutional backing receive high scores. Only the highest-scoring setups produce a signal arrow.

The result: fewer signals, much higher quality. Exactly how professional desks operate.


 🏦 THE FOUR ANALYTICAL PILLARS

 1. AUTO SWING DETECTION ENGINE

OWL automatically identifies the most recent significant swing high and swing low on your chart — no manual drawing required. Up to 3 swing pairs are detected simultaneously, with the most recent (and relevant) swing always displayed prominently.


The swing direction (Bullish or Bearish) determines how Fibonacci levels are drawn:

- **Bullish swing** (impulse UP): Fibonacci retracements draw downward from swing high — showing pullback zones to buy

- **Bearish swing** (impulse DOWN): Fibonacci retracements draw upward from swing low — showing pullback zones to sell


2. OTE ZONE — OPTIMAL TRADE ENTRY

The OTE Zone (0.618 to 0.705 Fibonacci range) is automatically highlighted as a filled zone on your chart. This is the exact zone Michael Huddleston (ICT) identified as the highest-probability entry area — where institutions place their orders during pullbacks.

The dashboard shows live OTE status:

- Price above OTE → Awaiting entry

- **Price IN OTE ZONE → Optimal entry area active**

- Price below OTE → Move passed


3. SMC CONFLUENCE ENGINE — ORDER BLOCKS + FAIR VALUE GAPS

This is what separates OWL from every other Fibonacci indicator:

**Order Block Detection**: Automatically finds the last bullish or bearish candle before a major breakout move — the exact zone where institutional buy/sell orders were placed. Displayed as semi-transparent boxes on the chart.

**Fair Value Gap Detection**: Automatically identifies 3-candle price gaps (imbalances) that price is magnetically attracted to fill. Displayed as lighter transparent boxes on the chart.


**Alignment Scoring**: When a Fibonacci level falls INSIDE an Order Block or FVG, the confluence score for that level increases dramatically. This is the institutional confirmation that the level is real — not just a mathematical coincidence.


4. CONFLUENCE SCORING SYSTEM (0–100%)

Every Fibonacci level receives an individual score calculated from multiple factors:


| Factor | Score Bonus |

|--------|------------|

| Base (any level) | +10% |

| Key level (0.500, 0.618, 0.705, 1.618) | +20% |

| OTE zone (0.618 or 0.705) | +20% |

| Aligns with active Order Block | +30% |

| Aligns with active Fair Value Gap | +20% |

| Both OB AND FVG alignment | +10% bonus |

| OTE + OB or FVG alignment | +10% bonus |

| **Maximum score** | **100%** |


Levels scoring 80%+ are highlighted in gold. Levels scoring 60–79% are highlighted in amber. Low-score levels remain dimmed.


📊 PROFESSIONAL DARK DASHBOARD


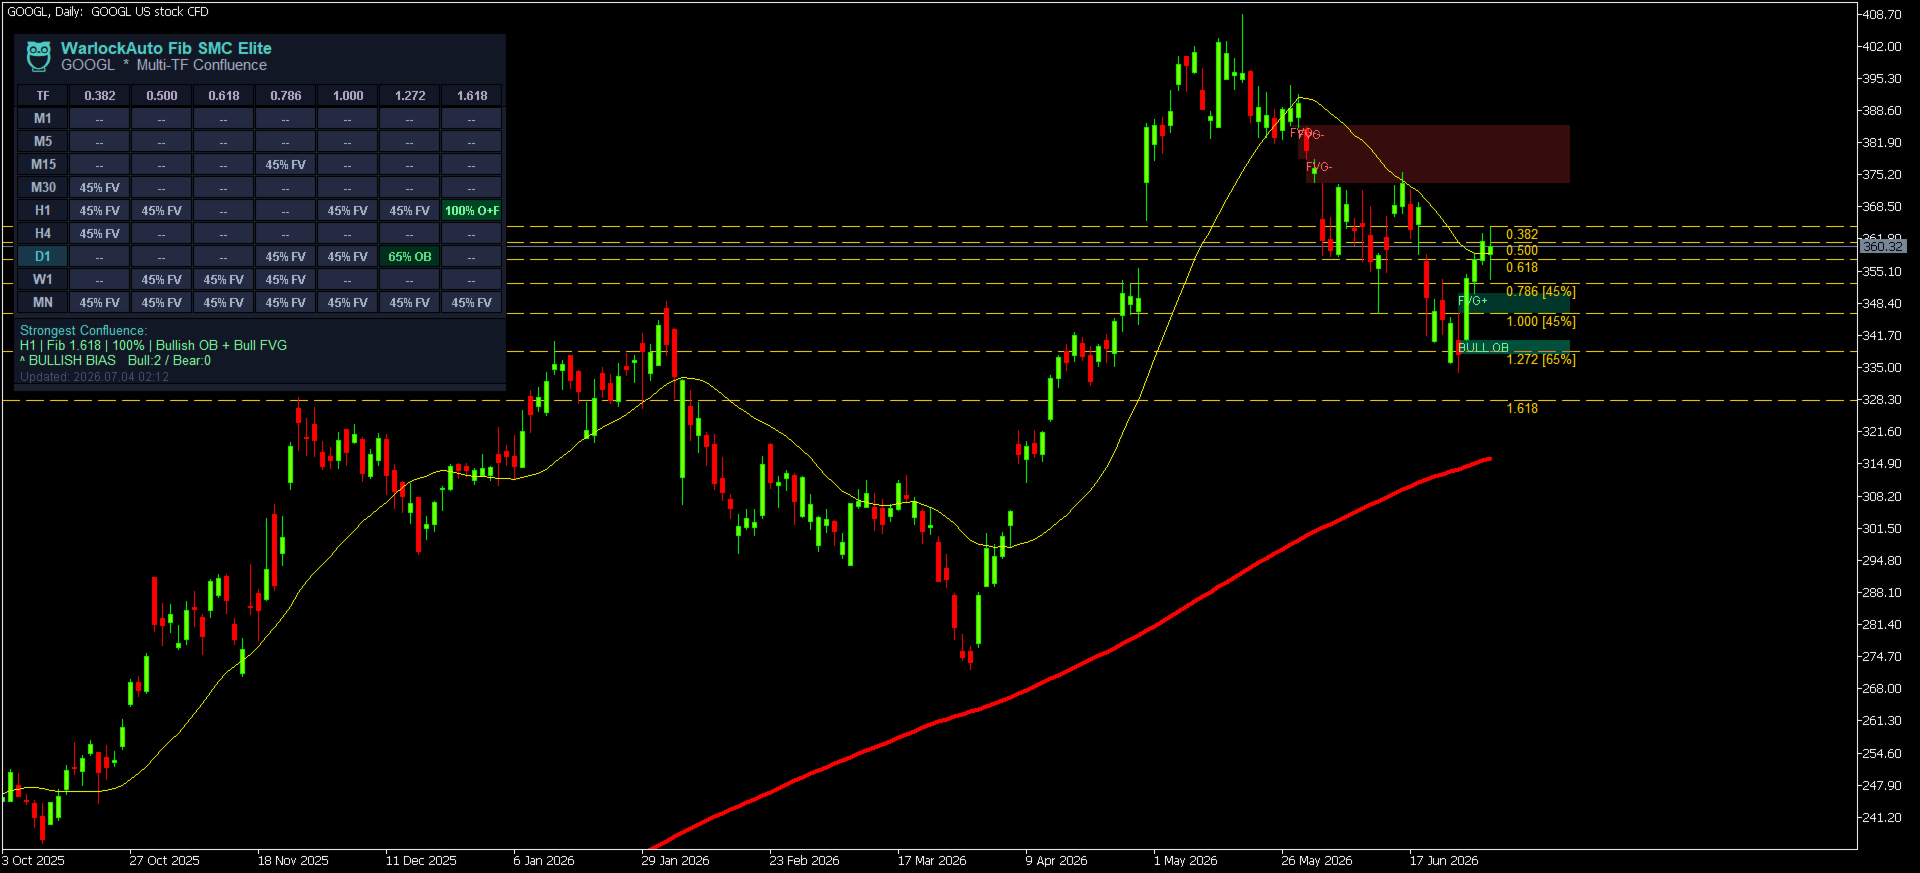
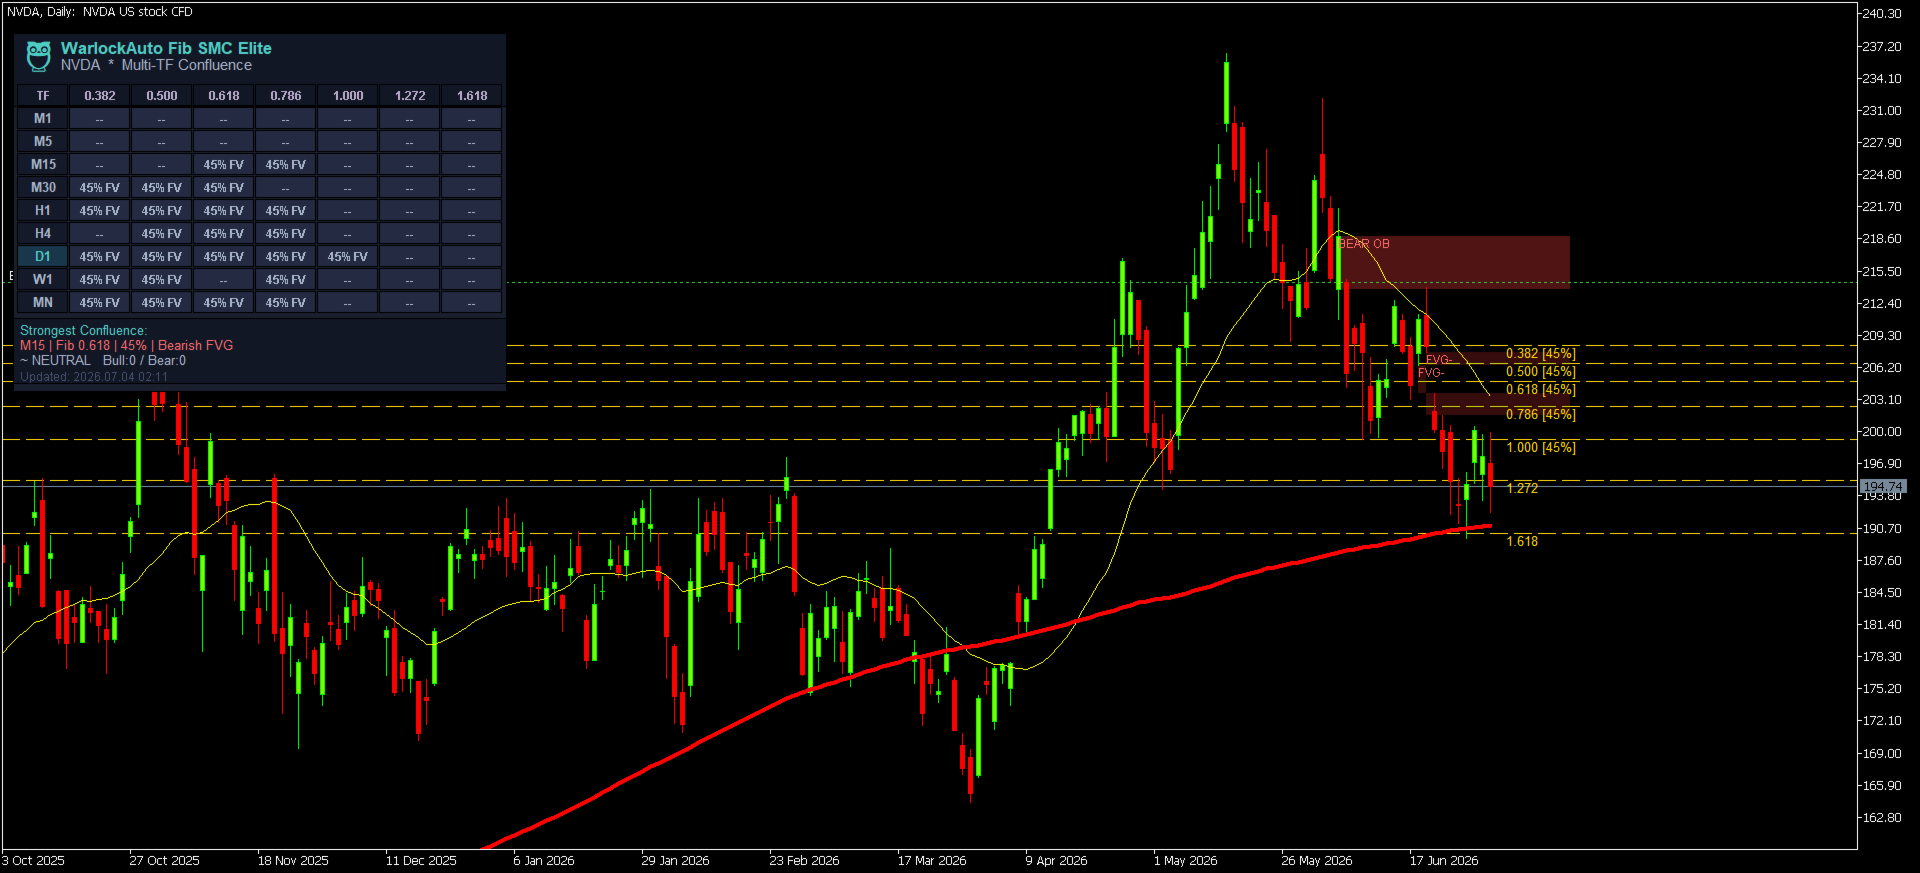
The 🦉 branded dark panel gives you a complete institutional briefing at a glance, organized into five sections:


 🔲 SWING ANALYSIS

- Direction: **▲ BULLISH** or **▼ BEARISH** (colour-coded live)

- Swing High / Low prices

- Range in points and price units


 🔲 MARKET POSITION

- **Live price** updated every tick

- Status: Above High / Below Low / **IN OTE ZONE** / Shallow / Mid / Deep Retrace

- Retracement % from swing (0% = at high, 100% = at low for bullish)


 🔲 SMC CONFLUENCE

- Active Order Blocks and Fair Value Gaps count

- **Signal**: ▲ BUY XX% / ▼ SELL XX% / WATCH XX% / SCAN XX%


 🔲 FIBONACCI LEVEL TABLE

8-row live table showing for each active level:

- **RATIO**: 0.236 through 2.618 — colour-coded by type

- **PRICE**: Exact level price — highlighted in green when price is near

- **DIST**: Distance from current price in points (+ = above, - = below)

- **SCORE**: Confluence score 0–100% — green/amber/dim based on quality


 🔲 FOOTER

- Last update timestamp

- Swing count + top score summary


 🎯 BUY/SELL SIGNAL ARROWS


Signal arrows appear on the chart **only when three conditions are met simultaneously**:


1. Price is within the OTE zone (0.618–0.705 with tolerance)

2. The OTE zone score meets your minimum threshold (default 60%)

3. The current bar has opened


**Zero Repaint Guarantee**: Arrows are placed using the bar open price — a value that is fixed the moment the bar opens and **never changes**. Only one arrow is visible at any time. Historical arrows clear on each new bar so you always see the current setup only.


Arrow colours:

- **🟢 Green ▲** = BUY signal (bullish swing, price in OTE, institutional confirmation)

- **🔴 Red ▼** = SELL signal (bearish swing, price in OTE, institutional confirmation)


 ⚙️ COMPLETE INPUT PARAMETER GUIDE


 MAIN SETTINGS

| Parameter | Default | Range | Description |

|-----------|---------|-------|-------------|

| **InpSwingLB** | 20 | 5–100 | Bars each side to confirm a swing. Higher = fewer but stronger swings. Lower = more swings, more noise. |

| **InpMaxSwings** | 2 | 1–3 | How many swing pairs to display simultaneously. 1 = cleanest, 3 = full historical context |

| **InpOBLookback** | 60 | 10–200 | How many bars to scan for Order Blocks and FVGs. Match to your trading timeframe. |

| **InpMinScore** | 60 | 0–100 | Minimum confluence score required to show a signal arrow. 60 = balanced, 75 = selective, 85 = only elite |


 RETRACEMENT LEVELS

Toggle any Fibonacci retracement level on or off. **0.618** and **0.705** are the OTE levels and are recommended always-on. **0.382** and **0.500** are key institutional reference levels.


 EXTENSION LEVELS

Toggle extension levels (>1.000). **1.272** and **1.618** are the most respected institutional targets. Enable **InpShowExt** to show all extensions.


 VISUAL SETTINGS

| Parameter | Description |

|-----------|-------------|

| **InpShowOTE** | Show/hide the OTE zone fill (highly recommended ON) |

| **InpShowOBs** | Show/hide Order Block boxes on chart |

| **InpShowFVGs** | Show/hide Fair Value Gap boxes |

| **InpShowLabels** | Show price labels and score tags on each Fib line |

| **InpShowArrows** | Show/hide signal arrows |

| **InpColBull/Bear** | Customize bullish and bearish Fib line colours |

| **InpColOTE** | OTE zone fill colour (default: institutional purple) |

| **InpLineW** | Line thickness 1–3 |


 DASHBOARD

| Parameter | Default | Description |

|-----------|---------|-------------|

| **InpShowDash** | true | Show/hide dashboard panel |

| **InpDashX** | 23 | Horizontal position from left edge |

| **InpDashY** | 33 | Vertical position from top edge |


 ALERTS

| Parameter | Description |

|-----------|-------------|

| **InpAlertArrow** | Popup alert when a BUY or SELL arrow fires |

| **InpAlertOTE** | Alert when price enters the OTE zone (max every 5 minutes) |

| **InpAlertPush** | Send push notifications to MetaTrader mobile app |


 📱 HOW TO USE — STEP BY STEP


 STEP 1: INITIAL CONFIGURATION

The default settings are calibrated for **H1 and H4 timeframes** on major pairs (EURUSD, GBPUSD, XAUUSD, BTCUSD). For other setups, adjust:


**For scalping (M1–M5):**

- InpSwingLB = 8–12

- InpOBLookback = 30

- InpMinScore = 55


**For day trading (M15–H1):**

- InpSwingLB = 15–25 *(default)*

- InpOBLookback = 50–80 *(default)*

- InpMinScore = 60 *(default)*


**For swing trading (H4–Daily):**

- InpSwingLB = 30–50

- InpOBLookback = 100–150

- InpMinScore = 70


 STEP 2: READING THE CHART


**What you see on the chart:**

- **Purple filled zone**: OTE zone (0.618–0.705) — your primary entry area

- **Green semi-transparent boxes**: Bullish Order Blocks (institutional buy zones)

- **Red semi-transparent boxes**: Bearish Order Blocks (institutional sell zones)

- **Blue semi-transparent boxes**: Bullish Fair Value Gaps (price magnets)

- **Dark pink boxes**: Bearish Fair Value Gaps

- **Horizontal lines**: Fibonacci levels, colour-coded by type and score

- **H / L labels**: Swing high and swing low anchor points

- **▲ ▼ Arrows**: Entry signals at high-confluence OTE levels


STEP 3: READING THE DASHBOARD


Open the dashboard and go through it top to bottom:


1. **Swing Analysis**: Confirm the direction. If it shows ▲ BULLISH, you're looking for BUY setups. If ▼ BEARISH, you're looking for SELL setups.


2. **Market Position**: Watch the Status row. When it shows **▶ IN OTE ZONE**, price has entered your primary entry area. The Retrace % tells you exactly where in the swing you are.


3. **SMC Confluence**: Check the Signal row. **▲ BUY XX%** means an arrow has fired with that confluence score. **WATCH XX%** means conditions are approaching but not met. **SCAN XX%** means no qualified setup.


4. **Fibonacci Table**: Find levels scoring 70%+ (shown in green). These are your highest-probability price zones. Levels shown in gold (80%+) have both OB and FVG alignment — the strongest setups.


STEP 4: EXECUTING A TRADE


**BUY SETUP CHECKLIST:**

- [ ] Dashboard shows ▲ BULLISH direction

- [ ] Price is IN OTE ZONE (Status row, 0.618–0.705 retrace range)

- [ ] One or more Fibonacci levels score 65%+ in the table

- [ ] A green OB box is near the OTE zone

- [ ] A green ▲ arrow has appeared on the chart

- [ ] RSI or Stochastic is oversold (optional confluence from your other indicators)


**Execution**: Place a limit BUY order at or near the 0.618 Fibonacci level. Your Stop Loss goes below the swing low (0 line). Take profits at swing high (1.000 line), 1.272, and 1.618 for extensions.


**SELL SETUP CHECKLIST:**

- [ ] Dashboard shows ▼ BEARISH direction

- [ ] Price is IN OTE ZONE (0.618–0.705 retrace measured from low UP)

- [ ] One or more Fibonacci levels score 65%+ in the table

- [ ] A red OB box is near the OTE zone

- [ ] A red ▼ arrow has appeared on the chart


**Execution**: Place a limit SELL order at or near the 0.618 Fibonacci level. Stop Loss goes above swing high. Take profits at swing low (1.000), 1.272, and 1.618 extensions.


STEP 5: RISK MANAGEMENT

- **Maximum risk per trade**: 1–2% of account capital

- **Recommended R:R**: Minimum 1:2 (TP1) to 1:4 (TP3 at 1.618)

- **Position sizing**: Calculate based on distance from entry to swing low/high SL

- **Best session**: London open (08:00–12:00 UTC) and London/NY overlap (13:00–17:00 UTC) for highest institutional participation


💡 PROFESSIONAL TIPS


 Tip 1: The Confluence Stack

The highest probability trades occur when you have ALL FOUR factors aligned:

- ✅ Price in OTE zone (0.618–0.705)

- ✅ Order Block in OTE area (OB box overlaps OTE zone)

- ✅ Fair Value Gap pointing to the same level

- ✅ Swing direction matches higher timeframe trend


When all four align, score reaches 90%+ and the trade is institutional-grade.


Tip 2: Multi-Timeframe Confirmation

Use OWL on two timeframes simultaneously:

- **Higher TF (H4/Daily)**: Identify the primary swing direction and OTE zone

- **Lower TF (M15/H1)**: Time your entry precisely when the score fires


 Tip 3: Score as a Filter, Not a Signal

Don't treat the arrow as a "click and trade" signal. Use the score as a quality filter:

- Score 80–100%: Highest conviction. Can enter at market when OTE reached.

- Score 65–79%: Good setup. Wait for a confirming candle close inside OTE.

- Score 50–64%: Moderate. Reduce position size or skip.

- Score < 50%: Avoid. Not enough institutional backing.


 Tip 4: Order Block Quality

Fresh (unmitigated) OBs are far more powerful than tested ones. If an OB box is near your entry AND it has never been retested since its formation, the probability of a reaction increases significantly.


 Tip 5: Fair Value Gap as Target

When entering a BUY at a bullish OTE level, check if there's a Bearish FVG above the entry — this is often your first take-profit target, since price seeks to fill the imbalance.


 Tip 6: Session Timing

The OTE setups work best during:

- **London Open (08:00–10:00 UTC)**: New York institutional hours begin

- **London/NY Overlap (13:00–17:00 UTC)**: Maximum liquidity, sharpest moves

- Avoid OTE entries during Asian session (00:00–07:00 UTC) — lower participation


 🔧 TECHNICAL SPECIFICATIONS:


| Specification | Details |

|--------------|---------|

| **Platform** | MetaTrader 5 |

| **Build** | 3000+ |

| **Indicator Type** | Chart window (overlaid on price) |

| **Arrow Buffers** | 2 (Buy + Sell) |

| **Repaint** | ❌ Zero repaint — arrows set at bar open price |

| **Arrows on chart** | Maximum 1 at any time |

| **DLL required** | ❌ No |

| **External files** | ❌ No |

| **Strategy Tester** | ✅ Fully compatible |

| **Works on** | All symbols (Forex, Gold, Indices, Crypto, Stocks) |

| **Works on** | All timeframes M1 through Monthly |

| **Dashboard** | Dark professional panel, 333px wide |

| **Dashboard update** | Live price every tick |

| **Signal update** | Once per bar (new-bar gate) |

| **CPU load** | Minimal — heavy analysis runs once per bar only |


❓ FREQUENTLY ASKED QUESTIONS


**Q: Does OWL work on cryptocurrency and gold?**  

A: Yes. OWL works on any symbol available in your MetaTrader 5 broker — Forex pairs, XAUUSD (Gold), BTCUSD, indices (US30, NAS100, SP500), stocks, and commodities. The Fibonacci and SMC methodology is universal.


**Q: Why are there no arrows even though price is near the OTE zone?**  

A: The OTE score may be below your InpMinScore threshold. Check the dashboard → Fibonacci Table for the score of the 0.618 and 0.705 rows. If the score is low, no OB or FVG is aligned with those levels. Lower InpMinScore to 45–50 to see arrows in lower-confluence environments, or wait for the OB/FVG alignment to form naturally.


**Q: How many swings should I display at once?**  

A: Start with InpMaxSwings = 1 for a clean chart, focusing on the most recent swing only. Use 2 swings to see if older structure confirms the current setup. Use 3 only for historical analysis.


**Q: The swing detection picks a very small swing. How do I fix this?**  

A: Increase InpSwingLB (e.g., from 20 to 35). A higher lookback requires more bars on each side to qualify as a swing, filtering out minor fluctuations and keeping only major structural swings.


**Q: Is this indicator repainting?**  

A: No. Arrows are placed using `open[0]` — the price at which the current bar opened, which is permanently fixed and never changes. The `ArrayInitialize` call on each new bar clears old arrows to keep exactly one visible at all times, but the current bar's signal, once placed, uses a fixed price.


**Q: Can I use OWL with my Expert Advisor?**  

A: Yes. Read Buffer 0 (BUY signal) and Buffer 1 (SELL signal) using `iCustom()`. A non-EMPTY_VALUE at index 0 indicates an active signal.


**Q: What's the difference between an Order Block and an FVG in OWL?**  

A: An **Order Block** is the specific candle before a major move — the zone where institutions placed large orders. An **FVG** (Fair Value Gap) is a price gap left between three candles that price hasn't returned to fill. Both are institutional footprints. When a Fibonacci level aligns with BOTH, it's the highest-conviction setup available.


 🔄 VERSION HISTORY


**v2.0 (Current) — Complete Rewrite**

- ✅ Fixed: `Wipe()` was O(n²) — replaced with `ObjectsDeleteAll()`

- ✅ Fixed: Dashboard rebuilt every bar — now Create/Update pattern (OnInit only)

- ✅ Fixed: Swing direction logic mismatch between comment and code

- ✅ Fixed: `posRatio` division-by-zero guard on zero range

- ✅ Fixed: Alert throttle now per-symbol (not per-level, preventing spam)

- ✅ Fixed: Chart and dashboard object namespaces now fully separated

- ✅ Fixed: Fib level table rows previously shared `g_oc` counter with chart objects

- ✅ New: SMC Order Block detection (volume-weighted, most-recent-first)

- ✅ New: Fair Value Gap detection and chart visualization

- ✅ New: Confluence scoring 0–100% per Fibonacci level

- ✅ New: Non-repainting arrows placed at bar open price

- ✅ New: Single arrow only — `ArrayInitialize` clears history on each bar

- ✅ New: Score-coloured Fibonacci lines (gold = 80%+, amber = 60–79%)

- ✅ New: Live price update every tick in dashboard

- ✅ New: OTE active status in dashboard


**v1.0 (Original)**

- Basic auto swing detection

- Retracement and extension levels

- OTE zone fill

- Dashboard with swing info and Fib table


---


## ⚠️ RISK DISCLAIMER


Trading financial instruments carries substantial risk of loss. OWL Fibonacci SMC Elite is a technical analysis tool designed to assist experienced traders in identifying high-probability setups using Fibonacci and ICT/Smart Money Concepts methodology. It does not guarantee profits. Past performance does not guarantee future results.


Always use proper risk management:

- Never risk more than 1–2% of capital per trade

- Always use a Stop Loss placed beyond the swing structure

- Test on a demo account before using on a live account

- OWL is a decision-support tool, not a fully automated trading system


---


*© 2026 OWL Trading Systems. All rights reserved. OWL Fibonacci SMC Elite v2.0 is built exclusively for MetaTrader 5 and distributed through the MQL5 Marketplace.

추천 제품
Presenting one-of-a-kind Gann Indicator for XAUUSD IQ Gold Gann Levels is a non-repainting, precision tool designed exclusively for XAUUSD intraday trading. It uses W.D. Gann’s square root method to plot real-time support and resistance levels, helping traders spot high-probability entries with confidence and clarity. William Delbert Gann (W.D. Gann) was an exceptional market analyst whose trading technique was based on a complex blend of mathematics, geometry, astrology, and ancient calculation
Zone Structure Scanner Panel for MT5 Find better setups faster — without scanning charts for hours. The Zone Structure Scanner Panel for MT5 helps you automatically scan multiple symbols, detect key weekly and daily support/resistance zones, read market structure, highlight confluence, and flag H4 rejection-confirmed setups from one powerful panel. Instead of jumping from chart to chart, you get ranked opportunities in one place so you can focus on the setups that matter most. Why it stands
Harmonic Pattern Structure Harmonic Pattern Structure is a professional MetaTrader 5 indicator that automatically detects classic harmonic patterns using strict Fibonacci ratio validation and XABCD price structure. Designed for traders who value precision, clean visuals, and structured analysis, the indicator highlights potential reversal zones based on price geometry, supporting consistent and objective decision-making. SUPPORTED HARMONIC PATTERNS Gartley (222) Butterfly Bat Crab Shark Cy
Delta Profile Volume
Teresinha Moraes Correia
기술 설명 – MetaTrader 5용 Delta Profile Delta Profile 은 MetaTrader 5에서 정의된 캔들 범위 내의 거래량 흐름을 세부적으로 분석하기 위해 설계된 지표입니다. 이 도구는 각 가격 수준에서 양의 거래량(상승과 관련) 과 음의 거래량(하락과 관련) 간의 불균형을 구조화하고 시각화합니다. 이를 통해 사용자는 실제로 거래가 집중되는 가격 영역과 시장 불균형이 형성되는 구간을 명확하게 파악할 수 있습니다. 핵심 개념 지표는 가격 레벨 을 인식하고 이를 양의 거래량, 음의 거래량 및 순 델타(양-음 차이)로 분류합니다. 각 가격 레벨은 수평 막대 로 차트에 표시되며, 거래가 집중되는 구간을 직관적으로 보여줍니다. 사용자는 분석할 캔들의 개수 , 가격 반올림 정밀도 , 최대 표시 레벨 수 , 표시 옵션 등을 직접 설정할 수 있습니다. 주요 기능 가격 레벨 매핑 : 사용자가 지정한 자릿수에 맞게 가격을 반올림하여 거래량을 집계합니다. 순 델타 계산 : 양
LT Support Resistance - 지지와 저항을 100% 자동으로 식별 수동으로 지지와 저항선을 그리느라 귀중한 시간을 낭비하는 데 지치셨나요? 아니면 매번 중요한 레벨을 놓쳐서 답답하셨나요? LT Support Resistance는 이러한 번거로운 작업을 없애기 위해 개발되었습니다. 여러 타임프레임(시간족)을 동시에 분석하여, 거래 중인 자산의 가장 중요한 구역을 자동으로 식별하고 차트에 표시해 줍니다. == 중요 레벨의 스마트 자동화 == 주관적이고 시간이 오래 걸리는 수동 라인 작도 대신, 본 지표는 과거 가격 데이터를 분석하여 유의미한 반전 포인트를 식별하고, 가격이 '실제'로 신뢰하고 반응하는 지지 및 저항선을 그려줍니다. 그 결과 데이터에 기반한 객관적이고 신속한 분석이 가능해집니다. == 주요 특징 == 100% 자동 감지: 수동 분석 없이도 지지/저항 레벨 식별 멀티 타임프레임(MTF): M5 차트에서 H1, H4, D1, W1 레벨을 동시에 시각화 스마트 알
CRT Candle Range Theory HTF MT5 - Ultimate CRT Indicator: 고급 ICT 개념 및 Malaysian SnR 트레이딩 시스템 가장 진보된 Candle Range Theory 지표로 마켓 메이커의 발자취를 마스터하십시오. Ultimate CRT Indicator를 사용하여 Smart Money Concepts(SMC)의 진정한 힘을 발휘하고 기관처럼 정확하게 거래하십시오. 진지한 트레이더를 위해 독점적으로 제작된 이 지표는 ICT Concepts(Inner Circle Trader)의 핵심 기둥인 매우 효과적인 Candle Range Theory(CRT)를 자동화하고 Malaysian Support and Resistance(SnR) 진입 방법과 FVG(Imbalance) 영역의 치명적인 정밀도로 이를 강화합니다. MT5에서 Forex, Crypto 또는 지수를 거래하든 이 알고리즘은 시장 소음을 제거하고 가짜 돌파(fakeout)를 필터링하며
Noize Absorption Index
Ekaterina Saltykova
Noize Absorption Index - is the manual trading system that measures the difference of pressure between bears forces and bulls forces. Green line - is a noize free index that showing curent situation. Zero value of index shows totally choppy/flat market.Values above zero level shows how powerfull bullish wave is and values below zero measures bearish forces.Up arrow appears on bearish market when it's ready to reverse, dn arrow appears on weak bullish market, as a result of reverse expectation.
Reverse Strike
Antonio Gutemberg Frota
Reverse Strike – Professional Gold Reversal Indicator for MetaTrader 5 EXPERT:  Reverse Strike expert Reverse Strike is a professional MetaTrader 5 indicator designed to identify high-probability reversal opportunities on XAUUSD and other trading symbols. Built with ATR trailing stop logic, linear regression analysis, and multi-timeframe confirmation, it helps traders detect potential market turning points with clarity and precision. Instead of simply following the existing trend, Reverse Stri
Volume flow Profile
Israr Hussain Shah
Master Edition은 거래량과 자금 흐름의 관점을 통해 시장 구조를 시각화하도록 설계된 전문가급 분석 도구입니다. 표준 거래량 지표와 달리, 이 도구는 차트에 일일 거래량 프로필을 직접 표시하여 가격 발견이 발생한 위치와 "스마트 머니"가 위치한 곳을 정확하게 볼 수 있게 합니다. 이 Master Edition은 명확성과 속도를 위해 설계되었으며, 로드 시 차트 레이아웃을 즉시 아름답게 만드는 독특한 자동 테마 동기화 시스템을 특징으로 합니다. 주요 기능: 진정한 자금 흐름 계산: 표준 틱 거래량을 넘어섭니다. "Use Money Flow"를 활성화하면 거래량이 가격에 따라 가중치가 부여되어 특정 가격 수준에서의 실제 자본 투입을 드러냅니다. 가치 영역(VA) 시각화: 가치 영역(기본값: 거래량의 70%)을 자동으로 계산합니다. VA Fill: 통제 구역을 즉시 식별하기 위해 가치 영역 배경을 음영 처리합니다. 주요 수준: 통제점(POC), 가치 영역 고점(VAH), 가치 영
Heiken_Ashi_Bars - MT5용 고급 추세 시각화 도구 개요 Heiken_Ashi_Bars 는 시장의 노이즈를 필터링하고 진정한 기본 추세를 강조하도록 설계된 강력하고 시각적으로 직관적인 사용자 지정 지표입니다. 기존의 캔들스틱 차트는 불규칙하여 거짓 신호와 섣불린 청산을 유발할 수 있습니다. 이 지표는 가격 데이터를 평균화하여 가격 움직임을 부드럽게 만들어 추세 지속, 반전 및 수익성 있는 진입 구간을 훨씬 쉽게 파악할 수 있도록 해줍니다. 주요 기능 및 장점 강력한 노이즈 감소: 사소한 가격 급등 및 횡보 노이즈를 필터링합니다. 명확한 시각적 신호: 색상으로 구분된 막대를 통해 강세 및 약세 모멘텀을 한눈에 파악할 수 있습니다. 리페인트 없음 (No Repaint): 막대가 마감되면 신호가 고정됩니다. 과거 막대를 다시 계산하지 않습니다. 고도로 최적화됨: 터미널 지연이 없도록 깔끔하게 코딩되었습니다. 다양한 활용: 모든 금융 상품(외환, 지수, 금속, 암호화폐)에서
Heiken Ashi Stacked Pro is a chart overlay indicator that combines smooth Heiken Ashi visual trend candles, a real-time bar completion timer, and an on-hover crosshair HUD for instant price and wick-to-body ratio diagnostics. Marketplace Description Overview Heiken Ashi Stacked Pro upgrades standard Heiken Ashi candle visuals with an interactive HUD. Designed for trend followers and price action traders, it filters out market noise using colored candles while supplying precise candle metric read
JSL Orderflow Footprint turns every candle into a price ladder that shows how much volume traded on the bid and on the ask at each price level. It highlights diagonal imbalances, stacked imbalance zones, absorption at candle extremes, cumulative delta (CVD), delta divergence and the daily session volume profile, then combines five of these order-flow conditions into a 0–100 confluence score. A signal is only issued on bar close when the score is high, clearly one-sided and confirmed by the candl
Welcome to the Ultimate Harmonic Patterns recognition indicator that is focused to detect advanced patterns. The Gartley pattern, Bat pattern, and Cypher pattern  are popular technical analysis tools used by traders to identify potential reversal points in the market. Our Ultimate Harmonic Patterns recognition Indicator is a powerful tool that uses advanced algorithms to scan the markets and identify these patterns in real-time. With our Ultimate Harmonic Patterns recognition Indicator, you ca
WAPV Weis Wave Chart Forex
Eduardo Da Costa Custodio Santos
The Weis Wave Chart Forex for MT5 is a Price and Volume indicator. The Price and Volume reading was widely disseminated through Richard Demille Wyckoff based on the three laws created by him: Supply and Demand, Cause and Effect and Effort vs. Result. In 1900 R.Wyckoff already used the wave chart in his analyses. Many years later, around 1990, David Weis Automated R. Wyckoff's wave chart and today we bring you the evolution of David Weis' wave chart. It shows the amount of Volume and the amount o
ONNYX INDICATOR 버전 1.14 MetaTrader 5용 수요·공급 구역 분석 지표입니다. 확정된 스윙을 기준으로 구역을 생성하고 ATR로 폭을 조정하며 품질을 백분율로 표시합니다. 종가가 확정된 후 생성된 BUY/SELL 신호는 사라지지 않도록 설계되었습니다. 주요 기능 - 구역 내부에 품질 백분율을 표시하는 수요·공급 구역. - 확정 봉에서 나타나는 큰 BUY/SELL 화살표. - 선택 가능한 EMA 추세 필터와 캔들 거부 확인. - 추세, 가격 레벨 및 시장 상황 패널. - 관련 경제 뉴스 최대 5개 표시. 발표 전 Forecast/Previous, 발표 후 Actual 표시. - 60초 뉴스 갱신 및 전략 테스터용 캘린더 캐시. - 팝업, 푸시 및 이메일 알림. - iCustom 버퍼: 0=BUY 가격, 1=SELL 가격. 사용 방법 차트에 지표를 적용하고 히스토리 로딩을 기다린 뒤 추세와 활성 구역을 확인하십시오. 확정 봉 신호를 개인 리스크 관리와 함께 사용하십
GDS Renko Pip ST - Fixed Brick Renko Chart Tool for MetaTrader 5 GDS Renko Pip ST is a Renko chart tool for MetaTrader 5 designed for traders who want to build and study fixed brick Renko movement using a practical pip or point-based setup. The purpose of this tool is simple: create a cleaner Renko structure so the trader can observe direction, brick runs, pullbacks, support and resistance behavior without normal candle noise. This is not a signal indicator and it does not predict the market. It
Overview Heiken Ashi CE Filtered MT5 is a technical indicator for the MetaTrader 5 platform. It integrates smoothed candlestick charting with a dynamic exit strategy and a customizable trend filter to deliver clear buy and sell signals. The indicator is designed to improve trend detection and signal reliability by reducing market noise. If you want to see more high-quality products or order the development/conversion of your own products, visit my partners' website: 4xDev Get 10% OFF on manual
거래 세션 표시기는 각 거래 세션의 시작과 끝을 강조 표시합니다 . 제품의 유료 버전은 세션의 시작/끝을 사용자 정의 할 수있는 가능성 무료 입니다. [옵션:] Asian session Open Asian session Close Asian session OpenSummertime Asian session CloseSummertime European session Open European session Close European session Open European session Close Timeshift 최상의 결과를 얻으려면 시간대를 사용하십시오. 시간 프레임에 대한 보정을 추가했습니다. 대략적인 수정: Bars           Correction ------------------ 23.50 ____ 10 23.54 ____ 5 23.55 ____ 4(5) 00.05 ____ 5(6) 시장에 나의 다른 제품 https://www.mql5.com/en/users/
Blahtech Market Profile MT5
Blahtech Limited
5 (10)
Was: $249  Now: $99   Market Profile defines a number of day types that can help the trader to determine market behaviour. A key feature is the Value Area, representing the range of price action where 70% of trading took place. Understanding the Value Area can give traders valuable insight into market direction and establish the higher odds trade. It is an excellent addition to any system you may be using. Inspired by Jim Dalton’s book “Mind Over Markets”, this indicator is designed to suit the
Trade smarter, not harder: Empower your trading with Harmonacci Patterns This is arguably the most complete harmonic price formation auto-recognition indicator you can find for the MetaTrader Platform. It detects 19 different patterns, takes fibonacci projections as seriously as you do, displays the Potential Reversal Zone (PRZ) and finds suitable stop-loss and take-profit levels. [ Installation Guide | Update Guide | Troubleshooting | FAQ | All Products  ] It detects 19 different harmonic pric
Indicador 3 Vela do movimento
Vagner Ferreira Da Silva
전문 멀티 타임프레임 모니터링 인디케이터 제품 설명 Scanner 3 do Movimento는 MetaTrader 5용 인디케이터로, 11개의 타임프레임을 동시에 모니터링하며 특정한 3캔들 반전 패턴을 자동으로 감지합니다. 이 인디케이터를 사용하면 더 이상 차트를 수동으로 전환할 필요가 없습니다. 모든 정보가 MT5 화면 내 하나의 패널에 표시됩니다. 작동 원리 캔들 패턴 인디케이터는 연속된 3개의 캔들로 형성된 패턴을 찾습니다. BUY(매수) 신호 캔들 색상 조건 1번째 캔들 (가장 오래된 캔들) 빨간색 반전의 기준 2번째 캔들 (중간 캔들) 초록색 1번째 캔들보다 더 낮은 저점 3번째 캔들 (가장 최근 캔들) 초록색 2번째 캔들보다 더 높은 고점 SELL(매도) 신호 캔들 색상 조건 1번째 캔들 (가장 오래된 캔들) 초록색 반전의 기준 2번째 캔들 (중간 캔들) 빨간색 1번째 캔들보다 더 높은 고점 3번째 캔들 (가장 최근 캔들) 빨간색
Passband Filter Pro Passband Filter Pro is a trend and cycle oscillator for MetaTrader 5. It is built on the Ehlers Super Passband Filter, a band pass filter that removes long term trend drift and short term noise so that only the dominant market cycle remains. The result is a clean oscillator with a color cloud that shows overbought and oversold conditions, cycle turns, and momentum on forex, gold, indices, stocks and crypto. Most traders enter too early or too late. Simple moving averages la
CvdDeltaVolumes
Parasbhai N Patel
Delta + CVD & CVD Candles Order-flow indicator combining Delta (Ask–Bid), Cumulative Volume Delta (CVD), and a unique CVD-based synthetic candle system. Shows buy/sell pressure, volume aggressiveness, and momentum shifts with optional Delta histogram, CVD line, and CVD+Delta combined candles. Useful for scalping, intraday trading, divergence detection, and understanding buyer/seller dominance. Overview The Delta + CVD & CVD Candles Indicator combines multiple order-flow tools into one clean
Donchian Breakout And Rsi
Mattia Impicciatore
4.5 (2)
개요 이 지표는 클래식 돈치안 채널(Donchian Channel) 의 향상된 버전으로, 실전 트레이딩을 위한 다양한 기능이 추가되었습니다. 표준 세 개의 선(상단, 하단, 중앙선) 외에도 브레이크아웃 을 감지하여 차트에 화살표로 시각적으로 표시하며, 차트를 깔끔하게 보기 위해 현재 추세 방향의 반대 라인만 표시 합니다. 지표 기능: 시각적 신호 : 브레이크아웃 시 컬러 화살표 표시 자동 알림 : 팝업, 푸시 알림, 이메일 RSI 필터 : 시장의 상대 강도를 기반으로 신호 검증 사용자 맞춤 설정 : 색상, 선 두께, 화살표 코드, RSI 임계값 등 동작 원리 돈치안 채널은 다음을 계산합니다: 상단선 : 최근 N개의 종가 완료 캔들에서 가장 높은 고가 하단선 : 최근 N개의 종가 완료 캔들에서 가장 낮은 저가 중앙선 : 고가와 저가의 평균값 상방 브레이크아웃 은 종가가 상단선을 돌파할 때 발생하며, 하방 브레이크아웃 은 종가가 하단선 아래로 내려갈 때 발생합니다. 이 지표는: 세 개의
FREE
Phantom Edge SMC
Nattapon Chuekamhod
Phantom Edge SMC — The Ultimate Smart Money Indicator for MT5 Tired of manually drawing structures while trading SMC or ICT concepts? Let Phantom Edge SMC do the heavy lifting for you. Key Features Internal & Swing Structure: Automatically detects BOS and CHoCH across two structural levels. Order Blocks (OB): Identifies Internal and Swing OBs with automated mitigation tracking. Equal Highs / Lows: Highlights EQH / EQL to pinpoint Liquidity pools. Fair Value Gaps (FVG): Displays FVGs with
SPECIAL LAUNCH OFFER: $30 (1-Month Rent) Limited time offer to build our community and gather feedback! AmbM GOLD Institutional Scalper A high-precision M5 algorithm for XAUUSD (Gold) , engineered to trade exclusively at Institutional Liquidity Levels ($5/$10 psychological marks). PERFORMANCE DATA (BUY ONLY) • Win Rate: 87.09%. • Safe Growth: +$4,113 profit on $10k (13.75% Max Drawdown). • Extreme Stress Test: Successfully generated +$22,997 in a 5-year stress test (2020-2026), proving
Cris Levels
Cristian Juliano Bomm Reuter
5 (1)
Cris Levels é uma ferramenta visual de apoio à decisão para o MetaTrader 5 — não abre, fecha nem gerencia ordens sozinha. Ela organiza no gráfico as regiões de preço que mais importam pra sua análise, combinando módulos independentes num único indicador: • Suporte e Resistência inteligente : identifica automaticamente os topos e fundos mais relevantes, tanto na base diária (últimos N pregões) quanto na estrutura fractal do próprio gráfico. Um nível só é confirmado depois que o movimento oposto r
FREE
Caicai L&S Yield Histogram Important Notice: This indicator is an integral tool of the automated EA Caicai Long and Short Pair Trading . This indicator visually displays the percentage deviation (Yield %) of a pair's current spread relative to its own historical mean. It is an excellent tool for quickly visualizing the gross financial potential of a market distortion in Long & Short operations. Main Features: Percentage Visualization: Understand the size of the distortion in palpable percentage
Multi Timeframe Smc Bias Finder Trading in alignment with higher timeframe structure is one of the most consistently profitable habits a trader can build. The difficulty has always been execution: switching between timeframes, manually reading structure, and keeping track of whether the Daily, 4-Hour and 1-Hour are all pointing in the same direction before committing to a position. Multi Timeframe Smc Bias Finder resolves that entirely. Three tools in one indicator: A live multi-timeframe bias d
VWAP Daily
Anton Polkovnikov
Weighted average price indicator or VWAP. The well-known standard VWAP with the beginning of the day is added with the function of selecting the periodization. It can be calculated both every day and on other periods. Also the indicator allows to exclude the volume from the calculation, which will allow using it on the cryptocurrencies and forex. There is an alert for a VWAP price crossing. There are 1 and 2 standard deviation. Settings: Volume: turning volume on and off in the calculation mecha
이 제품의 구매자들이 또한 구매함
Trend Sniper X
Sarvarbek Abduvoxobov
4.9 (42)
Trend Sniper X 는 트레이더가 추세 방향과 잠재적 반전 지점을 명확하고 정확하게 포착할 수 있도록 도와주는 MetaTrader 5용 멀티 타임프레임 추세 추종 지표입니다. MT4용: https://www.mql5.com/en/market/product/193245 가격 정보: 현재 가격은 프로모션 할인가이며, 향후 업데이트 및 새로운 기능이 출시됨에 따라 변동될 수 있습니다. 보너스 혜택: 본 지표 전용 무료 자동매매 Assistant EA를 받으시려면 구매 후 작성자에게 메시지를 보내주시기 바랍니다. Code2Profit 채널 멀티 타임프레임 분석으로 시장을 마스터하세요! Trend Sniper X로 승률을 극대화하는 방법: 핵심 규칙 및 세션 팁 기술 사양 플랫폼 MetaTrader 5 지표 유형 멀티 타임프레임 추세 지표 운용 타임프레임 모든 차트 타임프레임 지원, 독립적으로 선택 가능한 상위 타임프레임(M1–MN1) 주요 상품 외환, 금(XAUUSD) 및 기타 C
Smart Trend Trading System — MetaTrader 5 구매 후 MQL5에서 저에게 메시지를 보내시면 Smart Universal Expert Advisor를 무료로 받으실 수 있으며, 온라인 강좌, PDF 매뉴얼 및 비공개 그룹 이용 권한도 함께 제공됩니다. STTS는 추세 방향, 진입·청산 신호, 반전 구간, 주요 가격 수준을 차트에 모아 보여줍니다. 시스템을 참고해 수동으로 거래하거나, 별도의 호환 EA를 연결하여 선택한 설정에 따라 자동으로 거래를 실행할 수 있습니다. 하나의 시스템, 네 가지 트레이딩 접근법 STTS의 트레이딩 접근법은 크게 네 가지로 나뉩니다. • 스캘핑 — 단기 신호와 시장 움직임을 살펴봅니다. • 추세 매매 — 방향을 평가하고 추세 안에서 기회를 찾습니다. • 반전 매매 — 잠재적인 전환 구간과 방향 변화를 파악합니다. • 거래량 매매 — 거래량 기반 정보로 시장 활동을 평가합니다. 진입·청산 화살표, 추세 정보, 지지·저항 수
Zoryk Gold
Reda El Koutbane
4.76 (17)
ZORYK — MetaTrader 5용 XAUUSD 전문 신호 및 트레이드 플래닝 시스템 이런 경험이 있을 것입니다. 골드를 분석하고 진입을 기다린 뒤 마침내 포지션을 열었지만 가격이 곧바로 반대 방향으로 움직입니다. 너무 일찍 청산하거나 Stop Loss를 옮기거나 몇 초 동안 망설입니다. 그 후 시장은 내가 없이도 처음 예상했던 목표까지 정확히 움직입니다. 문제는 항상 방향이 아니었습니다. 진짜 문제는 불확실성이었습니다. 정확한 진입 위치를 몰랐습니다. 어느 지점에서 원래의 트레이드 아이디어가 무효가 되는지 몰랐습니다. 가까운 수익을 확보해야 할지 더 큰 움직임을 기다려야 할지 판단하기 어려웠습니다. 현재 setup이 정말 강한지 아니면 단지 새로운 거래를 억지로 찾고 있는지도 확신하기 어려웠습니다. 골드는 매우 빠르게 움직입니다. 명확한 계획이 없다면 좋은 분석도 몇 초 만에 나쁜 결정으로 바뀔 수 있습니다. ZORYK는 이 문제를 해결하기 위해 개발되었습니다.
SuperScalp Pro
Van Minh Nguyen
4.56 (36)
SuperScalp Pro - Professional Multi-Layer Confluence Scalping System SuperScalp Pro는 클래식 Supertrend에 여러 지능형 확인 필터를 추가한 고급 스캘핑 지표입니다. 더 높은 확률의 Buy/Sell 거래 기회를 식별하는 데 도움을 주며, 잘못된 신호를 크게 줄이는 데 도움을 줍니다. 명확한 Buy 및 Sell 화살표가 차트에 직접 표시되며, ATR 기반 Stop Loss 및 Take Profit 수준이 실시간으로 자동 계산됩니다. 구매 후 설정 방법 및 권장 구성에 대한 안내가 필요하시면 저에게 문의해 주세요. SuperScalp Pro Auto Trader를 사용하여 신호를 쉽게 자동화할 수 있습니다: [Auto Trader] 권장 설정 파일 다운로드: [Set File] 전체 문서는 제품 블로그에서 확인할 수 있습니다: [User Guide] 업데이트를 확인하려면 공식 채널에 참여하세요: [Official C
새로운 왕의 등장 - 인디케이터 + 주문 관리 표시(TP1 + TP2 + TP3) + 선택형 텔레그램 시그널 전송 기능 포함 (무료) (완전한 트레이딩 및 시그널 시스템) 골드를 위한 최고의 EA: Gold Slayer 이 인디케이터는 고급 전략, 사용자 지정 가능한 주문 관리 시스템, 그리고 엔벨로프 확장을 결합한 평균 회귀(mean reversion) 시스템을 포함하고 있습니다. 또한 RSI와 같은 여러 지능형 확인 필터를 통해 높은 확률의 반전 진입 구간을 포착하여 BUY 및 SELL 시그널을 제공합니다. 단순히 거래 방법만 배우는 것이 아니라, 여러 포지션을 효과적으로 관리하고 이전에 수익 중인 오픈 포지션으로 손실 거래를 커버하는 방법까지 익힐 수 있습니다. M5 전용으로 설계 및 최적화되었으며, 유동성이 풍부해 시그널이 더 깔끔하고 신뢰도 높은 BTCUSD와 XAUUSD에서 뛰어난 성능을 발휘합니다. 이 인디케이터는 ATR 기반으로 자동 계산된 진입가, 손절가, 익절가와
SMC Intraday Formula
VividMind Digital Solutions
5 (26)
먼저 솔직하게 말하겠습니다. 어떤 인디케이터도 단독으로 당신을 수익성 있게 만들어주지 않습니다. 누군가 그렇게 말한다면, 그는 당신에게 꿈을 파는 것입니다. 완벽한 매수/매도 화살표를 보여주는 모든 인디케이터는 완벽하게 보이도록 만들 수 있습니다 — 단지 올바른 과거 구간을 확대하고 승리한 거래만 캡처하면 됩니다. 우리는 그렇게 하지 않습니다.  SMC Intraday Formula는 도구입니다. 시장 구조를 읽고, 가장 높은 확률의 가격 구간을 표시하며, 현재 스마트 머니의 흐름이 어떻게 보이는지 아주 단순한 언어로 보여줍니다. 최종 결정은 여전히 당신이 합니다. 실행도 당신이 합니다. 하지만 이제는 희망이 아니라 정확성으로 거래하게 됩니다. 우리는 이 인디케이터를 지난 약 3년 동안 골드(XAUUSD) 및 주요 외환 통화쌍의 데이 트레이딩 스캘핑에 사용해 왔습니다. M1, M5, M15, M30에서 우리의 핵심 도구입니다. 이 도구는 미래를 예측하려 하지 않습니다 — 지금 형성
GoldenX Entry MT5
VividMind Digital Solutions
5 (16)
GoldenX Entry는 MT5용 인디케이터로, 적응형 Smart Entry Trend 알고리즘, 신호 스코어링 시스템, 시장 레짐 감지 기능, 그리고 변동성 필터를 포함합니다. 각 신호에는 계산된 진입 레벨, 3개의 익절(TP1, TP2, TP3) 레벨, 그리고 손절(Stop-Loss) 레벨이 포함됩니다. 이 인디케이터는 다양한 시장 환경에 적응하도록 설계된 다중 분석 레이어 구조 위에 구축되어 있으며, 내장 최적화기와 통계 추적 시스템을 결합합니다. 또한 Risk-to-Reward(RR) 지표와 과거 거래 행동 기반의 정량 분석을 제공합니다. 시작은 간단합니다 — 선택한 타임프레임에서 최적화기를 실행한 뒤 차트에서 바로 인디케이터를 사용하면 됩니다. 핵심 기능 GoldenX Entry는 하나의 차트에서 신호 엔진, 트레이드 관리 기능, 그리고 과거 통계 추적을 통합합니다: - 내장 최적화기: 최적화기는 차트에서 원클릭으로 실행됩니다. 200개의 파라미터 조합을 두 단계 탐색
Entry Points Pro for MT5
Yury Orlov
4.52 (151)
전설이 돌아왔습니다: Entry Points Pro 10. MQL5 마켓 Top-3 자리를 3년간 지켜온 전설적인 지표의 재출시입니다. 수백 개의 호평 리뷰(두 버전 합산 589개), 매일 이 지표로 거래하는 수천 명의 트레이더, 31,000회 이상의 데모 다운로드   MT4+MT5 . 지난 5년간 여러분이 남긴 리뷰를 하나도 빠짐없이 읽었고, 약속 대신 그 답을 버전 10에 담았습니다. 1999년부터 시장에서 활동하며 정직함과 자신의 평판, 그리고 고객을 소중히 여기는 개발자가 만들었습니다. Entry Points Pro의 진입 시그널은 절대 리페인팅되지 않습니다. 그리고 이번에는 개발자의 말뿐이 아니라 검증 가능한 사실입니다: 확정 시그널은 캔들 종가에서만 표시되며, 자동화 테스트에서 리페인팅 0건 이 확인되었습니다(EURUSD, XAUUSD, BTCUSD에서 2,486,568회의 불변조건 검사 — 위반 0건). 검증 방법은 공개되어 있으니 전략 테스터에서 직접 재현해 보실 수
Neuro Poseidon MT5
Daria Rezueva
4.75 (52)
Neuro Poseidon is a new indicator by Daria Rezueva. It combines precise trading signals with adaptive TP/SL levels - creating best possible trades as a result! Message me and get  Neuro Poseidon Assistant  as a gift to automize your trading process! What makes it stand out? 1. Proven profitability on all assets and timeframes 2. Only confirmed BUY and SELL signals present on the chart 3. Adaptive TP & SL levels generated by the software for each trade 4. Easy to understand - suitable for al
M5 Sniper
MeanFX
5 (3)
당신의 트레이딩 우위를 한눈에 확인하세요! M5 Sniper 는 MeanFX의 새로운 지표입니다. 정확한 트레이딩 신호 와 적응형 TP/SL 레벨 을 결합하여, 결과적으로 가능한 최고의 통계적 트레이딩을 만들어냅니다! 5회 구매마다 가격이 인상되며, 다음 가격은 69$입니다. 구매 후 저에게 메시지를 보내주시면 팁/가이드와 보너스 EA를 제공해 드립니다. 무엇이 이 지표를 특별하게 만들까요? Gold XAUUSD에서 검증된 통계적 성과 ( 거의 모든 자산에서 작동 하며, 일관된 결과 없이 모든 것을 다루려고 하기보다는 하나의 타임프레임을 완전히 익히는 데 집중합니다) 각 심볼당 하루 1~8회의 트레이드 와 높은 승률을 제공하며, 모든 통계적 우위를 우리의 편으로 가져갑니다. 차트에는 확인된 BUY 및 SELL 신호만 표시됩니다. 각 트레이드에 대해 지표가 생성하는 적응형 TP 및 SL 레벨 평균 승률 75%+ 평균 Signal Ratio 최소 1.1+ 알람 및 알림이 휴대폰 으로도
M1 Sniper MT5
Oleg Rodin
5 (7)
M1 SNIPER 는 사용하기 쉬운 거래 지표 시스템입니다. M1 시간대에 맞춰 설계된 화살표 지표입니다. 이 지표는 M1 시간대 스캘핑을 위한 단독 시스템으로 사용할 수 있으며, 기존 거래 시스템의 일부로도 사용할 수 있습니다. 이 거래 시스템은 M1 시간대 거래용으로 특별히 설계되었지만, 다른 시간대에도 사용할 수 있습니다. 원래는 XAUUSD와 BTCUSD 거래를 위해 이 방법을 설계했지만, 다른 시장 거래에도 유용하다는 것을 알게 되었습니다. 이 지표의 신호는 추세 방향과 반대로 거래될 수 있습니다. 저는 지표의 신호를 활용하여 양방향으로 거래할 수 있도록 돕는 특별한 거래 기법을 알려드립니다. 이 방법은 특별한 동적 지지선과 저항선 가격 영역을 활용하는 것을 기반으로 합니다. 구매하시면 M1 SNIPER 화살표 지표를 바로 다운로드하실 수 있습니다. 또한, 아래 스크린샷에 표시된 Apollo Dynamic SR 지표는 M1 SNIPER 도구를 사용하는 모든 사용자에게 무료로
Adaptive Price Action Engine 지표를 구매하면 EA(자동매매 프로그램)가 무료 멀티 타임프레임 기반 자기 최적화 추세 & 캔들 패턴 분석 시스템 시장은 끊임없이 변화하며, 모든 Price Action 패턴이 모든 시장 환경에서 동일한 가치를 가지는 것은 아닙니다. Adaptive Price Action Engine 은 변화하는 시장 환경에 적응할 수 있도록 설계되었으며, 추세 구조, 멀티 타임프레임 분석, 캔들 패턴 및 통계적 최적화 를 하나의 분석 프레임워크로 결합합니다. 두 가지 적응형 모드 Dual Alpha Trend Mode 낮은 타임프레임과 높은 타임프레임에서 적합한 Alpha Trend 파라미터를 자동으로 탐색하여, 최근 시장 움직임에 맞춰 추세 분석을 조정합니다. Candlestick + Alpha Mode Alpha Trend를 통한 시장 국면 분석과 22개의 상승 및 하락 캔들 패턴 을 결합합니다. 모든 패턴을 동일하게 취급하는 대신, 다양
ARIPoint
Temirlan Kdyrkhan
1 (4)
ARIPoint is a powerful trading companion designed to generate high-probability entry signals with dynamic TP/SL/DP levels based on volatility. Built-in performance tracking shows win/loss stats, PP1/PP2 hits, and success rates all updated live. Key Features: Buy/Sell signals with adaptive volatility bands Real-time TP/SL/DP levels based on ATR Built-in MA Filter with optional ATR/StdDev volatility Performance stats panel (Success, Profit/Loss, PP1/PP2) Alerts via popup, sound, push, or email Cu
Gann Made Easy MT5
Oleg Rodin
5 (11)
Gann Made Easy 는 mr.의 이론을 사용하여 최고의 거래 원칙을 기반으로 하는 전문적이고 사용하기 쉬운 Forex 거래 시스템입니다. W.D. 간. 이 표시기는 Stop Loss 및 Take Profit Levels를 포함하여 정확한 BUY 및 SELL 신호를 제공합니다. PUSH 알림을 사용하여 이동 중에도 거래할 수 있습니다. 구매 후 거래 방법 안내 및 유용한 추가 지표를 무료로 받으시려면 저에게 연락주세요! 아마도 Gann 거래 방법에 대해 이미 여러 번 들었을 것입니다. 일반적으로 Gann의 이론은 초보자 거래자뿐만 아니라 이미 거래 경험이 있는 사람들에게도 매우 복잡한 것입니다. Gann의 거래 방식은 이론적으로 적용하기 쉽지 않기 때문입니다. 나는 그 지식을 연마하고 Forex 지표에 최고의 원칙을 적용하기 위해 몇 년을 보냈습니다. 표시기는 적용하기가 매우 쉽습니다. 차트에 첨부하고 간단한 거래 권장 사항을 따르기만 하면 됩니다. 지표는 지속적으로 시장 분석
Scalper Vault MT5
Oleg Rodin
5 (1)
Scalper Vault는 당일 매매(intraday trading)에서 일관된 성과를 내고자 하는 트레이더를 위해 설계된, 강력하고 모든 기능을 갖춘 트레이딩 시스템입니다. 이 고정밀 지표는 외환(Forex) 및 바이너리 옵션 트레이더 모두에게 기관급 분석을 제공하는 독립적인 종합 트레이딩 시스템 역할을 합니다. 구매 후 저에게 연락해 주시면, 트레이딩 팁과 함께 특별한 보너스를 제공해 드립니다! Scalper Vault는 추측에 의존하거나 복잡한 수동 분석을 할 필요를 없애주며, 사용하기 쉬운 트레이딩 기법을 통해 오직 매매 실행에만 집중할 수 있도록 돕습니다. 정확한 추세 추종 신호: 핵심 알고리즘이 시장 구조를 분석하여, 지배적인 시장 추세 방향과 일치하는 고확률 신호만을 제공함으로써 잘못된 진입을 획기적으로 줄여줍니다. 정밀한 고점 및 저점 탐지: 시장의 움직임이 소진되는 지점을 스캔하여 잠재적인 반전 구간을 식별합니다. 간(Gann) 이론 기반의 매수/매도 구간: 수학적
Gold Trend Coach MT5
Cristhian Alexander Gaibor Cuasquer
5 (1)
Gold Trend Coach는 MetaTrader 5용 골드(XAUUSD) 추세 지표로, 매수 및 매도 신호, 손절과 세 개의 익절 목표를 봉 마감 시 확정하며, 멀티 타임프레임 코치 대시보드와 휴대폰 및 Telegram 알림을 제공합니다. 런던과 뉴욕 세션의 M5 스캘핑과 M15 데이트레이딩을 위해 만들어졌습니다. Gold Trend Coach: 진입, 손절, 세 개의 목표가 있는 XAUUSD 골드 추세 신호. 출시 가격 $39, 처음 20개 한정, 이후 $59. 구매 후 메시지를 주시면 구매자 키트를 바로 보내 드립니다. 최악의 연속 손실을 차트 위에 그대로 보여 주는 골드 지표. 이 마켓의 모든 XAUUSD 지표는 자신의 승리 신호를 보여 줍니다. Gold Trend Coach는 손실 신호도 보여 줍니다. 빨간색으로 세고, 최악의 연속 손실과 순결과를 보기 좋은 것만이 아니라 모든 것을 세는 패널에 표시합니다. 신호가 손절에 닿으면 보입니다. 세 번 연속 손절에 닿아도 보입
Auto Optimized SpeedAngle 은 지속적인 워크포워드 최적화(Walk-Forward Optimization, WFO)를 통해 곡선 적합(curve-fitting)을 제거한 기관 수준의 모멘텀 벡터화 시스템입니다. 시장 체제가 바뀔 때 성능이 떨어지는 정적 입력에 의존하는 대신, 이 지표는 표본 외(Out-of-Sample, OOS) 검증을 사용하여 매개변수를 동적으로 재보정하며, 표시되는 신호가 과거의 우연이 아닌 진정한 통계적 우위를 나타내도록 보장합니다. 핵심 기관용 프레임워크 워크포워드 최적화 엔진: 핵심 알고리즘은 수천 가지의 룩백(lookback) 및 임계값 조합을 지속적으로 스캔하며, 데이터를 인샘플(in-sample)과 표본 외(out-of-sample) 세트로 엄격하게 분리합니다. 미지의 데이터 환경에서 수학적 우수성이 증명된 경우에만 새로운 매개변수 구성을 채택합니다. 정량적 목적 함수: 순수한 총이익을 쫓는 대신, 최적화 엔진은 기관 수준의 안정성
Tokyo mt5 Indicator
Vasiliy Strukov
5 (10)
Tokyo Indicator는 추세 방향, 잠재적 거래 신호 및 시장 상황을 명확하고 시각적으로 보여줍니다. 색상으로 구분된 계단식 추세선은 강세 구간(파란색)과 약세 구간(자홍색)을 명확히 구별해 줍니다. 추세가 전환될 때 나타나는 방향성 화살표는 잠재적인 매수 및 매도 기회를 강조하여 보여줍니다. 통합 대시보드는 현재 신호, 시장 성향(bias), 모멘텀, 변동성, 신호 품질 등의 정보를 한눈에 파악할 수 있도록 구성되어 있습니다. 이를 통해 트레이더는 별도의 패널을 오갈 필요 없이 가격 움직임(price action)과 지표의 데이터를 동시에 분석할 수 있습니다. 깔끔한 차트 화면과 간결한 시장 개요를 제공하는 Tokyo Indicator는 체계적인 추세 분석과 거래 결정을 지원합니다. 모든 시간대와 다양한 자산(특히 금)에서 활용할 수 있습니다. 추세 방향, 잠재적 거래 신호 및 시장 상황을 명확하고 시각적으로 보여줍니다. 색상으로 구분된 계단식 추세선은 강세 구간(파란색)
Entry In The Zone and SMC Multi Timeframe is a real-time market analysis tool based on Smart Money Concepts (SMC), designed to analyze market structure, price direction, and key trading zones. It supports both Single-Timeframe and Multi-Timeframe Analysis, providing a clearer view of overall market structure across multiple timeframes, with real-time BUY / SELL signals designed with a strict focus on No-Repaint principles. The signals are designed to help filter unclear setups and evaluate tradi
Trend Catcher ind mt5
Ramil Minniakhmetov
5 (18)
트렌드 캐처 인디케이터 트렌드 캐처 인디케이터는 개발자가 자체 개발한 맞춤형 적응형 트렌드 분석 지표들을 조합하여 시장 가격 움직임을 분석합니다. 단기적인 노이즈를 제거하고 근본적인 모멘텀 강도, 변동성 확대, 가격 구조 움직임에 집중하여 진정한 시장 방향을 파악합니다. 또한 이동 평균, RSI, 변동성 필터와 같은 맞춤형 지표들을 활용하여 가격을 평활화하고 트렌드를 필터링합니다. 실제 운영 모니터링 및 기타 제품은 다음 링크에서 확인하실 수 있습니다:   https://www.mql5.com/en/users/mechanic/seller 텔레그램에서는 EA나 설정 파일을 판매하지 않습니다. 사기이니 주의하세요. 모든 설정 파일은 블로그에서 무료로 제공됩니다. 중요! 구매 후 즉시 연락 주시면 사용 방법 및 보너스를 드립니다!
안녕하세요, 트레이더 여러분! 많은 개인 투자자들이 느린 웹 스크립트에 의존하고 있습니다. 수익성 있는 거래를 위해서는 체계적인 프레임워크가 필수적입니다. Astro AI 지표는 단순한 차트 오버레이가 아닙니다. 터미널에서 직접 실행되는 두 개의 에이전트로 구성된 정교한 신경망입니다. 시스템 기술 상세 설명: 1. 에이전트 1: 분석가 (그래픽 신경망 – GNN) 시장은 개별 가격 막대로 이루어진 것이 아니라 상호 연결된 데이터 네트워크입니다. 기능: 에이전트 1은 그래픽 신경망을 사용하여 이러한 복잡하고 비선형적인 관계를 파악합니다. 장점: 기존 지표는 과거 이동 평균만을 고려하는 반면, 저희 GNN은 시장의 심층적인 구조적 관계를 실시간으로 처리하여 개별 트레이더의 거래량이 시장에 큰 영향을 미치기 전에 숨겨진 상관관계를 찾아냅니다. 2. 에이전트 2: 실행기 (근접 전략 최적화 – PPO) 패턴 인식은 절반의 성공일 뿐입니다. 현재 시장 변동에 기반하여 올바른
Divergence Bomber
Ihor Otkydach
4.89 (94)
이 지표를 구매하신 분께는 다음과 같은 혜택이 무료로 제공됩니다: 각 거래를 자동으로 관리하고, 손절/익절 수준을 설정하며, 전략 규칙에 따라 거래를 종료하는 전용 도우미 툴 "Bomber Utility" 다양한 자산에 맞게 지표를 설정할 수 있는 셋업 파일(Set Files) "최소 위험", "균형 잡힌 위험", "관망 전략" 모드로 설정 가능한 Bomber Utility의 셋업 파일 이 전략을 빠르게 설치, 설정, 시작할 수 있도록 돕는 단계별 영상 매뉴얼 주의: 위의 모든 보너스를 받기 위해서는 MQL5 개인 메시지 시스템을 통해 판매자에게 연락해 주세요. 독창적인 커스텀 지표인 “Divergence Bomber(다이버전스 봄버)”를 소개합니다. 이 지표는 MACD 다이버전스(괴리) 전략을 기반으로 한 올인원(All-in-One) 거래 시스템입니다. 이 기술 지표의 주요 목적은 가격과 MACD 지표 간의 다이버전스를 감지하고, **향후 가격이 어느 방향으로 움직일지를 알려주
PainX GainX Blue Spike Fusion AI Advanced Synthetic Index Spike Detection Indicator for MetaTrader 5 Discover potential spike setups with a clear, organized, and professional trading interface. PainX GainX Blue Spike Fusion AI is a specialized indicator designed for traders who monitor synthetic indices and want a structured way to observe potential price spike opportunities. The indicator combines signal monitoring, market-condition analysis, visual alerts, and event tracking in one convenient
Unix Scalper
Issam Kassas
4 (4)
Unix Scalper — MetaTrader 5 구매 후 MQL5에서 저에게 메시지를 보내시면 Smart Universal Expert Advisor를 무료로 받으실 수 있으며, 온라인 강좌, PDF 매뉴얼 및 비공개 그룹 이용 권한도 함께 제공됩니다. 매매 기회를 찾고, 거래 계획을 확인하고, 실행 방법을 선택하세요. UNIX Scalper는 시장 분석, BUY/SELL/WAIT 판단, Entry, Stop Loss, TP1 및 TP2 가격 수준을 하나의 정돈된 패널에 제공합니다. 신호와 거래 계획을 한눈에 • 명확한 판단: BUY, SELL 또는 WAIT. • 구체적인 가격 수준: Entry, Stop Loss, TP1 및 TP2. • 다중 시간대 개요: 패널의 여러 시간대 신호를 비교하세요. • 판단을 돕는 분석: 추세, 모멘텀, 거래량, 변동성, 지지와 저항, 시장 품질. • 다양한 레이아웃: Minimized, Compact, Standard 또는 Full. 신호와
Volatility Master for MetaTrader is a real-time dashboard tool that scans up to  50 symbols  to identify high-volatility , trending markets instantly. With bullish/bearish signals, customizable alerts, and a user-friendly interface, it helps you avoid range-bound conditions and focus on high-probability trades. Clarity leads to confidence. Trade confidently and protect your capital effectively with this powerful dashboard. We don't offer free or bonus indicators in exchange of reviews from you.
Atomic Analyst MT5
Issam Kassas
4.48 (62)
Atomic Analyst — MetaTrader 5 구매 후 MQL5에서 저에게 메시지를 보내시면 Smart Universal Expert Advisor를 무료로 받으실 수 있으며, 온라인 강좌, PDF 매뉴얼 및 비공개 그룹 이용 권한도 함께 제공됩니다. Atomic Analyst는 가격 움직임 분석, 추세 방향, 진입·청산 신호, 손절 수준, 여러 익절 수준을 차트에 모아 보여줍니다. 신호를 확인하고 매매 상황을 이해하세요 Atomic Analyst는 분석 결과를 명확한 시각 정보로 정리합니다. • 잠재적인 진입 기회를 확인할 수 있는 매수·매도 화살표. • 거래 계획에 도움이 되는 손절 수준과 여러 익절 수준. • 시장 방향을 평가할 수 있는 추세, 강도, 모멘텀 수치. • 더 넓은 시장 맥락을 비교할 수 있는 여러 시간대 분석. • 변화하는 시장 상황을 따라갈 수 있는 색상별 캔들과 알림. 신호와 보조 분석을 함께 검토한 다음, 해당 매매 상황이 자신의 거래 규칙에
Market Structure Order Block Dashboard MT5는 시장 구조와 주요 가격 반응 구역을 차트에서 직접 읽고자 하는 트레이더를 위해 설계된 MT5 지표입니다. BOS, ChoCH, 오더 블록, Fair Value Gap (FVG), 유동성, Kill Zones, Volume Profile 그리고 빠른 분석을 위한 콤팩트한 대시보드를 결합합니다. 이 지표는 시장 구조, ICT 및 Smart Money 개념을 의사결정 프레임워크로 사용하는 트레이더를 대상으로 합니다. 추세 지속, 가능한 반전, 가격 불균형, 유동성 타겟 및 관심 구역을 보다 체계적으로 식별하는 데 도움을 줄 수 있습니다. 구매자를 위한 포함 리소스 구매 후 MQL5 개인 메시지로 요청하시면 완전한 PDF 사용 설명서와 파라미터 설정 팁을 제공해 드립니다. MQL5 개인 메시지를 통한 직접 기술 지원. 1.20 버전은 두 가지 주요 추가 기능을 제공합니다: Pending BOS / Pending
Break and Retest Hunter
Mohamed Hassan
5 (2)
Break and Retest Hunter is a powerful MetaTrader 5 indicator designed to automatically identify support and resistance levels, breakout structures, and potential retest opportunities in real time. Bonus Indicator: After purchasing Break and Retest Hunter , contact me to receive Trade Indicator Assistant EA completely free as a bonus utility. $65 for the next 10 copies . Next price is $120.  Combining adaptive market analysis, clear BUY/SELL signals, Fibonacci-based profit targets, and a premiu
FiboSniper Pro
Van Minh Nguyen
5 (3)
FiboSniper Pro – Multi-Filter Fibonacci System with Auto SL/TP and Control Panel FiboSniper Pro는 동적 Fibonacci Envelopes와 여러 확인 필터를 결합하여 선별된 Buy 및 Sell 신호를 생성하는 기술적 지표입니다. Fibonacci 레벨은 Moving Average와 ATR을 기반으로 계산된 후 ADX, EMA, RSI, ATR, Volume, Time 및 Candle 구조를 통해 필터링됩니다. 이 지표는 ATR 기반의 자동 Stop Loss 및 Take Profit 레벨을 차트에 직접 표시하며, 빠른 설정 조정을 위한 인터랙티브 Control Panel을 제공합니다. 구매 후 권장 설정 파일과 자세한 사용 방법을 받으려면 저에게 문의해 주세요. Auto Trader X를 사용하여 FiboSniper Pro 신호를 자동화할 수 있습니다: [Auto Trader X] User Guide 및 Se
Quantum TrendPulse
Bogdan Ion Puscasu
5 (26)
SuperTrend   ,   RSI   ,   Stochastic   의 힘을 하나의 포괄적인 지표로 결합하여 트레이딩 잠재력을 극대화하는 궁극의 트레이딩 도구   인 Quantum TrendPulse를   소개합니다. 정밀성과 효율성을 추구하는 트레이더를 위해 설계된 이 지표는 시장 추세, 모멘텀 변화, 최적의 진입 및 종료 지점을 자신 있게 식별하는 데 도움이 됩니다. 주요 특징: SuperTrend 통합:   주요 시장 추세를 쉽게 따라가고 수익성의 물결을 타세요. RSI 정밀도:   매수 과다 및 매도 과다 수준을 감지하여 시장 반전 시점을 파악하는 데 적합하며 SuperTrend 필터로 사용 가능 확률적 정확도:   변동성이 큰 시장에서 숨겨진 기회를 찾기 위해 확률적 진동   을 활용하고 SuperTrend의 필터로 사용 다중 시간대 분석:   M5부터 H1 또는 H4까지 다양한 시간대에 걸쳐 시장을 최신 상태로 유지하세요. 맞춤형 알림:   맞춤형 거래 조건이 충족되면
제작자의 제품 더 보기
Arcane Fibonacci Indicator Pro
Gabriel Alejandro Sanchez Lledo
Arcane Fibonacci Indicator v2.0  **The most intelligent Fibonacci tool on the MQL5 marketplace.**    Automatic swing detection · OTE zone · Smart Money Order Blocks · FVG alignment · Confluence scoring 0–100% · Non-repainting arrows · Professional dark dashboard WHY Arcane Fibonacci Indicator v2.0 IS DIFFERENT? Every other Fibonacci indicator draws lines and leaves you to figure out which levels matter. ** Arcane Fibonacci Indicator v2.0 tells you EXACTLY which levels to trade — and scores
Warlock Gold Liquidity Reaper Pro v4 — HEDGE FUND EDITION 은 XAUUSD(골드) M15 타임프레임 전용으로 설계된 기관급 엑스퍼트 어드바이저(EA)입니다. 전문 추세 추종 펀드와 동일한 원칙을 바탕으로 제작되었으며, 4개 타임프레임 추세 정렬 시스템과 ICT/SMC 프라이스 액션 컨플루언스(근거 결합)를 결합하여 일관되고 방향성 있는 수익 성장을 목표로 합니다. 핵심 철학 — 절대 추세에 반해서 매매하지 말 것 대부분의 골드 EA가 실패하는 이유는 H4, 일봉, 주봉의 거시 추세가 반대 방향을 가리키고 있음에도 불구하고 M15에서 ICT 셋업을 취하기 때문입니다. 골드는 2022~2024년 동안 중앙은행 수요와 지정학적 리스크로 인해 장기 강세장을 유지했습니다. 이 기간 동안 매도(Short)를 시도한 시스템은 지속적인 손실을 보았습니다. Gold Liquidity Reaper Pro v4 는 타협할 수 없는 규칙으로 이를 해결합니다.
Signal Liquidity Reaper Dashboard
Gabriel Alejandro Sanchez Lledo
Warlock Signal Liquidity Reaper Dashboard v1.2 는 MetaTrader 5 전용 전문가용 멀티 타임프레임 신호 지표입니다. 당사의 Gold Liquidity Reaper Pro EA 시리즈와 동일한 기관 매매 방법론을 기반으로 설계되었으며, 주간 매크로 추세부터 5분봉의 정밀한 진입점까지 시장의 전체적인 그림을 한눈에 파악할 수 있게 해줍니다. 한 문장 요약 6개의 타임프레임을 동시에 분석하여 각각 상승(BULLISH) , 하락(BEARISH) 또는 **중립(NEUTRAL)**으로 점수를 매기고, 충분한 조건이 충족되면 진입가, 손절가(SL), 익절가(TP)가 포함된 완전한 ICT 트레이드 셋업을 차트 위에 직접 생성합니다. 6개 타임프레임 편향(Bias) 패널 대시보드 상단에는 실시간으로 각 주요 타임프레임의 방향성 편향이 표시됩니다. W1 — 주봉 (최상위 매크로 편향): 기관의 방향성입니다. 주봉 EMA200 위 또는 아래에 가격이 위치함에
Magic Signals Indicator
Gabriel Alejandro Sanchez Lledo
Warlock Magic Signals — 멀티 타임프레임 신호 지표 v3.2 8개 타임프레임 고확률 신호 | 차트에 Entry + SL + 3×TP 자동 표시 Warlock Magic Signals 는 최고의 명확성, 정확성, 신뢰성을 추구하는 진지한 트레이더를 위해 개발된 전문급 멀티 타임프레임 신호 지표입니다. 동시에 8개의 타임프레임 (M1, M2, M5, M15, H1, H4, D1, W1)을 분석하며, 각 타임프레임에서 네 가지 핵심 기술적 조건을 평가합니다: EMA 50/200 정렬 → 트렌드 방향 판단 ADX(14) ≥ 기준값 → 트렌드 강도 확인 RSI(14) 반등 또는 반전 → 모멘텀 검증 볼린저 밴드 터치 → 변동성 기반 정밀 진입 타이밍 각 타임프레임마다 명확한 신호를 생성합니다: LONG (매수) | SHORT (매도) | NEUTRAL (중립) 그리고 강도 점수(0~4) 를 세련된 미니 진행 바 형태로 표시합니다. 전체 8개 타임프레임의 가중 합의
Owl Multi Symbol Dashboard
Gabriel Alejandro Sanchez Lledo
OwlElite Pro Multi-Symbol SMC Dashboard MT5 전문가용 스마트 머니 컨셉(SMC) 대시보드 + 리페인팅 없는 신호 제품 설명: OwlElite Pro는 기관급 컨플루언스(근거 중첩)를 깔끔하고 전문적인 인터페이스로 확인하고자 하는 전문 외환, 골드, 지수 트레이더를 위해 설계된 프리미엄 멀티 심볼 SMC(Smart Money Concepts) 대시보드입니다. 이 강력한 MT5 보조지표는 최대 30개의 종목과 9개의 타임프레임 을 실시간 스캔하며, **오더 블록(Order Blocks), 페어 밸류 갭(FVG), 구조 변화(BOS), 추세 전환(ChoCH), 유동성 확보(Liquidity Grabs)**와 같은 고급 SMC 도구를 결합했습니다. 여기에 하이킨 아시(Heiken Ashi), EMA 50/200, RSI 컨플루언스를 더해 높은 확률의 진입 타점을 제공합니다. 주요 특징 멀티 심볼 × 멀티 타임프레임 대시보드 — 주요 통화쌍(EURUSD, G
PropFirm Guardian Dashboard
Gabriel Alejandro Sanchez Lledo
PropFirm Guardian Dashboard MT5 프랍 펌 트레이더를 위한 궁극의 실시간 리스크 관리 솔루션 자금 지원 계좌를 안전하게 보호하고 모든 챌린지를 자신 있게 통과하세요. PropFirm Guardian Dashboard MT5 는 FTMO, The5ers, Funding Pips, MyForexFunds, SurgeTrader 등 주요 프랍 펌 트레이더를 위해 독점 설계된 가장 진보적이고 전문적인 모니터링 도구입니다. 더 이상 리스크를 짐작으로 판단하지 마세요. 일일 드로다운(Drawdown) 제한 위반에 대한 공포에서 벗어나 매 초당 당신의 정확한 계좌 상태를 확인하세요. 트레이더들이 이 도구에 열광하는 이유 완벽한 실시간 가시성: 우아한 디자인의 패널을 통해 계좌 건강 상태를 실시간으로 확인. 즉각적인 위험 알림: 프랍 펌의 규칙을 위반하기 전에 즉시 경고 알림 전송. 전문적인 디자인: 다크 파스텔 컬러와 하이엔드 미학을 적용한 세련된 외관. 완벽한 맞춤 설정
Fuzzy Trend Scanner
Gabriel Alejandro Sanchez Lledo
WARLOCK Trend Screener AI Fuzzy MT5 — 가장 진보된 멀티 심볼 AI 기반 트렌드 스캐너 시장 전체에서 높은 확률의 추세 거래를 단 몇 초 만에 찾아내세요 — 실제 AI 스타일의 확률 스코어링 시스템 탑재. WARLOCK Trend Screener AI Fuzzy MT5 는 남들보다 먼저 가장 강력한 추세를 포착하고자 하는 전문 트레이더를 위해 설계된 차세대 궁극의 트렌드 스캐너입니다. 더 이상 28개의 차트를 일일이 돌려볼 필요가 없습니다. 움직임의 강도를 짐작으로 판단하지 마세요. 퍼지 로직(Fuzzy Logic) + AI 컨플루언스(Confluence) 스코어링 이 적용된 우아한 대시보드 하나로 시장 전체를 한눈에 파악할 수 있습니다. 트레이더들이 WARLOCK Trend Screener AI Fuzzy로 바꾸는 이유 28개의 주요 종목 을 9개의 타임프레임에서 동시에 스캔합니다. 모든 셀에 **정확한 추세 확률 %(0-100%)**를 제공합니다.
Heiken Ashi SMC
Gabriel Alejandro Sanchez Lledo
WARLOCK Heiken Ashi SMC Elite MT5: 궁극의 하이킨 아시 (비재도색) + 스마트 머니 컨셉(SMC) 지표 마침내 리페인팅(재도색)이 전혀 없는 하이킨 아시와 강력한 스마트 머니 컨셉(SMC)이 결합되었습니다 — 이 모든 기능을 하나의 프리미엄 툴에 담았습니다. WARLOCK Heiken Ashi SMC Elite MT5 는 MQL5 마켓에서 가장 진보되고 깔끔한 비재도색 지표입니다. 하이킨 아시의 부드러운 추세 분석과 기관 수준의 SMC(오더 블록, 페어 밸류 갭, BOS/ChoCH)를 융합하여, 명확한 시각적 확인과 함께 높은 확률의 진입 타점을 제공합니다. 가짜 신호는 이제 끝입니다. 다시 그려지는 화살표도 없습니다. 오직 전문적이고 신뢰할 수 있는 트레이딩만 남습니다. 트레이더들이 열광하는 이유 100% 비재도색 신호: 화살표는 캔들이 마감될 때만 생성되며 절대 변하지 않습니다. 강력한 합류(Confluence): 하이킨 아시 + SMC + EMA +
Session Killer SMC
Gabriel Alejandro Sanchez Lledo
Warlock Session Killer SMC MT5 — 2026년 가장 강력한 세션 기반 스마트 머니 컨셉(SMC) 지표 가장 확률이 높은 킬존(Killzones)에서만 거래하십시오. 이곳이 바로 실제 기관의 자금이 시장을 움직이는 지점입니다. Warlock Session Killer SMC MT5 는 시간의 흐름을 완벽히 파악하는 궁극의 SMC 지표입니다. 아시아, 런던, 뉴욕 세션을 자동으로 감지하고, 강력한 킬존(세션 중첩 구간)을 강조하며, 오더 블록(Order Blocks), 페어 밸류 갭(FVG), BOS/ChoCH 및 유동성 확보(Liquidity Grabs)를 활용하여 리페인팅 없는(Non-repainting) 고확률 진입 신호를 제공합니다. 거래량이 적은 시간대에 "눈먼 거래"를 중단하십시오. 스마트 머니가 가장 활발하게 움직이는 시간대에 은행처럼 거래를 시작하십시오. 전문 트레이더들이 Warlock Session Killer SMC MT5를 선택하는 이유 3대
Owl Mtf Trend Dashboard
Gabriel Alejandro Sanchez Lledo
OWL MTF Trend Dashboard Multi-Timeframe Trend Strength Scanner with ADX + MA Alignment + Confluence Score Professional Edition v1.05 – Market Ready Professional Product Description (Ready for MQL5 Market) OWL MTF Trend Dashboard is a sleek, high-performance multi-timeframe trend analyzer that instantly shows you the true market direction across 9 timeframes (M1 to MN) for up to 5 symbols simultaneously . It combines three powerful trend confirmation tools in one beautiful dashboard: Triple MA Al
OWL Supply and Demand Detector
Gabriel Alejandro Sanchez Lledo
OWL Supply & Demand Detector v1.01 Simple & Complete User Guide What is it? The OWL Supply & Demand Detector is a MetaTrader 5 indicator that automatically finds Supply zones (selling areas) and Demand zones (buying areas) on the chart. It also shows how strong each zone is, whether it has been tested, and includes a clean dashboard with useful information. Main Features Automatically draws Supply and Demand zones Gives each zone a strength score from 1 to 5 stars () Shows if a zone is Fres
OWL Volume Profile Order FLow
Gabriel Alejandro Sanchez Lledo
OWL Volume Profile & Order Flow MT5 Indicator Professional Volume Profile with Real-Time Order Flow Analysis OWL Volume Profile & Order Flow is a powerful, clean, and highly customizable indicator for MetaTrader 5 that combines classic Volume Profile analysis with advanced Order Flow elements. It displays the Point of Control (POC) , Value Area High (VAH) , Value Area Low (VAL) , buy/sell volume delta , and imbalance detection directly on your chart. Designed for day traders, scalpers, and sw
OWL Volatility ATR Multi Simbol Dashboard
Gabriel Alejandro Sanchez Lledo
OWL Volatility & ATR Multi-Symbol Dashboard Unlock the Power of Market Volatility – Trade Smarter, Faster, and with Greater Confidence Introducing the OWL Volatility & ATR Multi-Symbol Dashboard — a professional-grade, all-in-one volatility analysis tool designed for serious Forex, Gold, and Indices traders on MetaTrader 5. In today's fast-moving markets, understanding true volatility is the key to better entries, smarter risk management, and higher-probability trades. This sleek, real-time d
OWL Trend Predictor PRO
Gabriel Alejandro Sanchez Lledo
OWL AI Trend Predictor PRO & Bias Score is a professional, non-repainting technical indicator for MetaTrader 5 that combines linear regression channels , multi-factor statistical scoring, and an AI-style bias engine to deliver a clear, real-time market bias and next-candle forecast. Designed for serious traders who want more than simple moving averages or oscillators, this tool fuses classical statistical analysis with modern multi-timeframe machine-learning-inspired scoring to help you identify
Arcane Adaptive Quantum Trend
Gabriel Alejandro Sanchez Lledo
ARCANE ADAPTIVE TREND QUANTUM — AATQ v1.6 The Most Sophisticated Adaptive Trend Intelligence System Ever Built for MetaTrader 5 "Not just an indicator. A complete autonomous trading intelligence engine that thinks, adapts, and scores every market condition in real time — then tells you exactly when and where to act." WHAT MAKES AATQ DIFFERENT FROM EVERYTHING ELSE ON THE MARKET Most indicators on MQL5 are wrappers around a single idea — a moving average crossover, an RSI threshold, a Bolling
Arcane Ict Multi Confluency Trade Engine
Gabriel Alejandro Sanchez Lledo
ARCANE PROFESSIONAL — ICT Multi-Confluency Trade Engine v2.0 The most sophisticated Smart Money Concepts indicator on the MQL5 marketplace. Built for traders who demand institutional-grade precision — not just signals, but the exact price level where banks place their orders. WHAT MAKES ARCANE DIFFERENT Most indicators tell you when to trade. ARCANE tells you where to place your order — down to the exact price, calculated from the same confluency framework used by institutional desks world

필터:
리뷰 없음
리뷰 답변