Smart Pullback Breakout Entry

DESCRIPTION:

Smart Pullback Breakout Entry — M15 Range Breakout with DiNapoli Targets

Detects consolidation ranges on M15 and triggers entry on breakout in the H1 trend direction. Includes DiNapoli Fibonacci take-profit targets and automatic exit on H1 reversal signal.

ENTRY LOGIC:

  1. Reads H1 trend and pullback status via GlobalVariables
  2. Detects price consolidation (ranging behavior for N bars)
  3. Confirms breakout with volume spike (configurable multiplier)
  4. Generates BUY signal on upward breakout in bullish trend
  5. Generates SELL signal on downward breakout in bearish trend
  6. Auto-exits when H1 sends reversal/exit signal

DINOPOLI FIBONACCI TARGETS: TP1 (1.0) — Swing range completion TP2 (1.272) — Standard extension TP3 (1.618) — Golden ratio extension SL placed below/above swing with ATR buffer.

CHART LINES: Entry (white solid), SL (red dotted), TP1 (green dashed), TP2 (gold dashed), TP3 (purple dashed). All labeled with name and exact price.

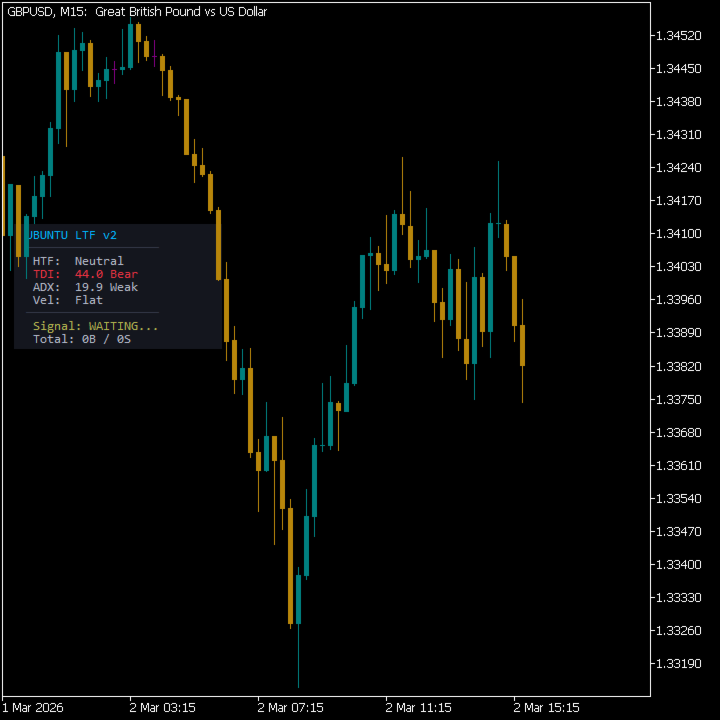
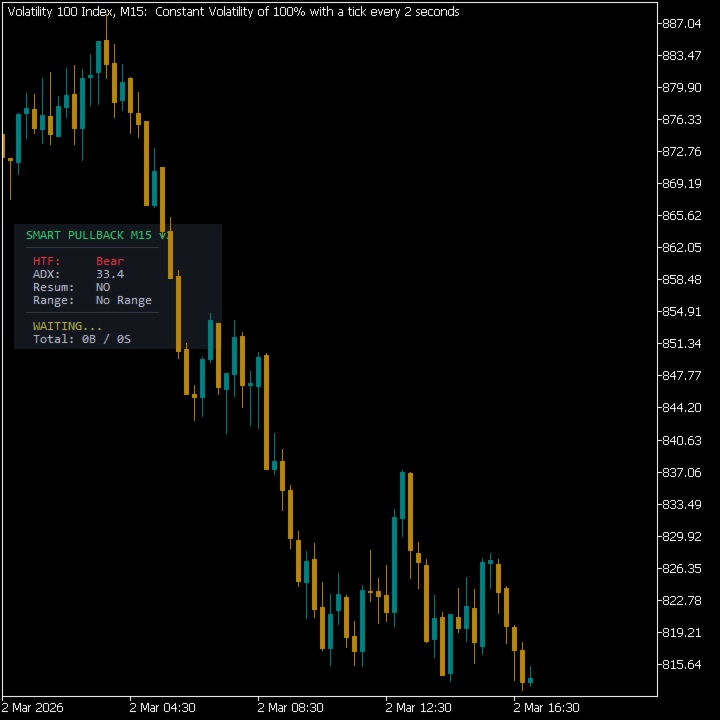
DASHBOARD: Shows HTF bias, ADX strength, resumption status, range detection, entry/SL/TP levels, and total buy/sell signal counts.

KEY SETTINGS: Ranging_Bars: Minimum bars of consolidation (default 5) Range_ATR_Multiplier: How tight range must be (default 1.5) Volume_Multiplier: Volume spike for breakout (default 1.2) SL_ATR_Buffer: Stop loss padding (default 0.5)

REQUIRES: Smart Pullback Detector on H1 (sold separately) for optimal results. Reads trend direction and exit signals from the H1 companion.

Non-repainting. All instruments. Push notifications included.


おすすめのプロダクト
Price Predictor Pro Turn Market Patterns into Predictable Profits! Are you tired of guessing where the market will go next? With Price Predictor Pro , you’ll trade with confidence by spotting powerful chart patterns and receiving precise price projections —directly on your MT5 chart. What Price Predictor Pro Does: ️ Detects high-probability chart patterns like Double Tops, Double Bottoms, Head & Shoulders, Flags, Pennants, and more . ️ Instantly projects the next price target using adv
FREE
MTF Levels And Moving Averages is a professional indicator designed to identify key support and resistance levels across multiple timeframes. The tool helps traders locate precise entry and exit points by analyzing market structure and price action patterns. Key Features The indicator provides multi-timeframe analysis covering H1, H4, D1, and W1 periods simultaneously. It identifies supply and demand zones where price typically reacts, using color-coded visualization to distinguish between dif
Title: SMC Structural Hub PRO The All-in-One Institutional Trading Station. 5 Elite Strategies Powered by Dawe Trading! Stop relying on single-logic robots that fail when market conditions shift.   SMC Structural Hub PRO , engineered by   Dawe Trading , is a professional-grade Expert Advisor designed to act as your complete execution workstation. It merges the surgical precision of   Smart Money Concepts (SMC)   with a high-confluence institutional engine, giving you the power of five distinct
INSTITUTIONAL STRUCTURE PRO Market Structure + Swings + Fair Value Gaps with SOR Priority Institutional Structure Pro is an advanced market structure indicator based on institutional analysis. The system automatically identifies: Structural highs and lows Structure breakouts (SOR – Structure Override / priority breakout) Bullish and bearish fair value gaps (FVG) Real inefficiency zones with precise rectangles All directly on the chart, with no delay and no repainting. What Does the
Pivot Scenario Dashboard is a compact trading indicator designed to display daily pivot-based market structure in a clean and professional dashboard. It automatically calculates the main pivot level, support and resistance zones, and scenario-based market bias for the current symbol. The indicator helps traders quickly identify: main pivot level bullish and bearish trigger areas support and resistance levels target projection levels current market scenario in a compact dashboard Main Features: D
N/B: All our product purchase comes with our free ‘’DAILY   SCALPER EA’’ -   bit.ly/4qlFLNh Whatsapp Developer for yours after successful purchase BOS / CHoCH Signals Scanner Indicator (MT5) See What Smart Money Is Doing — Before the Move Happens Most traders lose because they enter too late, trade against structure, or miss institutional confirmations. The BOS / CHoCH Signals Scanner Indicator was built to solve exactly that. This professional MT5 indicator automatically reads market struc
Bid Price Timer Indicator — 精密なタイミングとスマートな価格追跡! Bid Price Timer Indicator は、 時間・正確さ・明確さ を重視するトレーダーのために設計された、強力なトレードツールです。 主な特徴: 固定タイマー表示 – タイマーは常にチャートの 右側 に表示され、(X_Offset で位置調整可能)。 価格に連動した動き – タイマーは Bid価格 に合わせてリアルタイムで 上下に移動 。 自動再配置 – 価格が変化すると、タイマーは自動的に 新しい価格レベルに追従 。 オプションの水平ライン – 正確なBid価格レベル を視覚的に表示可能。 ️ リアルタイム更新 – タイマーは 毎秒更新 され、 次のローソク足までのカウントダウン を表示。完璧なエントリータイミングを逃しません! トレーダーが選ぶ理由: ローソク足のクローズを 高精度で予測 できる チャートを シンプル・モダン・分かりやすく 保てる スキャルピング、デイトレード、テクニカル分析 に最適 シンプルで洗練さ
N/B: All our product purchase comes with our free ‘’DAILY   SCALPER EA’’ -   bit.ly/4qlFLNh Whatsapp Developer for yours after successful purchase UNLEASH THE SPARTAN-ARROW SPIKE DETECTOR The Ultimate Boom & Crash Trading Weapon That Never Sleeps --- ️ THIS IS NOT JUST AN INDICATOR - IT'S YOUR PERSONAL 300 SPARTAN ARMY SPECIAL BONUS (VALID TILL JUNE 2026)- OUR DAILY SCALPER EA for BTCUSD and VIX75 •·································································•
Smart Money Structure & Precision Trading Indicator (MT5) Smart Money Structure & Precision Trading Indicator  is a powerful Smart Money Concepts (SMC) indicator for MetaTrader 5, designed to help traders identify high-probability entries with institutional logic . This indicator automatically detects market structure in real time , highlights key liquidity levels , and provides clear, non-repainting signals so you can trade with confidence and precision. Whether you are a scalper, day trader, o
==================================================================== SMT DIVERGENCE - NASDAQ vs S&P500 (NAS100 / US500) MQL5 Market Product Description ==================================================================== PRODUCT NAME: SMT Divergence Nasdaq vs S&P500 | Smart Money Index Scalper SHORT DESCRIPTION (max 63 chars): Spot Nasdaq reversals using SMT Divergence with S&P500 ---------------------------------------------------------------------- FULL DESCRIPTION ---------------------
Algo Octa - Indicateur d'Analyse Technique Avancé Indicateur professionnel combinant ZigZag, SAR parabolique, canaux de tendance et niveaux de Fibonacci pour une analyse technique complète.  if you don't understand how to use Technical Support via product feedback or MQL5 messaging system.  Fonctionnalités Principales Analyse Multi-Composants  ZigZag coloré avec détection automatique des extremums  Intégration du SAR parabolique pour la confirmation de tendance  Création automatique de canau
Liquidity Map  Overview The Liquidity Map indicator is an advanced visualization tool based on ICT Smart Money Concepts . It automatically identifies daily Buy Zones , Sell Zones , and Liquidity Levels , showing where price is likely to reverse or continue based on institutional order flow. It calculates key levels from the daily session — such as the previous day’s high, low, and midpoint — then derives a premium (sell bias) and discount (buy bias) structure. When price trades into these mapped
このインジケーターは、私たちが毎日最もよく使う戦略であるICTやSMCをはじめ、取引所の開閉時間に発生するストップロス制限や流動性制限、フィボナッチによる取引所の出来高やズームイン・アウト、見たい取引所の動きを選択してフィボナッチを引くなど、最もよく見たいアクションが全て自動で表示されるインジケーターです。このインジケーターを使用してあらゆる種類の取引を分析する方法を一度学べば、二度とこのインジケーターなしでは取引できなくなると 100% 確信しています。 このインジケーターは、私たちが毎日最もよく使う戦略であるICTやSMCをはじめ、取引所の開閉時間に発生するストップロス制限や流動性制限、フィボナッチによる取引所の出来高やズームイン・アウト、見たい取引所の動きを選択してフィボナッチを引くなど、最もよく見たいアクションが全て自動で表示されるインジケーターです。このインジケーターを使用してあらゆる種類の取引を分析する方法を一度学べば、二度とこのインジケーターなしでは取引できなくなると 100% 確信しています。
My Point MT5
Claudia Ramona Angerer
Diagnosis of major and minor pivot Trend detection with many signals Can be used in all symbols Can be used in all time frames Settings: Back Show: The number of candles it displays If you need any adjustments, or have any questions or suggestions, message me How to trade: Blue: sell signal Red: buy signal Blue and red at the same time: no signal Exit signal: Opposite signal
LR Pivots Combo Statistics That Show You Where the Market Stands! Key Features (updated V2.1) 1. Auto-Plotting Linear Regression Channel Trend Direction — Uses slope (normalized by ATR) to identify whether the market is in an uptrend, downtrend, or ranging sideways. Trend Quality (R-Squared) — Tells you if the trend is statistically consistent (Stable) or just noise (Volatile). Useful for filtering out unreliable setups. Standard Deviation Bands — Shows how far price has deviated from the regre
PriceActionToolKit - Professional ICT & Smart Money Concepts Indicator Transform Your Trading with Institutional-Grade Analysis PriceActionToolKit is a comprehensive indicator that brings the power of Inner Circle Trader (ICT) methodology and Smart Money Concepts directly to your MetaTrader 5 platform. This all-in-one solution eliminates the guesswork from your trading decisions by automatically identifying the key market structures that institutional traders use to move the markets. Why This
Timeframe Zoom, The Third Screen, is an Expert Advisor that operates using Heiken Ashi candlesticks on daily, hourly, and fifteen-minute timeframes, with the fifteen-minute timeframe triggering trades. It buys on days with blue candlesticks and sells on days with red candlesticks. It ensures that the potential trade is above or below a moving average on the hourly timeframe and uses the MACD and CCI indicators on the fifteen-minute timeframe to confirm the entry. It exits trades when the Heike
Hot Trend Zone
Tiofelo Da Olga Gilbert Teles
1. CONSTITUTION Hot Trend Zone is momentum indicator composed of one oscillator and its respective signal. The crossover between the oscillator and the signal generates the Bullish Trend Zone, Bearish Trend Zone, and Neutral Zone. 2. OPERATION As trend filter: bullish filter: if is bullish trending, search for bullish moves. bearish filter: if is bearish trending, search for bearish moves. As entry signal: When combined with a trend filter [preferably the Currency Strength Meter], it provides ve
このマルチタイムフレームとマルチシンボルインジケーターは、ダブルトップ/ボトム、ヘッド&ショルダー、ペナント/トライアングル、フラグパターンを識別します。ネックライン/トライアングル/旗竿のブレイクアウトが発生した場合にのみアラートを設定することもできます(ネックラインブレイクアウト=上下および頭と肩の確認された信号)。     インジケーターはシングルチャートモードでも使用できます。このオプションの詳細については、製品の     ブログ 。独自のルールとテクニックを組み合わせることで、このインジケーターを使用して、独自の強力なシステムを作成(または強化)できます。 特徴 マーケットウォッチウィンドウに表示されているすべてのシンボルを同時に監視できます。インジケーターを1つのチャートに適用し、市場全体を即座に監視します。 M1からMNまでのすべての時間枠を監視でき、パターンが識別されたとき、またはブレイクアウト時にリアルタイムのアラートを送信します。すべてのMetatraderネイティブアラートタイプがサポートされています。 RSIをトレンドフィルターとして使用して、潜在的な反転を適
/   ********** **********   ********** **********   ********** **********   ********** **********   ********** **********   / Big Sales for Easter! Price is reduced > 50 % already! Grasp the chance and Enjoy it!  /   ********** **********   ********** **********   ********** **********   ********** **********   ********** **********   / This is a powerful EA that support single order strategy, martingale strategy, multiple timeframes strategy, etc with lots of useful indicators and self defined
Session Volume Profile — Daily + Weekly Know where the volume is. Trade with the market, not against it. What It Does Session Volume Profile maps exactly where volume was traded across price — for the current day and optionally the full trading week. Updated in real time, directly on your chart. At a glance you can see where the market accepted price, where it rejected it, and where the key reference levels are for the session ahead. No repainting. No clutter. Just clean, actionable levels. Key
The indicator helps to enter a trade following the trend, at the same time, after some correction. It finds strong trending movements of a currency pair on a given number of bars, and also finds correction levels to this trend. If the trend is strong enough, and the correction becomes equal to the one specified in the parameters, then the indicator signals this. You can set different correction values, 38, 50 and 62 (Fibonacci levels) are better. In addition, you can set the minimum trend lengt
Chart Candle Timer Pro
Alireza Gholamreza Mohammadi
Chart Candle Timer Pro is a professional candle countdown panel for MetaTrader 5. It displays a compact, elegant dashboard on your chart that shows the time remaining until the next candle opens, along with essential market data at a glance. The panel updates every 200 milliseconds, ensuring a smooth and accurate countdown. It works on all standard timeframes from M1 to MN and adapts its time format automatically, showing HH:MM:SS for higher timeframes and MM:SS for shorter ones. User Guide
FREE
This EA is sessions trading robot that allows you to trade the trading session of yours choice as it waits for market markers to make decision for the direction of the day before taking any trades. It has 3 entry signals that uses candle stick patterns, Moving Averages and Range Break to maximize profits and to take advantage of the trending market. The EA practices risk management and has the ability to grow account by risking certain percentage of your account(risk percentage) each time there
Introducing Assembler:  The best value for money,  Designed for advanced traders and professionals, yet accessible for ambitious beginners ready to elevate their trading game. Great for ICT, SMC, TREND and breakout traders . Combining advanced analytics, a sleek graphical interface, and highly customizable features, Assembler empowers you to trade with precision, clarity, and confidence. Key Features of Assembler 1. Dynamic Graphical User Interface (GUI): A fully draggable, customizable interf
BreakoutMatrix Pro — 機関投資家レベルのブレイクアウトシステム BreakoutMatrix Pro は、市場のモメンタムを利用するように設計された、自動化された機関投資家レベルのブレイクアウト取引システムです。ゴールド (XAU/USD) 取引マシンとして高度に最適化されていますが、その普遍的なアーキテクチャにより、主要なすべてのシンボルに適応できます。 終わりのない最適化は忘れてください。コア戦略は、「ボラティリティ・スケール・ファクター (Volatility Scale Factor)」という単一のマスター入力に依存しています。 バックテストのハイライト (2025年1月 – 2026年3月) - XAUUSD 1H - スクリーンショット添付: $1,000 → ~$7,000 デフォルト設定 (ボラティリティファクター 1) — 最大ドローダウン: 9.5% — スムーズで一貫したエクイティカーブ。 $1,000 → ~$141,000 ボラティリティファクター 10 — 最大ドローダウン 28%。リアルティックデータ、変動スプレッド。 $1,0
Online Accounts Manager MT5
Kyra Nickaline Watson-gordon
5 (1)
OneClick Online Account Manager is a powerful utility that helps you to manage all your accounts from a centralized panel. It is suitable for all single account traders and specially for multiple accounts traders. The utility help you to : Monitor status of all accounts on a private web page. Some information such as account connection status, account profit, DD, Balance, Equity, Margin Level, Number of positions and orders, Daily and Weekly profit/loss and also overall summation of all these p
DYNAMIC SR TREND CHANNEL Dynamic SR Trend Channel is a simple indicator for trend detection as well as resistance/support levels on the current timeframe. It shows you areas where to expect possible change in trend direction and trend continuation. It works with any trading system (both price action and other trading system that use indicators) and is also very good for renko charting system as well. In an uptrend, the red line (main line) serves as the support and the blue line serves as the r
Advanced Market Pressure Indicator - Professional Trading Tool Stop Guessing. Start Trading with Precision. WHAT IT DOES This indicator reveals WHO controls the market - Buyers or Sellers - and predicts their next move using advanced algorithms. 5 Powerful Systems in ONE Indicator: Real-Time Pressure Analysis - Shows exact buyer/seller force (0-100%) Automatic Divergence Detection - Catches reversals BEFORE they happen AI Confidence Score (70-100%) - Filters out false signals automa
このプロダクトを購入した人は以下も購入しています
このインジケーターを購入された方には、以下の特典を 無料 で提供しています: 各トレードを自動で管理し、ストップロスとテイクプロフィットを設定し、戦略ルールに基づいてポジションを決済する補助ツール 「Bomber Utility」 様々な銘柄に合わせたインジケーターの設定ファイル(セットファイル) 「最小リスク」、「バランスリスク」、「待機戦略」 の3つのモードで使用できる Bomber Utility 用の設定ファイル このトレーディング戦略をすぐに導入・設定・開始できる ステップバイステップのビデオマニュアル ご注意: 上記の特典を受け取るには、MQL5のプライベートメッセージシステムを通じて販売者にご連絡ください。 オリジナルのカスタムインジケーター 「Divergence Bomber(ダイバージェンス・ボンバー)」 をご紹介します。これは、MACDのダイバージェンス(乖離)戦略に基づいた 「オールインワン」型のトレーディングシステム です。 このテクニカルインジケーターの主な目的は、価格とMACDインジケーターの間に発生するダイバージェンスを検出 し、将来の価格の動きを示す
Azimuth Pro
Ottaviano De Cicco
5 (6)
Azimuth Pro V2:MT5向けシンセティック・フラクタル構造分析と確認済みエントリー 概要 Azimuth Pro は Merkava Labs によるマルチレベルスイング構造インジケーターです。4つのネストされたスイングレイヤー、スイングアンカーVWAP、ABCパターン検出、3タイムフレーム構造フィルタリング、そして確定バーでの確認済みエントリー — 1つのチャートで、ミクロスイングからマクロサイクルまでを網羅するワークフロー。 これはブラインドシグナル製品ではありません。ロケーション、コンテキスト、タイミングを重視するトレーダーのための構造ファーストワークフローです。 V2発売記念オファー — Azimuth Pro V2をUSD 399で(次の100本)。最終価格:USD 499。 1. V2での変更点 シンセティック・マルチタイムフレームエンジン 上位タイムフレーム分析をMeridian Proと同じ独自のシンセティックアーキテクチャで一から再構築。よりクリーンなHTFコンテキスト、安定したライブ動作、従来のMTF同期問題なし。シンセティックエンジンは 固定比率タ
Quantum TrendPulse を ご紹介します。これは、   SuperTrend   、   RSI   、および Stochastic のパワーを 1 つの包括的なインジケーターに組み合わせて、取引の可能性を最大限に引き出す究極の取引ツールです。精度と効率を求めるトレーダー向けに設計されたこのインジケーターは、市場のトレンド、勢いの変化、最適なエントリー ポイントとエグジット ポイントを自信を持って特定するのに役立ちます。 主な特徴: SuperTrend 統合: 現在の市場動向に簡単に追従し、収益性の波に乗ることができます。 RSI精度: 買われすぎと売られすぎのレベルを検出し、市場の反転のタイミングに最適で、SuperTrendのフィルターとして使用されます。 確率的精度: 確率的振動を活用して、変動の激しい市場で隠れたチャンスを見つけます。SuperTrend のフィルターとして使用されます。 マルチタイムフレーム分析:   M5 から H1 または H4 まで、さまざまなタイムフレームで市場を常に把握します。 カスタマイズ可能なアラート: カスタム取引条件が満たされ
このインジケーターを購入すると、プロ仕様のトレードマネージャーを無料で差し上げます。 まず第一に、このトレーディングシステムがノンリペイント、ノンリドロー、ノンラグのインジケーターであることを強調する価値がある。これにより、手動取引とロボット取引の両方に理想的なものになっています。 オンラインコース、マニュアル、プリセットのダウンロード。 「スマートトレンドトレーディングシステム MT5」は、新規および経験豊富なトレーダー向けにカスタマイズされた包括的なトレーディングソリューションです。10以上のプレミアムインジケーターを組み合わせ、7つ以上の堅実なトレーディング戦略を備えており、多様な市場状況に対応する多目的な選択肢となっています。 トレンドフォロー戦略:トレンドを効果的に乗り越えるための正確なエントリーとストップロス管理を提供します。 リバーサル戦略:潜在的なトレンドの反転を特定し、トレーダーがレンジ相場を活用できるようにします。 スキャルピング戦略:高速で正確なデイトレードおよび短期取引のために設計されています。 安定性:すべてのインジケーターはノンリペイント、ノンリドロー、ノ
OmniSync Projection
Antonio-alin Teculescu
5 (1)
Chronos Fractal Engine is an innovative price projection indicator for MetaTrader 5, designed to transform your technical analysis by intelligently identifying and projecting historical price patterns. Built upon an advanced correlation algorithm and the fractal principles of the market, this powerful tool visualizes potential future price movements, giving you a unique edge in your trading decisions. What is Chronos Fractal Engine? At its core, the Chronos Fractal Engine employs a sophisticat
ご紹介     Quantum Breakout PRO は 、ブレイクアウト ゾーンの取引方法を変革する画期的な MQL5 インジケーターです。 13年以上の取引経験を持つ経験豊富なトレーダーのチームによって開発されました。     クォンタム ブレイクアウト プロ   は、革新的でダイナミックなブレイクアウト ゾーン戦略により、あなたのトレーディングの旅を新たな高みに押し上げるように設計されています。 クォンタム ブレイクアウト インジケーターは、5 つの利益ターゲット ゾーンを備えたブレイクアウト ゾーン上のシグナル矢印と、ブレイクアウト ボックスに基づいたストップロスの提案を提供します。 初心者トレーダーにもプロのトレーダーにも適しています。 量子EAチャネル:       ここをクリック 重要!購入後、インストールマニュアルを受け取るためにプライベートメッセージを送ってください。 推奨事項: 時間枠: M15 通貨ペア: GBPJPY、EURJPY、USDJPY、NZDUSD、XAUUSD アカウントの種類: ECN、Raw、またはスプレッドが非常に低い R
CGE Trading Suite
Carl Gustav Johan Ekstrom
5 (2)
Institutional-Grade Analytics for MT5 C GE Trading Suite delivers the analytical edge typically reserved for professional trading desks. The platform integrates a full suite of analytical tools into one seamless workflow: dynamic grid mapping, liquidity behavior analysis, ECM, trend lines, MIDAS, trade cycles, and directional channel projections. Together, these provide a unified view of market structure and momentum. Directional clarity is further enhanced by the capital flow index, which meas
Meridian Pro
Ottaviano De Cicco
5 (1)
Meridian Pro:MT5用プロフェッショナル・マルチタイムフレーム・トレンドマトリックス 概要 Meridian Pro は Merkava Labs が開発したマルチタイムフレーム・トレンドマトリックスで、方向性の状態、強度、モメンタムの状況、マトリックスの合意をひとつのコンパクトなパネルに集約します。ひとつのアダプティブエンジンがM1からW1まで一貫して適用されます。シンボルごとの調整は不要。インジケーターの積み重ねも不要。すべてのアセットとすべてのタイムフレームをカバーするひとつの構造化された読み取りです。 発売キャンペーン — Meridian Proを USD 99 (導入価格)で入手。通常価格:USD 149 。 1. Meridian Proが他と異なる理由 ひとつのエンジン、バラバラなインジケーターのダッシュボードではない 多くのMTFダッシュボードは、タイムフレームごとに生のインジケーター値を繰り返すだけです。Meridian Proはマトリックス全体でひとつのアダプティブ・トレンドエンジンを使用するため、パネルの各行が同じ構造化フレームワークから導出されます
優れたテクニカルインジケーター「Grabber」をご紹介します。これは、すぐに使える「オールインワン」トレーディング戦略として機能します。 ひとつのコードに、市場のテクニカル分析ツール、取引シグナル(矢印)、アラート機能、プッシュ通知が強力に統合されています。 このインジケーターを購入された方には、以下の特典を無料で提供します: Grabberユーティリティ:オープンポジションを自動で管理するツール ステップバイステップのビデオマニュアル:インジケーターのインストール、設定、取引方法を解説 カスタムセットファイル:インジケーターをすばやく自動設定し、最大限の成果を出すための設定ファイル 他の戦略はもう忘れてください!Grabberだけが、あなたを新たなトレードの高みへと導いてくれるのです。 Grabber戦略の主な特徴: 推奨タイムフレーム:M5〜H4 対応通貨ペア・資産:どれでも使用可能ですが、私が実際に検証した以下を推奨します(GBPUSD、GBPCAD、GBPCHF、AUDCAD、AUDUSD、AUDSGD、AUDCHF、NZDUSD、NZDCAD、EURCAD、EURUSD、E
BTMM State Engine Pro is a MetaTrader 5 indicator for traders who use the Beat The Market Maker approach: Asian session context, kill zone timing, level progression, peak formation detection, and a multi-pair scanner from a single chart. It combines cycle state logic with a built-in scanner dashboard so you do not need the same tool on many charts at once. What it does Draws the Asian session range; session times can follow broker server offset or be set in inputs. Tracks level progression (L
まず第一に、この取引インジケーターは再描画されず、再描画されず、遅延しないことを強調する価値があります。これにより、手動取引とロボット取引の両方に理想的なものになります。 ユーザーマニュアル:設定、入力、戦略。 アトミックアナリストは、価格の強さとモメンタムを利用して市場でより良いエッジを見つけるためのPA価格アクションインジケーターです。ノイズや誤ったシグナルを除去し、取引ポテンシャルを高めるための高度なフィルターを備えています。複雑なインジケーターの複数のレイヤーを使用して、アトミックアナリストはチャートをスキャンし、複雑な数学的計算をシンプルなシグナルと色に変換します。これにより、どのような初心者トレーダーでも理解して使用し、一貫した取引の決定を行うことができます。 「アトミックアナリスト」は、新規および経験豊富なトレーダー向けにカスタマイズされた包括的な取引ソリューションです。プレミアムインジケーターとトップノッチの機能を1つの取引戦略に組み合わせ、すべてのタイプのトレーダーにとって汎用性のある選択肢にします。 デイリートレーディングとスキャルピング戦略:高速で正確なデイ
RelicusRoad Pro: 定量的市場オペレーティングシステム 【期間限定】無制限アクセス 70% OFF - 2,000人超のトレーダーと共に なぜ多くのトレーダーは「完璧な」インジケーターを使っても失敗するのでしょうか? それは、文脈を無視して 単一の概念 だけでトレードしているからです。文脈のないシグナルは単なるギャンブルです。勝ち続けるには、 根拠の重なり(コンフルエンス) が必要です。 RelicusRoad Proは単なる矢印インジケーターではありません。完全な 定量的市場エコシステム です。独自のボラティリティモデリングを用いて、価格が推移する「適正価値の道(Fair Value Road)」をマッピングし、ノイズと真の構造的ブレイクを判別します。 推測はやめましょう。機関投資家レベルの「ロード・ロジック」でトレードを。 コアエンジン:「Road」アルゴリズム システムの中心となる Road Algo は、市場環境にリアルタイムで適応するダイナミックなボラティリティチャネルです。 安全ライン(平衡点) と、価格が数学的に反転しやすい 拡張レベル を投影します。 Si
ARICoin is a powerful trading companion designed to generate high-probability entry signals with dynamic TP/SL/DP levels based on volatility. Built-in performance tracking shows win/loss stats, PP1/PP2 hits, and success rates all updated live. Key Features: Buy/Sell signals with adaptive volatility bands Real-time TP/SL/DP levels based on ATR Built-in MA Filter with optional ATR/StdDev volatility Performance stats panel (Success, Profit/Loss, PP1/PP2) Alerts via popup, sound, push, or email Cust
ARIPoint is a powerful trading companion designed to generate high-probability entry signals with dynamic TP/SL/DP levels based on volatility. Built-in performance tracking shows win/loss stats, PP1/PP2 hits, and success rates all updated live. Key Features: Buy/Sell signals with adaptive volatility bands Real-time TP/SL/DP levels based on ATR Built-in MA Filter with optional ATR/StdDev volatility Performance stats panel (Success, Profit/Loss, PP1/PP2) Alerts via popup, sound, push, or email Cu
Was: $299  Now: $99  Supply Demand uses previous price action to identify potential imbalances between buyers and sellers. The key is to identify the better odds zones, not just the untouched ones. Blahtech Supply Demand indicator delivers functionality previously unavailable on any trading platform. This 4-in-1 indicator not only highlights the higher probability zones using a multi-criteria strength engine, but also combines it with multi-timeframe trend analysis, previously confirmed swings a
Master Editionは、ボリュームとマネーフローの視点を通じて市場構造を可視化するために設計されたプロフェッショナルグレードの分析ツールです。標準のボリュームインジケーターとは異なり、このツールはチャート上に日足ボリュームプロファイルを直接表示し、価格発見がどこで行われたか、そして「スマートマネー」がどこに位置しているかを正確に確認できます。 このMaster Editionは、明確さとスピードを考慮して設計されており、ロード時にチャートレイアウトを即座に美化するユニークな自動テーマ同期システムを備えています。 主な機能: 真のマネーフロー計算: 標準のティックボリュームを超えます。「Use Money Flow」を有効にすると、ボリュームは価格によって重み付けされ、特定の価格レベルでの実際の資本コミットメントが明らかになります。 バリューエリア (VA) の可視化: バリューエリア(デフォルトではボリュームの70%)を自動的に計算します。 VA Fill: コントロールゾーンを即座に識別するために、バリューエリアの背景をシェーディングします。 主要レベル: コントロールポイン
まず第一に、この取引ツールはノンリペイント、ノンリドロー、ノンラグの指標であり、プロの取引に理想的ですことを強調する価値があります。 オンラインコース、ユーザーマニュアル、デモ。 スマートプライスアクションコンセプトインジケーターは、新米から経験豊富なトレーダーまで、非常 に強力なツールです。Inner Circle Trader AnalysisやSmart Money Concepts Trading Strategiesなど、20以上の有用な指標を1つに組み合わせています。このインジケーターはスマートマネーコンセプトに焦点を当て、大手機関の取引方法を提供し、彼らの動きを予測するのに役立ちます。 特に、流動性分析に優れており、機関がどのように取引しているかを理解しやすくしています。市場のトレンドを予測し、価格の動きを慎重に分析するのに優れています。機関の戦略とトレードを合わせることで、市場の動向についてより正確な予測ができます。このインジケーターは多目的であり、市場構造を分析し、重要な注文ブロックを特定し、さまざまなパターンを認識するのに優れています。 このインジケーター
Gartley Hunter Multi - An indicator for searching for harmonic patterns simultaneously on dozens of trading instruments and on all possible timeframes. Manual (Be sure to read before purchasing) | Version for MT4 Advantages 1. Patterns: Gartley, Butterfly, Shark, Crab. Bat, Alternate Bat, Deep Crab, Cypher 2. Simultaneous search for patterns on dozens of trading instruments and on all possible timeframes 3. Search for patterns of all possible sizes. From the smallest to the largest 4. All fou
Bill Williams Advanced is designed for automatic chart analysis using Bill Williams' "Profitunity" system. The indicator analyzes four timeframes at once. Manual (Be sure to read before purchasing) Advantages 1. Analyzes the chart using Bill Williams' "Profitunity" system. Signals are displayed in a table in the corner of the screen and on the price chart. 2. Finds all known AO and AC signals, as well as zone signals. Equipped with a trend filter based on the Alligator. 3. Finds "Divergence Bar
TPA True Price Action indicator reveals the true price action of the market makers through 100% non-repainting signals strictly at the close of a candle! TPA shows entries and re-entries, every time the bulls are definitely stronger than the bears and vice versa. Not to confuse with red/green candles. The shift of power gets confirmed at the earliest stage and is ONE exit strategy of several. There are available now two free parts of the TPA User Guide for our customers. The first "The Basics"
トレンドラインは、外国為替取引におけるテクニカル分析の最も重要なツールです。残念ながら、ほとんどのトレーダーはそれらを正しく描画していません。自動トレンドラインインジケーターは、市場のトレンドの動きを視覚化するのに役立つ本格的なトレーダー向けのプロフェッショナルツールです。 トレンドラインには、強気トレンドラインと弱気トレンドラインの2種類があります。 上昇トレンドでは、外国為替トレンドラインは価格変動の最低スイングポイントを介して描画されます。 少なくとも2つの「最低安値」を接続すると、トレンドラインが作成されます。 下降トレンドでは、トレンドラインは価格変動の最も高いスイングポイントを介して描画されます。 少なくとも2つの「最高値」を接続すると、トレンドラインが作成されます。 トレンドラインが壊れたとき? 弱気のろうそくが強気のトレンドラインの下で閉じ、ろうそくの高さがトレンドラインの上にあるとき、強気のトレンドラインは壊れます。 強気のろうそくが弱気のトレンドラインの上で閉じ、ろうそくの安値がトレンドラインの下にあるとき、弱気のトレンドラインは壊れます。 トレ
このダッシュボードは、選択したシンボルの取引戦略に応じて、スキャルピングと長期モードの両方で、チャート上の需給ゾーンを発見し表示します。さらに、ダッシュボードのスキャナーモードは、一目ですべての希望のシンボルをチェックし、適切なポジションを見逃さないようにするのに役立ちます /  バージョンMT4 無料インディケータ:   Basic Supply Demand 特徴 複数の通貨ペアの取引機会を見ることができ、需給ゾーンの近さに応じてランク付けされた全ペアを明確かつ簡潔に表示します。 色から検出パラメータまで、特定のニーズに合わせてカスタマイズ可能な設定 主な入力 Indicator mode : 新機能を備えたインジケーター・モードまたはパネル・モードから選択。 Symbols :   "主要28通貨ペア "または "選択されたシンボル "から選択。 Selected Symbols :   カンマで区切られた監視したいシンボル (「EURUSD,GBPUSD,XAUUSD」)。お使いのブローカーがペアに接尾辞または接頭辞を付けている場合は、次の2つのパラメータ(ペア接頭辞または
このインジケーターは、反転ポイントと価格戻りゾーンを正確に表示します。     主要プレーヤー 。新たなトレンドが形成される場所を把握し、最大限の精度で意思決定を行い、すべての取引をコントロールします。 TREND LINES PRO インジケーターと組み合わせることで、その潜在能力を最大限に発揮します。 VERSION MT4 インジケーターが示す内容: 新しいトレンドの始まりに活性化する反転構造と反転レベル。 リスクと報酬の比率を最小限に抑えた利益 確定 と 損失停止の レベルの表示     RR 1:2   。 インテリジェントな削減ロジックによるストップロス。 指定されたインジケーターから 2 つのトレンド タイプの反転パターンを表示します。 指標: トレンドを追う   TREND LINES PRO   (世界的なトレンドの変化) TREND PRO   (クイックトレンド変更) シンプルで効果的   スキャナー   リアルタイムトレンド(新機能)。 マルチタイムフレームのインストゥルメント フィルタリング。 画面   利益     LOGIC AI信号の後。 当日プラス方
AriX
Temirlan Kdyrkhan
1 (4)
AriX Indicator for MT5 A powerful trend-following and signal-evaluation tool AriX is a custom MT5 indicator that combines Moving Averages and ATR-based risk/reward logic to generate clear buy/sell signals. It visualizes dynamic SL/TP levels, evaluates past trade outcomes, and displays win/loss statistics in a clean on-chart panel. Key features include: Buy/Sell signals based on MA crossovers ATR-based SL/TP1/TP2/TP3 levels with visual lines and labels Signal outcome tracking with real-time stat
現在33%オフ 初心者にもエキスパートトレーダーにも最適なソリューション このインジケーターは独自の機能と新しい公式を多数内蔵しており、ユニークで高品質かつ手頃な取引ツールです。このアップデートでは、2つの時間枠ゾーンを表示できるようになります。より長いTFだけでなく、チャートTFとより長いTF(ネストゾーンを表示)の両方を表示できます。すべてのSupply Demandトレーダーの皆さんのお気に召すはずです。:) 重要情報の公開 Advanced Supply Demandの可能性を最大化するには、 https://www.mql5.com/ja/blogs/post/720245 にアクセスしてください。   エントリーまたはターゲットの正確なトリガーポイントを正確に特定できれば取引がどのように改善されるか想像してみてください。新しい基盤となるアルゴリズムに基づいて構築されているため、買い手と売り手の間の潜在的な不均衡をさらに簡単に特定できます。これは、最も強い需要と供給のゾーンと、過去のパフォーマンス(古いゾーンを表示)がグラフィカルに表現されるためです。これらの機能は、最適な
Smart Structure Concepts MT5
Cristhian Alexander Gaibor Cuasquer
Smart Structure Concepts MT5 は MetaTrader 5 で最も完全な機関投資家向け SMC ツールキットです — 4言語の教育的ツールチップと、価格がゾーンに入った瞬間のライブプッシュアラートを備えています。 ほとんどの SMC インジケーターはボックスを描くだけで、あなたに推測を強いります。このインジケーターはチャート上で各シグナルを直接説明します。任意の BOS、CHoCH、Order Block、FVG、流動性レベルにマウスを合わせれば、その意味と次に何をすべきかが即座にわかります — 英語、スペイン語、ポルトガル語、フランス語で。 含まれる機能 — Internal & Swing BOS / CHoCH をリアルタイムで検出(リペイントなし) — Internal & Swing Order Blocks と自動ミティゲーション — 上昇・下降 Fair Value Gaps — Equal Highs & Lows(EQH / EQL)流動性マッピング — Premium / Discount / Equilibrium ゾーン —
マーケットメーカーのためのツール。 Meravith は次の機能を提供します: すべての時間足を分析し、現在有効なトレンドを表示します。 強気と弱気の出来高が等しくなる流動性ゾーン(出来高均衡)を強調表示します。 異なる時間足のすべての流動性レベルをチャート上に直接表示します。 テキスト形式の市場分析を生成し、参考情報として表示します。 現在のトレンドに基づいて目標値、サポートレベル、ストップロスを計算します。 取引のリスクリワード比を算出します。 口座残高に基づいてポジションサイズを計算し、潜在的な利益を推定します。 また、市場に大きな変化があった場合には警告を表示します。 インジケーターの主要ライン: 強気/弱気の出来高エグゾーストライン ― 目標値として機能します。 市場のトレンドを示すライン。市場が強気か弱気かによって色が変わり、トレンドのサポートとして機能します。主にその色が市場センチメントを示します。 出来高均衡ライン(Eq)。Eq(Volume Equilibrium)ラインはシステムの中核です。これは買い手と売り手の出来高のバランスポイントを表します。市場の流動性を示し
SignalTech MT5 is a trading system for EURUSD, USDCHF, USDJPY, AUDUSD, NZDUSD, EURJPY, AUDJPY, NZDJPY, CADJPY H2 and H3 Timeframe.  It can generate signals with Buy/Sell Arrows and Pop-Up/Sound Alerts. Each signal has clear Entry and Stop Loss levels, which should be automatically flagged on the chart, as well as potential Targets 1, 2, and 3. The Entry and TP levels are fixed after the trade is taken. The exit level is dynamic. If there are signs of a potential short-term trend reversal, the
Berma Bands
Muhammad Elbermawi
5 (8)
Berma Bands (BBs) インジケーターは、市場のトレンドを特定して活用したいトレーダーにとって貴重なツールです。価格と BBs の関係を分析することで、トレーダーは市場がトレンド段階にあるか、レンジ段階にあるかを判断できます。 詳細については、[ Berma Home Blog ] をご覧ください。 バーマ バンドは、上部バーマ バンド、中部バーマ バンド、下部バーマ バンドの 3 つの異なる線で構成されています。これらの線は価格の周りにプロットされ、全体的な傾向に対する価格の動きを視覚的に表します。これらのバンド間の距離から、ボラティリティや潜在的な傾向の反転についての洞察を得ることができます。 バーマ バンドの線がそれぞれ離れると、市場が横ばいまたはレンジ相場の期間に入っていることを示すことがよくあります。これは、明確な方向性の偏りがないことを示しています。トレーダーは、これらの期間中にトレンドを特定するのが難しいと感じる可能性があり、より明確なトレンドが出現するまで待つ場合があります。 バーマ バンドの線が 1 本の線に収束すると、強いトレンド環境の兆候となること
Omniview ICT Dashboard 機関投資家のフローを極める。相場を支配する。 「A+」のセットアップを見つけるには、**環境認識(Bias)、流動性(Liquidity)、そしてディスプレイスメント(Displacement)**の3つが必要です。多くのトレーダーが失敗するのは、単一の時間足のノイズに迷い込んだり、「偽」の値動きに惑わされたりするからです。 Omniview ICT Dashboard は、あなたの「機関投資家のレンズ」となります。市場全体をスキャンしてスマートマネー(Smart Money)がどこへ動いているかを特定するため、トレードを探し回るのをやめ、正確に執行することに集中できます。 ️ 重要:デモ版テスト前の注意点 MT5ストラテジーテスターの技術的な仕様により、デモ環境では「通貨ペア同時スキャン」機能を完全にプレビューすることができません。テスター内では、ダッシュボードはテスト中の単一の銘柄しか「見る」ことができないためです。 本来の機能を体験するには: ライブ口座またはデモ口座のチャート上でインジケーターを実行し、30以上の銘柄の同時スキャン
作者のその他のプロダクト
Market Pulse Scanner
Olurotimi Olugbenga Awolade
DESCRIPTION: Market Pulse Scanner — 6-Factor Directional Analysis Dashboard Know the market direction in 2 seconds. This indicator scans 6 independent technical factors simultaneously and delivers one clear signal with confidence rating. THE 6 FACTORS: EMA Trend — Fast/slow crossover direction ADX Strength — Trending vs ranging detection RSI Momentum — Overbought/oversold filter MACD Direction — Histogram sign and crossover Volume — Current bar vs 10-bar average Price Action — Bullish/bearish ca
DESCRIPTION: Position Size Calculator — On-Chart Risk Management Tool Never risk too much on a single trade again. This calculator displays real-time position sizing for 3 risk levels simultaneously, calculated from your live account balance and current ATR-based stop loss distance. DISPLAYS 3 RISK SCENARIOS AT ONCE: Risk Level 1 (1%): Risk amount in dollars + Lot size Risk Level 2 (2%): Risk amount in dollars + Lot size Risk Level 3 (3%): Risk amount in dollars + Lot size All lot sizes are dyna
DESCRIPTION: Dragon Trend Analyzer — Professional 10-Component Scoring Engine The most thorough trend analysis system for MetaTrader 5. Dragon Trend evaluates 10 independent market components and generates a quality score from 0 to 100, giving you objective trend strength that removes guesswork from your analysis. THE 10 COMPONENTS: EMA Crossover — Fast/slow moving average alignment ADX Strength — Directional movement intensity RSI Filter — Momentum confirmation without extremes MACD Momentum —
Dragon Entry System
Olurotimi Olugbenga Awolade
DESCRIPTION: Dragon Entry System — 5 Quality Gates + DiNapoli Fibonacci Targets This entry indicator does not signal until 5 independent quality gates confirm the setup is valid. Combined with DiNapoli Fibonacci take-profit targets, it provides precise entries with mathematically-calculated exit levels. THE 5 QUALITY GATES: Trending Market — ATR volatility confirms active trend Not Overbought/Oversold — RSI between 30-70 (room to move) Momentum Aligned — Price bars moving in trend direction Volu
DESCRIPTION: Ubuntu HTF Trend Analyzer — Multi-Factor Higher Timeframe System Professional H1 trend detection combining TDI analysis, market structure recognition, ADX strength measurement, and velocity scoring into one comprehensive dashboard. ANALYSIS COMPONENTS: TDI Signal: RSI + Bollinger Band crossover system for trend direction Market Structure: Automatic CHoCH (Change of Character) and BOS (Break of Structure) detection with Higher Highs/Higher Lows and Lower Highs/Lower Lows tracking ADX
DESCRIPTION: Smart Pullback Detector — H1 Fibonacci Retracement System Automatically detects trend pullbacks to Fibonacci retracement levels and signals when price enters the Golden Zone (38.2% to 61.8%). Tells you exactly when to switch to M15 for entry timing. DETECTION FLOW: Step 1: Identifies H1 trend direction using ZigZag swing structure Step 2: Calculates Fibonacci retracement levels (23.6%, 38.2%, 50%, 61.8%, 78.6%) Step 3: Detects when price pulls back into the Golden Zone Step 4: Waits
DESCRIPTION: Smart Pullback EMA Detector — Beginner-Friendly H1 Pullback System Simplified pullback detection using EMA bounces instead of Fibonacci retracements. Automatically switches between Conservative and Aggressive modes based on market conditions. Perfect for traders new to pullback strategies. HOW IT WORKS: Detects H1 trend using EMA crossover (20 and 50 period) Identifies when price pulls back to touch the moving average ADX confirms trend strength Auto-selects mode: CONSERVATIVE — Str
DESCRIPTION: Smart Pullback EMA Entry — M15 Breakout with Auto Mode Matching M15 entry system that auto-matches the H1 Conservative or Aggressive mode. Detects consolidation ranges and triggers on volume-confirmed breakouts with DiNapoli Fibonacci targets. MODE-DEPENDENT BEHAVIOR: CONSERVATIVE mode: Requires 6 bars of ranging (tighter filter) AGGRESSIVE mode: Requires 4 bars of ranging (faster signals) Mode is automatically set by the H1 EMA Detector. DINOPOLI FIBONACCI TARGETS: TP1 (1.0) | TP2
The DiNapoli Target Oscillator normalises price action within the Fibonacci swing structure, giving you a clear visual of where price sits relative to key Fibonacci levels at all times. Inspired by the DiNapoli trading method, this oscillator plots your position within the current swing and generates buy/sell signals precisely at pullback entry zones — with TP levels drawn automatically as horizontal dotted lines.   Why This Indicator? Unlike standard oscillators that react to price noise, th
Precision Entry v3
Olurotimi Olugbenga Awolade
Precision Entry v3 is a complete entry system that combines swing-based entry logic with automatic DiNapoli Fibonacci take profit levels. When a valid setup is detected, the indicator plots the entry arrow on the chart and instantly draws TP1 (1.0 extension), TP2 (1.272 extension), and TP3 (1.618 extension) levels — plus a calculated stop loss — giving you a full trade plan with one glance.   Why This Indicator? Most entry indicators tell you when to enter but leave you guessing where to exit. P
The Precision Reversal Engine is a sophisticated multi-confluence reversal detection system that combines five independent analytical modules into a single signal. A signal only fires when the required number of modules agree — making it one of the most reliable reversal indicators available for MetaTrader 5. It works on all instruments including forex, indices, gold, and synthetic indices.   Why This Indicator? Single-indicator reversal signals are notoriously unreliable. The Precision Reversal
フィルタ:
レビューなし
レビューに返信