ICT Universal Command Center

タイトル: ICT Universal Command Center

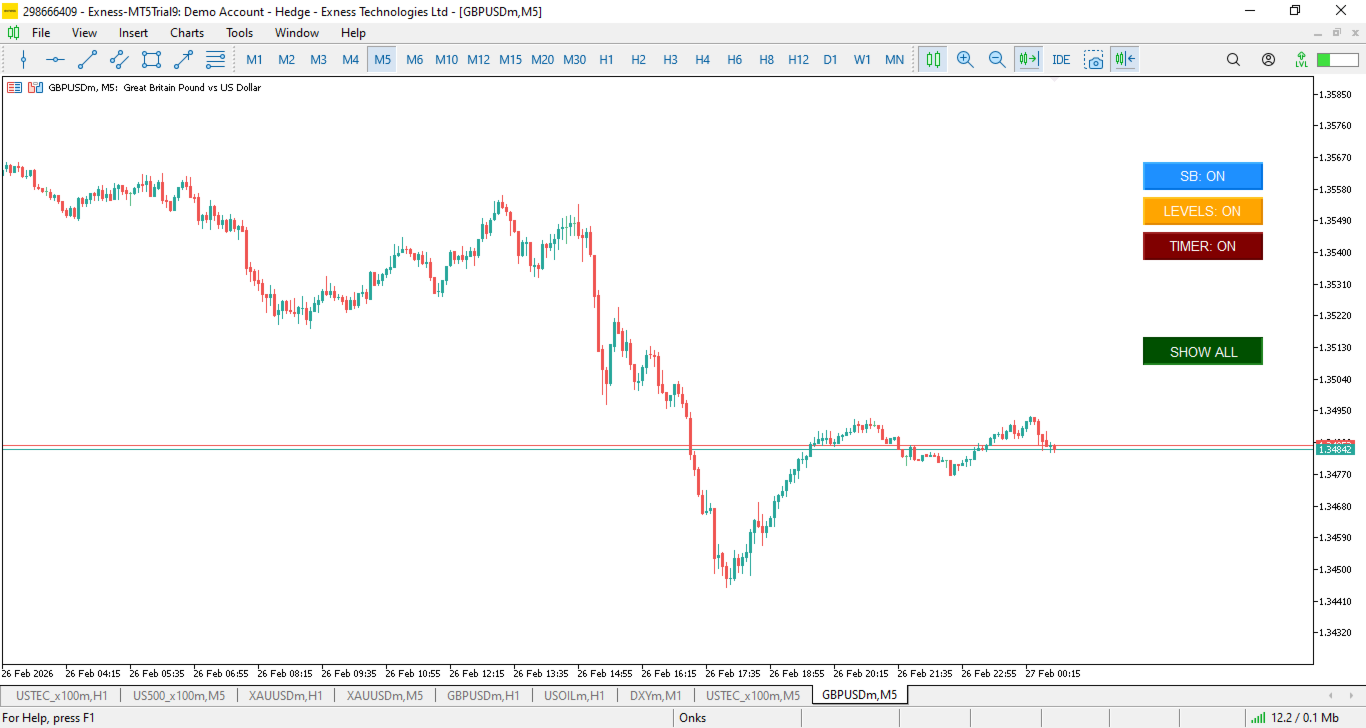
説明: ICT Universal Command Centerは、ICT(Institutional Order Flow)理論に基づいたプロフェッショナルなチャート管理ツールです。

主な機能:

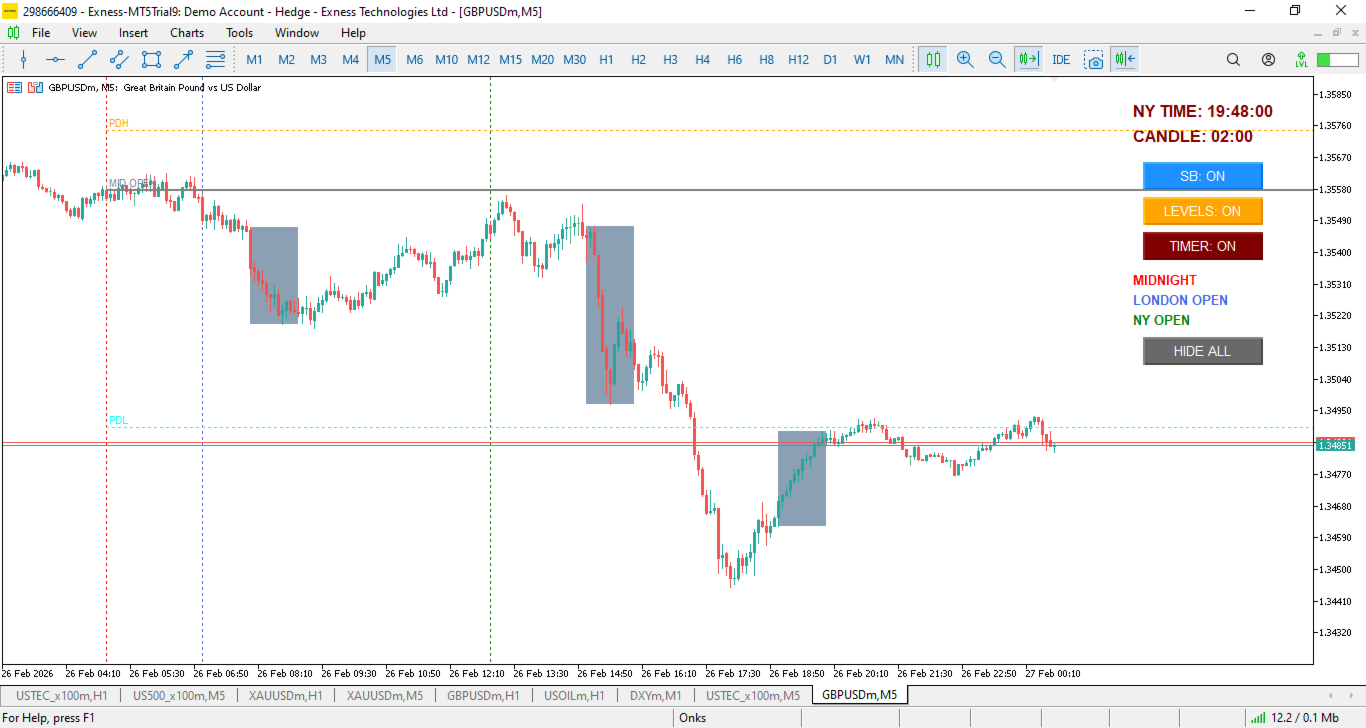
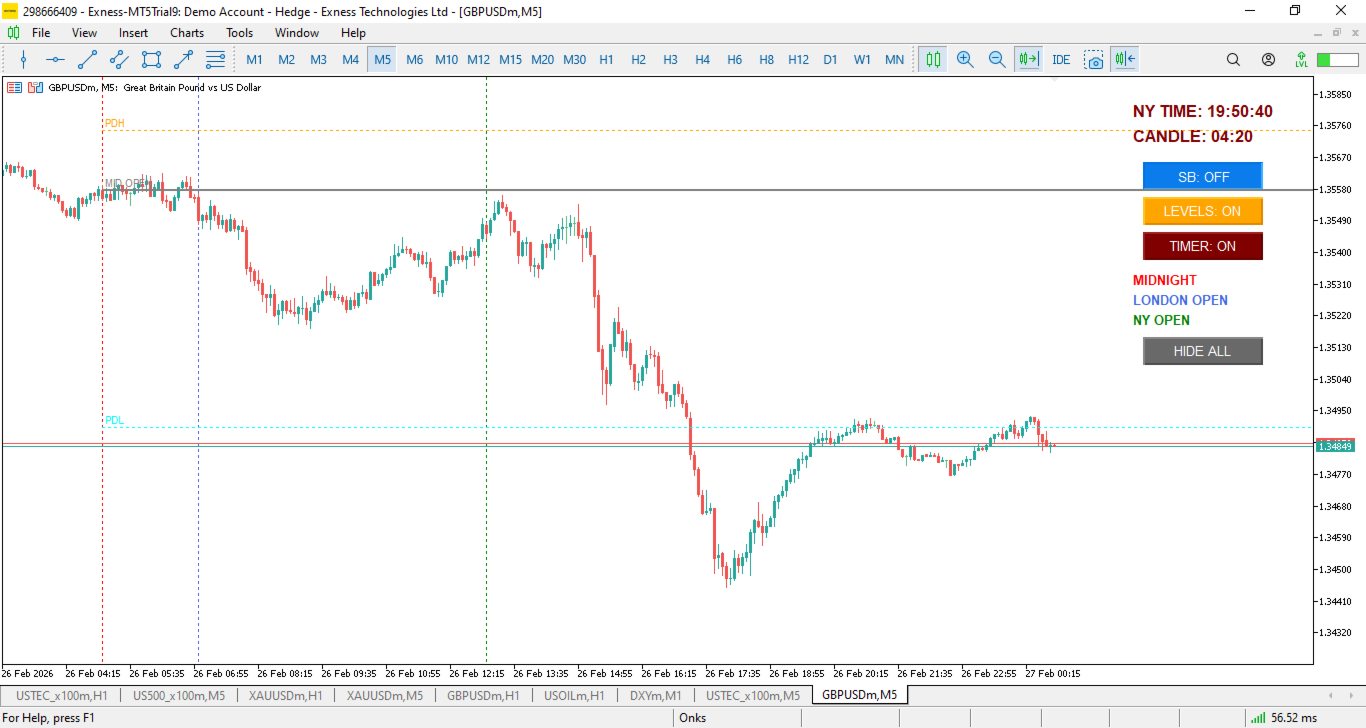
  • 自動シルバーブレレット: ロンドン時間、ニューヨーク午前・午後セッションを自動的にハイライトします。

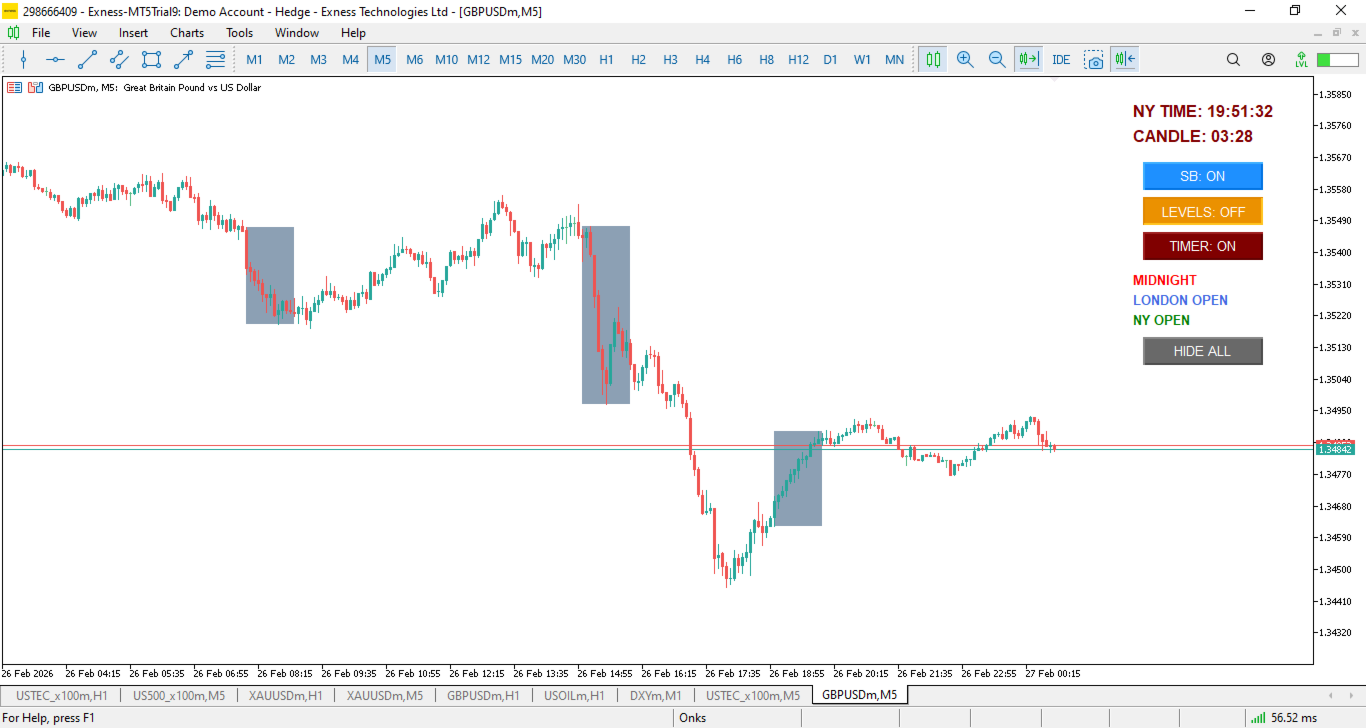
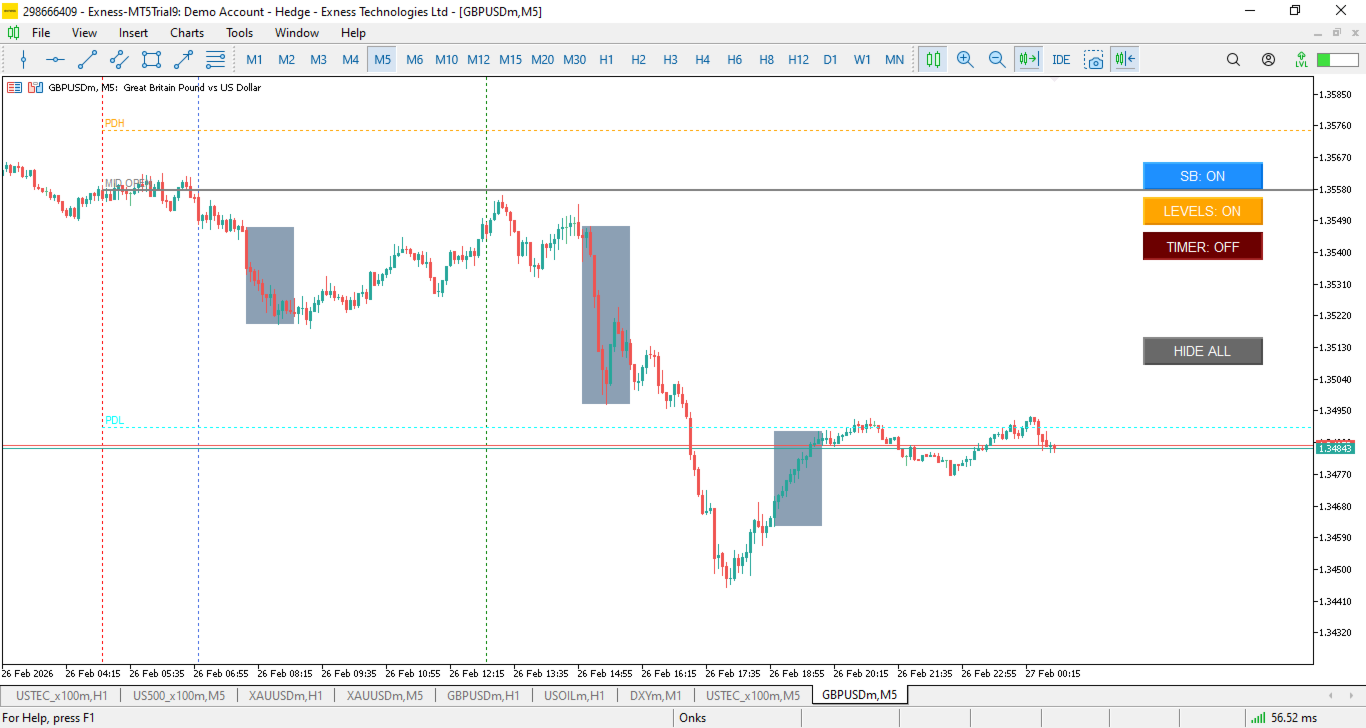
  • 機関投資家レベル: ミッドナイトオープン (00:00 EST)、前日高値 (PDH)、前日安値 (PDL) を自動描画。

  • インタラクティブパネル: チャート上のボタンで表示/非表示を即座に切り替え可能。

  • 「すべて非表示」ボタン: ワンクリックでインジケーターを消去し、純粋なプライスアクション分析が可能。

  • ニューヨーク時計: アルゴリズムと同期するためのリアルタイムEST時計を搭載。


おすすめのプロダクト
The Supply and Demand Zone Indicator is a powerful and easy-to-use tool designed to help traders identify critical supply and demand zones on the chart. These zones can provide valuable insight into potential market reversals, breakouts, and important price levels where buyers or sellers are likely to take control. The best   FREE Trade Manager . If you want to create your own Hedging or Grid strategies without any coding make sure to check out the   ManHedger Key Features: Automatic Zone Detect
FREE
Advanced Volume Profile Liquidity Analysis via Custom Area Selection The Advanced Manual Volume Profile is a precision tool for MetaTrader 5 designed to deconstruct market structure through price-level volume analysis. Unlike static profiles, this indicator exclusively processes the price and time range defined by the user via a rectangle object, offering a surgical view of the market auction. Elite Technical Specifications Dynamic Algorithm: Real-time calculation (400ms refresh rate) based on t
This Volume Delta Profile is an advanced MetaTrader 5 indicator that visualizes   volume delta (order flow imbalance)   using a volume profile-style histogram. It shows the difference between buying and selling pressure at specific price levels, helping traders identify supply and demand zones. This indicator provides a unique perspective on market dynamics by visualizing the imbalance between buying and selling pressure, offering insights beyond traditional volume analysis. Core Concept Positiv
The indicator calculates ZigZag using the classic algorithm with three parameters: Depth, Deviation, and Backstep. Its main function is detecting and visualizing repaints — moments when the last ZigZag point shifts to a new bar. Upon loading, the indicator performs a simulation over the specified history depth. The algorithm sequentially recalculates ZigZag for each bar, comparing the current position of the last point with the previous one. If a shift is detected, a repaint line appears on the
FREE
Intraday Session TPO: Precision Volume Profiling for Day Traders Stop trading blind during the most volatile hours of the day. Standard daily volume profiles blend everything together, masking the true areas of liquidity and institutional interest. The Intraday Session TPO is engineered specifically for session-to-session traders. It empowers you to isolate and profile specific time windows—like the London Open, the New York Killzone, or the Asian range—so you can see exactly where the volume is
Before installing the HeatMap indicator make sure you are using a broker that gives you access to the Depth of market (DOM) !! This indicator creates a heatmap on your chart allowing you to see the buy or sell limit orders easily and in real time. You have the possibility to change the setting and the colors of the HeatMap in order to adapt to all markets and all charts. Here is an example of a setting you can use with the NASDAQ100 on the AMPGlobal broker :  https://www.youtube.com/watch?v=x0Y
Advanced Volume Profile Analysis Tool for MetaTrader 5 The Kecia Volume Profile Order Finder provides traders with volume profile analysis capabilities. This MT5 indicator combines volume profile visualization with statistical calculations to help identify potential trading opportunities and suggests entry, stop loss, and take profit levels based on market structure. Market Profile Visualization Transform your chart with customizable volume profile visualizations: Multiple visualization options
インジケーター技術仕様 – Delta Profile for MetaTrader 5 Delta Profile は MetaTrader 5 用に開発されたインジケーターで、指定されたローソク足範囲内の出来高フローを詳細に分析するためのものです。異なる価格レベルにおける正の出来高(上昇に関連)と負の出来高(下降に関連)の不均衡を構造化し、可視化します。その結果、ユーザーは最も多くの取引が集中する価格帯や実際の市場不均衡が形成される領域を明確に把握できます。 以下に、本インジケーターの主要な技術特性と設定パラメータを示します。 基本コンセプト インジケーターは 価格レベル を識別し、それらを正の出来高、負の出来高、および純 Delta(正負の出来高差)に分類します。 各価格レベルは 水平バー としてチャートに表示され、市場の活動ゾーンや不均衡領域を視覚的に確認できます。 ユーザーは 分析対象ローソク足数 、 価格の丸め精度 、 最大表示レベル数 、および 表示スタイル を自由に設定できます。 主要機能 価格レベルのマッピング :設定された精度に基づき価格を丸め、対応するローソク足の
Was: $249  Now: $99   Market Profile defines a number of day types that can help the trader to determine market behaviour. A key feature is the Value Area, representing the range of price action where 70% of trading took place. Understanding the Value Area can give traders valuable insight into market direction and establish the higher odds trade. It is an excellent addition to any system you may be using. Inspired by Jim Dalton’s book “Mind Over Markets”, this indicator is designed to suit the
The "MR Volume Profile 5" indicator is a charting tool that displays trading volume at different price levels rather than time intervals. A key concept in volume profile is the point of control (POC)—the price level with the highest volume traded during the session or time range. While tools like VWAP or OBV provide volume trends, the "MR Volume Profile 5" indicator offers granular detail about where the most market activity occurs at specific price levels. This makes it a more precise tool for
Panther Trade Scenario — チャート上に明確なトレードシナリオを直接表示します。 このインジケーターは、トレードにおける最大の問題である「行動すべき瞬間の不確実性」を取り除きます。最適なタイミングを推測するのではなく、 どこでエントリーするか、どこでリスクを制限するか、どこで利益を確定するか を正確に把握できます。   なぜ多くのミスはエントリーで発生するのか 問題は市場を理解していないことではありません。多くの場合、状況はこうです:動きを見て方向を理解しているのに、エントリーの瞬間に迷いが生まれます。 今入るべきか、それとも待つべきか?早すぎないか?さらに下がったらどうする? 結果は同じです:早く入りすぎてストップにかかるか、待っているうちに市場が動いてしまうかのどちらかです。 そして最も悔しいのは——アイデア自体は正しく、間違いはエントリーだけだったという点です。 Panther Trade Scenarioでプロセスは明確になる チャートにシグナルが表示された時点で、推測の余地はなくなります。 このインジケーターは単に方向を示すだけではなく、   すでに
Martingale panel MT5
Mohammadbagher Ramezan Akbari
In this article, we would like to introduce the trade panel product with the Martingale panel. This panel is made in such a way that it can meet the needs of traders to a great extent. This trade panel actually consists of two trade panels at the same time, with the first one you can take positions with certain profit and loss limits, and with the second one, you can have positions with profit limits but without loss limits. When positions lose, a new position will be added based on the settings
Introducing PivotWave – your ultimate trading companion that redefines precision and market analysis. Designed with traders in mind, PivotWave is more than just an indicator; it’s a powerful tool that captures the pulse of the market, identifying key turning points and trends with pinpoint accuracy. PivotWave leverages advanced algorithms to provide clear visual signals for optimal entry and exit points, making it easier for traders to navigate volatile market conditions. Whether you are a begin
The Stop Loss Manger - SL Mange With the Stop Loss Manager you can finally sleep peacefully while it effectively manages your risk in stock market trading. Simply set your individual stop loss limits and let the manager trade for you. Never worry about losses again - the Stop Loss Manager takes care of it for you! Get the ultimate support for your trading now and maximize your profits with ease. Join the community of successful traders who swear by Stop Loss Manager today. Function overview: 1.
戦略ゾーン x3、x4、x5回タッチ    |   TP1/TP2/TP3 ポイント または 値   |   リスク/リワード比率の安全性を視覚的に確認 再描画なし、遅延なしのインジケーター - 手動とロボット取引に最適 - すべての資産とすべての時間枠に対応 期間限定オファー  その後 >> $99 に戻ります 購入後、 推奨およびカスタマイズ設定のためにお問い合わせください [ バージョン MT5  -  MT4  | 勝率を最大化する他の3つのツールを確認: TrendDECODER / PowerZONES / BladeSCALPER ] 概要 当社のインジケーターは初めて、チャート上で 3つの概念 を視覚的に結び付けます: 市場がテストするゾーン テイクプロフィットレベル サポートゾーン(ストップロス)とレジスタンスゾーン(テイクプロフィット)間のリスク/リワード比率 PowerZONES はあなたの取引ルーティンを変え、 衝動的な取引を止める のに役立ちます。 私たちは基本的なサポートとレジスタンスの概念に新機能を追加して革新しました: ゾーン:  ラインより
General Description In the simplest terms this is a contrarian intra-day scalping system. Built to try and let correct trades run as far as possible and flip the trade when indicated. The indicator looks at historical daily trading ranges to lay out levels at which it takes long and short positions based on the statistical levels. The indicator is built around index futures, mainly around S&P and the DOW but can be used an any futures contract mainly using AMP Futures to trade. The indicator is
First and foremost, the Insight Flow Indicator stands out as a Non-Repainting, Non-Redrawing, and Non-Lagging tool. This makes it a prime choice for both manual and algorithmic trading, ensuring reliable and consistent signals. User Manual: Settings, Inputs, and Strategy The Insight Flow Indicator leverages price action, strength, and momentum to provide a clear edge in the market. Equipped with advanced filters, it eliminates noise and false signals, enhancing trading potential. By using multip
Basic Support and Resistance   インジケータは、テクニカル分析を強化するために必要なソリューションです。このインジケータを使用すると、チャートにサポートレベルとレジスタンスレベルを投影できます/ mt4バージョン 機能 フィボナッチレベルの統合: サポートと抵抗レベルとともにフィボナッチレベルを表示するオプションを使用すると、私たちの指標は市場行動と逆転領域の可能性についてさらに深い洞察を提供します。 パフォーマンスの最適化: 各バーの開口部のみで拡張ラインを更新するオプションを使用すると、インジケータは、サポートレベルと抵抗レベルの精度を犠牲にすることなく最適なパフォーマンスを保証します。 入力 メイン設定 Timeframe:  この入力を通じて、より高い時間枠のサポートラインとレジスタンスラインをチャート上に表示することを選択できます。 Support/Resistance Strength [Number of Bars]:   この入力を使用して、サポートと抵抗の強度を決定できます。数が高いほど、サポート/抵抗がより強くなります。 Pric
追加の資料と説明書 インストールの説明 - 使用方法 - デモ口座用のアプリケーションの体験版 ファンド口座。一度のロット計算ミス。ドローダウン上限を突破。口座閉鎖。 戦略が悪かったのではない。執行の瞬間にリスクが管理されていなかったからだ。 Trade Command Center はビジュアル注文執行・リスク管理パネルです。 SL距離からロットを計算。ポジションを自動管理。ドローダウン上限をリアルタイム監視。 5タブ。1チャートパネル。DLLなし。外部接続なし。 正確な執行とプロップファーム準拠を必要とする裁量トレーダー向けに設計。 プロップファーム系ルールに対応した柔軟なRisk Guard設定。日次損失、週次損失、エクイティ・ドローダウン、フローティング損失に対応。 コア機能 ビジュアル・トレード・プランニング: チャート上でEntry、SL、TPボックスをドラッグ。ロット、ピップス距離、ドル金額、R:Rをリアルタイム表示。ワンクリック執行。 リスク計算: リスクモードを選択 — 残高比率、固定金額、固定ロット。パネルがポジションサイズを自動計算。 カスタムR:Rコントロ
SMC Venom Model BPR インジケーターは、スマート マネー (SMC) コンセプトで取引するトレーダー向けのプロフェッショナル ツールです。価格チャート上の 2 つの主要なパターンを自動的に識別します。 FVG   (フェアバリューギャップ) は、3 本のローソク足の組み合わせで、最初のローソク足と 3 番目のローソク足の間にギャップがあります。ボリュームサポートのないレベル間のゾーンを形成し、価格修正につながることがよくあります。 BPR   (バランス価格範囲) は、2 つの FVG パターンの組み合わせで、「ブリッジ」を形成します。これは、価格がボリュームアクティビティの少ない動きで動くときに、ブレイクアウトしてレベルに戻るゾーンで、ローソク足の間にギャップを作成します。 これらのパターンは、大規模な市場プレーヤーと一般参加者の相互作用が発生するチャート上のボリュームと価格動向の分析に基づいて、トレーダーが主要なサポート/レジスタンス レベル、ブレイクアウト ゾーン、エントリ ポイントを識別するのに役立ちます。 インジケーターは、長方形と矢印の形でパターンを視覚
Technical Analysis Dashboard Pro (TADashboard Pro) – 統一テクニカル分析システム TADashboard Pro は、複数のテクニカル指標と時間枠(タイムフレーム)を単一のビジュアルインターフェースに統合した、高度なテクニカル分析パネルです。 正確性 と 効率性 を求めるトレーダー向けに設計されており、本システムは 8つの異なる時間枠 にわたる 7つのオシレーター と 4つの移動平均線 を同時に分析し、意思決定を簡素化する正規化されたスコアを生成します。 主な特徴 (主なとくちょう): マルチタイムフレーム分析 (Multi-Timeframe Analysis): 統合されたビジュアルセレクターにより、M1、M5、M15、M30、H1、H4、D1、W1の各期間を簡単に監視できます。 高度なスコアリングシステム (Advanced Scoring System): オシレーター、移動平均線、および総合評価の独立したスコア( $-100$ から$+100$まで)。 搭載インジケーター (Included Indicators): RSI
FREE
Easy Trading Panel: Core Function Summary 1. Visual Trading This is the core selling point of the tool. It abandons the traditional way of placing orders by inputting prices and adopts an intuitive chart line drag-and-drop mode instead: • Drag Entry Line: Directly drag the line on the chart to set the pending order position. • One-click SL/TP Toggle: Quickly enable/disable stop loss and take profit lines via panel buttons. • Synchronous Calculation: When the lines are dragged, the panel will cal
Helios Pulse v1.03 — リアルタイム確率ダッシュボード|裁量トレーダー向け Helios Pulseは、マーケットの読み方を根本から変えます。複数のインジケーターウィンドウを切り替えながら矛盾するシグナルを解読する必要はもうありません。ひとつの明確な答え——現在のマーケットの方向性バイアスを示すリアルタイム確率パーセンテージが、ティックごとに連続更新されます。 これは単なるシグナル矢印パネルではありません。Helios Pulseは、複数のテクニカル分析次元の一致度を測定し、本当に信頼できる確信度スコアを算出する確率エンジンです。方向だけでなく、その方向がどれほど確かなのか——そしてそれがリアルタイムで強まっているのか弱まっているのかを見ることができます。 チャート上の表示 コンパクトなダークテーマのパネルがチャート上に配置され、ロングとショートの2つのダイナミック確率カードが表示されます。マーケット状況の変化に応じて、カードの色の強度が淡色から鮮明に変化し、数値を確認する前に瞬時に視覚的な判断が得られます。明確な判定ラベルが現在の状態を表示します:Strong Bu
FREE
Suggested Name: TPO & Institutional Levels Pro Description: Elevate your market reading with TPO & Institutional Levels Pro B3 , the ultimate tool for Day Traders looking to trade alongside the smart money. Instead of cluttering your chart with multiple scattered indicators, we combined the most powerful institutional metrics into a single, clean, lightweight, and highly responsive interface for MetaTrader 5. Grounded in Auction Market Theory, this indicator reveals the true market structure. Ke
Here   our more valuable tools SMC Trend Trading   ,  Easy SMC Trading  ,  Institutional SMC Architect Volume Analysis Tools  ,  Volume flow Profile  ,  Market volume profile  , FVG with Volume  , Liquidity Heatmap Profile  ,  Volume Spread Analysis The Trading Guide MT5 Indicator is a powerful psychological trading assistant designed to keep traders disciplined, focused, and emotionally balanced. This innovative indicator displays real-time motivational messages, trading rules, and analysis
FREE
Max Min Delta Indicator - Market Volume Imbalance Analysis Gain Deeper Insights into Market Volume Imbalance with Delta Analysis What is the Max Min Delta Indicator? The Max Min Delta Indicator is a powerful market volume analysis tool that visually represents maximum and minimum delta values using a histogram. It helps traders identify market strength, weakness, absorption, and aggressive buying/selling activity with precision. Key Features Histogram Visualization: Displays Max Delta (Green) an
Hello, This is an easy symbol change panel. This is a full version of Symbol1 2Changer Symbols must be active on your Market Watch list. Parameters: SymbolList - you can add more symbols with a comma(,) ratio - change the size LineNumber - you can set that how many symbols are displayed per line. button_width - modify the button size button_height - modify the button size Thank you.
MT4 バージョン: https://www.mql5.com/ja/market/product/166784 MT5 バージョン: https://www.mql5.com/ja/market/product/166785 流動性プロファイル 流動性プロファイルは、動的なヒートマップ形式のプロファイルを用いて、チャート上に潜在的な流動性ゾーンをマッピングする、視覚的な市場構造ツールです。 このインジケーターは、過去の価格変動とティックボリュームを分析し、流動性が集中している可能性のある価格帯を強調表示します。描画内容は以下のとおりです。 流動性ライン(潜在的な反応/スイープレベル) ヒートマッププロファイルボックス(流動性集中ゾーン) POC/最大流動性レベル(検出された最高集中度) この結果、トレーダーが以下の点を特定しやすくなる、分かりやすい視覚的なプロファイルが作成されます。 潜在的なマグネットレベル 可能性のあるスイープゾーン 現在の価格の上下の反応エリア エントリー、エグジット、リスク管理のコンテキスト 主な機能 動的な流動性ヒートマッププロファイル
Correlation Matrix Pro - マルチ通貨ヘッジスキャナー 通貨ペア間の相関関係をリアルタイムで把握! 最大6つの通貨ペア間の統計的関係を同時に可視化する強力な分析ツールです。ポートフォリオ管理、リスク分散、ヘッジ戦略に最適です。 主な機能 - 対数リターンを使用したリアルタイムピアソン相関 - 最大6通貨ペアを同時監視 - 自動タイムフレーム検出 - 調整可能な遡及期間(5-200本) - ヘッジ機会の自動検出 - ミニマルで折りたたみ可能なパネルデザイン - 即座に解釈できるカラーコード付きマトリックス カラーコード 緑 (+0.70 〜 +1.00) = 強い正の相関 薄緑 (+0.50 〜 +0.69) = 中程度の正の相関 グレー (-0.49 〜 +0.49) = 弱い/相関なし オレンジ (-0.50 〜 -0.69) = 中程度の負の相関 赤 (-0.70 〜 -1.00) = 強い負の相関(ヘッジ) なぜ相関分析が重要? リスク管理 高相関ポジションによるリスクの二重化を回避。 ヘッジ戦略 効果的なヘッジのため、強い負の相関を持つペアを自動検出。
FREE
Fixed Volume Profile
Carlos Pascual Perez Maturano
This indicator, titled "Fixed Volume Profile.mq5", is a custom tool for MetaTrader 5 (MQL5) designed to calculate and display a Volume Profile over a user-defined fixed time range. The Volume Profile shows the distribution of trading volume at different price levels during a specific period, helping to identify areas of high activity (such as Points of Control or POCs) and volume-based support/resistance areas. Main Functionality: Interactive Range: The indicator creates two vertical lines on
FREE
このプロダクトを購入した人は以下も購入しています
Neuro Poseidon is a new indicator by Daria Rezueva. It combines precise trading signals with adaptive TP/SL levels - creating best possible trades as a result! Message me and get  Neuro Poseidon Assistant  as a gift to automize your trading process! What makes it stand out? 1. Proven profitability on all assets and timeframes 2. Only confirmed BUY and SELL signals present on the chart 3. Adaptive TP & SL levels generated by the software for each trade 4. Easy to understand - suitable for al
SuperScalp Pro
Van Minh Nguyen
4.67 (27)
SuperScalp Pro – 高度なマルチフィルタースキャルピングインジケーターシステム SuperScalp Pro は、クラシックな Supertrend と複数のインテリジェント確認フィルターを組み合わせた高度なスキャルピングインジケーターです。M1 から H4 まで複数の時間足で効率的に動作し、XAUUSD、BTCUSD、主要 Forex 通貨ペア向けに最適化されています。 このインジケーターは明確な Buy / Sell シグナルを提供し、ATR に基づいてエントリー価格、Stop Loss、Take Profit を自動計算します。Fibonacci Take Profit 機能により、重要な価格帯で早期決済し、到達時に通知を送信します。 初期設定では Fibonacci Take Profit が有効化されており、より安定した取引体験を重視しています。チャートに適用するだけですぐ利用可能です。上級者向けに、すべてのパラメータは自由にカスタマイズできます。 完全なドキュメントは製品ブログにあります: [User Guide] SuperScalp Pro Auto T
Quantum TrendPulse を ご紹介します。これは、   SuperTrend   、   RSI   、および Stochastic のパワーを 1 つの包括的なインジケーターに組み合わせて、取引の可能性を最大限に引き出す究極の取引ツールです。精度と効率を求めるトレーダー向けに設計されたこのインジケーターは、市場のトレンド、勢いの変化、最適なエントリー ポイントとエグジット ポイントを自信を持って特定するのに役立ちます。 主な特徴: SuperTrend 統合: 現在の市場動向に簡単に追従し、収益性の波に乗ることができます。 RSI精度: 買われすぎと売られすぎのレベルを検出し、市場の反転のタイミングに最適で、SuperTrendのフィルターとして使用されます。 確率的精度: 確率的振動を活用して、変動の激しい市場で隠れたチャンスを見つけます。SuperTrend のフィルターとして使用されます。 マルチタイムフレーム分析:   M5 から H1 または H4 まで、さまざまなタイムフレームで市場を常に把握します。 カスタマイズ可能なアラート: カスタム取引条件が満たされ
Entry In The Zone and SMC Multi Timeframe is a real-time 2-in-1 market analysis tool that combines market structure analysis and a No Repaint BUY / SELL signal system into a single indicator, built on Smart Money Concepts (SMC) — a widely adopted framework used by professional traders to understand market structure. This indicator helps you see the market more clearly, make decisions based on structure rather than guesswork, and focus on high-probability zones where price is more likely to react
このインジケーターを購入された方には、以下の特典を 無料 で提供しています: 各トレードを自動で管理し、ストップロスとテイクプロフィットを設定し、戦略ルールに基づいてポジションを決済する補助ツール 「Bomber Utility」 様々な銘柄に合わせたインジケーターの設定ファイル(セットファイル) 「最小リスク」、「バランスリスク」、「待機戦略」 の3つのモードで使用できる Bomber Utility 用の設定ファイル このトレーディング戦略をすぐに導入・設定・開始できる ステップバイステップのビデオマニュアル ご注意: 上記の特典を受け取るには、MQL5のプライベートメッセージシステムを通じて販売者にご連絡ください。 オリジナルのカスタムインジケーター 「Divergence Bomber(ダイバージェンス・ボンバー)」 をご紹介します。これは、MACDのダイバージェンス(乖離)戦略に基づいた 「オールインワン」型のトレーディングシステム です。 このテクニカルインジケーターの主な目的は、価格とMACDインジケーターの間に発生するダイバージェンスを検出 し、将来の価格の動きを示す
この製品は 2026 年の市場向けに更新され、最新の MT5 ビルドに最適化されています。 価格更新のお知らせ: Smart Trend Trading System は現在 $99 で提供されています。 次の 30 件の購入 後、価格は $199 に上がります。 特別オファー: Smart Trend Trading System を購入後、私にプライベートメッセージを送ることで、 Smart Universal EA を無料 で受け取り、Smart Trend のシグナルを自動売買に変えることができます。 Smart Trend Trading System は、リペイントなし、再描画なし、遅延なしの完全なトレーディングシステムです。よりクリーンなシグナル、より明確なトレンド方向、そしてより整理された取引方法を求めるトレーダー向けに作られています。 Online course , manual and download presets . このシステムは、トレンド検出、反転ゾーン、Smart Cloud、トレーリングストップロジック、サポートとレジスタンス、ローソク足の色分け、ア
M1 Quantum は、M1専用のプロフェッショナルトレーディングシステムであり、ストップロス、テイクプロフィット、スマートな資金管理を内蔵した、迅速かつ正確な取引シグナルを提供します。 M1 Quantum は、 連続勝利 に重点を置いて口座を素早く成長させるために設計されたプロフェッショナルな資金管理を備えています。 M1 Quantum インジケーター の主な特徴 M1時間足 およびすべての 主要通貨ペア 向けに設計 すべての取引にストップロスとテイクプロフィットを設定 資金管理 を実装し、トレーダーが簡単に取引できるようサポート 高い勝率と高い 連続勝利 リペイントなし、遅延なし あらゆるトレーダーにとって理解しやすい M1 Quantum を使用するには、 M1 Quantum Assistant が必要です。この強力なツールは、M1 Quantum をご購入いただいたすべてのお客様に 無料 で提供されています。 M1 Quantum Assistant をダウンロード 私のMQL5 チャンネルに参加して、最新のアップデートや新製品のリリース情報を入手してください。 価格は
トレンドキャッチャーインジケーター トレンドキャッチャーインジケーターは、開発者独自の適応型トレンド分析指標を組み合わせることで、市場価格の動きを分析します。短期的なノイズを除去し、根底にあるモメンタムの強さ、ボラティリティの拡大、価格構造の挙動に焦点を当てることで、真の市場方向性を特定します。また、移動平均線、RSI、ボラティリティフィルターなどの平滑化およびトレンドフィルタリング機能を備えたカスタマイズ指標も使用します。 実際の運用状況のモニタリングやその他の製品については、こちらをご覧ください: https://www.mql5.com/en/users/mechanic/seller ご注意ください。私はTelegramでEAや設定を販売していません。詐欺です。すべての設定はブログで無料で公開しています。 重要!ご購入後すぐにご連絡ください。手順とボーナスをお送りします!
SignalTech is an unique fully rule based trading system delivers an Institutional approach for both Independent Traders and Prop Firm Challengers. Never Repaint. Push Notification available. No over-optimization. All the winning trades with chart setups are published on the comments page. 2026-05 4107 Pips (Until 05-29 NY Closed) 2026-04 2243 Pips 2026-03 2165 Pips 2026-02 2937 Pips 2026-01 2624 Pips 2025-12 1174 Pips It can generate signals with Buy/Sell Arrows, Push Notification (To Mobile) an
PrimeScalping is a powerful trading companion designed to generate high-probability entry signals with dynamic TP/SL/DP levels based on volatility. Built-in performance tracking shows win/loss stats, PP1/PP2 hits, and success rates — all updated live. Key Features: Buy/Sell signals with adaptive volatility bands Real-time TP/SL/DP levels based on ATR Built-in MA Filter with optional ATR/StdDev volatility Performance stats panel (Success, Profit/Loss, PP1/PP2) Alerts via popup, sound, push, or e
FX Trend NG:次世代マルチマーケット・トレンドインテリジェンス 概要 FX Trend NG は、複数の時間足に対応したプロフェッショナル向けトレンド分析およびマーケット監視ツールです。 市場全体の構造を数秒で把握することができます。 複数のチャートを切り替える必要はありません。どの銘柄がトレンド中なのか、どこでモメンタムが弱まっているのか、そしてどの時間足で強い整合性があるのかを瞬時に確認できます。 ローンチ特別オファー – FX Trend NG を $30(6ヶ月) または $80 永久ライセンス でご利用いただけます。 すでに Stein Investments のユーザーですか? -> メッセージを送信 して、プライベートグループへアクセスしてください。 セットアップや詳細情報が必要ですか? -> Stein Investments 公式ページ をご覧ください。 1. FX Trend NG が他と異なる理由 3ステート・トレンドロジック ― Buy と Sell だけではない • 多くのインジケーターは Buy または Sell の2状態のみを表示します。
Power Candles V3 - 自己最適化型強弱インジケーター Power Candles V3は 、通貨や銘柄の強さを、適用されたすべてのチャート上で実行可能なトレードプランに変換します。単にローソク足を色分けするだけでなく、バックグラウンドでリアルタイムの自動最適化を実行し、目の前の銘柄に対して最適なストップロス、テイクプロフィット、およびシグナルの閾値を提示します。ワンクリックで実取引に適用でき、エントリーポイント、ストップロス、テイクプロフィットのラインが正確な価格位置にチャート上に表示され、方向性を示すアラートがリアルタイムで発動します。 このツールは、Stein Investmentsのエコシステムの一部です。  18種類以上のツールをすべて閲覧し、AIを活用したセットアップの推奨事項を入手し、  https://stein.investments でコミュニティに参加しましょう クローズしたバーごとに3,000回以上のトレードシミュレーション。9つの強さの状態。2つの戦略を並行してテスト。勝率の高い設定をワンクリックで適用。 なぜこれが必要なのか ほとんどの強
この製品は 2026 年の市場向けに更新され、最新の MT5 ビルドに最適化されています。 価格更新のお知らせ: Atomic Analyst は現在 $99 で提供されています。 次の 30 件の購入 後、価格は $199 に上がります。 特別オファー: Atomic Analyst を購入後、私にプライベートメッセージを送ることで、 Smart Universal EA を無料 で受け取り、Atomic Analyst のシグナルを自動売買に変えることができます。 Atomic Analyst は、リペイントなし、再描画なし、遅延なしの Price Action トレーディングインジケーターで、手動取引、シグナルの明確化、EA 自動化のために設計されています。 User manual: settings, inputs and strategy. 価格行動、強さ、モメンタム、マルチタイムフレーム方向、高度なフィルターを分析し、トレーダーがノイズを減らし、弱いセットアップを避け、より構造化された取引判断を行えるようにします。 このインジケーターは、複雑な市場計算をシンプルな視覚シ
UZFX {SSS} スキャルピング・スマートシグナル MT5は、変動の激しい市場において正確かつリアルタイムのシグナルを求めるスキャルパー、デイトレーダー、スイングトレーダー向けに設計された、リペイントしない高性能な取引インジケーターです。(UZFX-LABS)によって開発されたこのインジケーターは、価格行動分析、トレンド確認、スマートフィルタリングを組み合わせることで、すべての通貨ペアおよび時間軸において、高確率の売買シグナルを生成します。 推奨* 最適な時間足:15分足以上。 {1時間足}が私のお気に入りです。そして、その成果は驚くべきものです...! 注:{ LTL 164343 }インジケーターと組み合わせることで、シグナルの勝率を高めることができます。 LTLシグナルでトレンドを判断し、SSSシグナルをエントリーシグナルとして活用してください。 このアプローチにより勝率が最大化され、誤ったシグナルの発生を防ぐことができます。 主な機能 スマートシグナル検出 – 強力なトレンド反転や継続パターンを正確に特定します。 マルチタイムフレーム・スキャルピング – すべての時間
Gann Made Easy   は、ミスター・ギャンの理論を使用した取引の最良の原則に基づいた、プロフェッショナルで使いやすい外国為替取引システムです。 W・D・ガン。このインジケーターは、ストップロスとテイクプロフィットレベルを含む正確な買いと売りのシグナルを提供します。 PUSH通知を利用して外出先でも取引可能です。 ご購入後、取引方法の説明と優れた追加インジケーターを無料で入手するには、私にご連絡ください! おそらく、ギャンの取引手法についてはすでに何度も聞いたことがあるでしょう。通常、ギャンの理論は初心者のトレーダーだけでなく、すでにある程度の取引経験がある人にとっても非常に複雑なものです。なぜなら、ギャンの取引手法は理論的にはそれほど簡単に適用できるものではないからです。私はその知識を磨き、最良の原則を私の外国為替インジケーターに組み込むために数年を費やしました。 このインジケーターは非常に簡単に適用できます。必要なのは、それをチャートに添付し、簡単な取引推奨事項に従うだけです。このインジケーターは常に市場分析の仕事を行い、取引の機会を探します。適切なエントリーポイントを検
SmartScalping is a powerful trading companion designed to generate high-probability entry signals with dynamic TP/SL/DP levels based on volatility. Built-in performance tracking shows win/loss stats, PP1/PP2 hits, and success rates — all updated live. Key Features: Buy/Sell signals with adaptive volatility bands Real-time TP/SL/DP levels based on ATR Built-in MA Filter with optional ATR/StdDev volatility Performance stats panel (Success, Profit/Loss, PP1/PP2) Alerts via popup, sound, push, or e
GEM Signal Pro GEM Signal Pro は、MetaTrader 5 向けのトレンドフォロー型インジケーターです。より明確なシグナル、より整理されたトレードセットアップ、そして実用的なリスク管理をチャート上で確認したいトレーダーのために設計されています。 単純な矢印だけを表示するのではなく、GEM Signal Pro はトレード全体の考え方を、より見やすく分かりやすい形で表示します。条件が確認されると、インジケーターはエントリー価格、ストップロス、利確目標をチャート上に表示し、トレードセットアップをより効率的に確認できるようにします。 動作の仕組み このインジケーターは、まず内部ロジックに基づいて有効なシードシグナルを検出します。 確認条件が満たされると、GEM Signal Pro はチャート上に完全なセットアップを表示します。これにより、トレーダーはトレード構造をより明確に把握し、手作業による分析を減らすことができます。 チャート上のトレードレベル 確認済みシグナルに対して、GEM Signal Pro は以下を表示できます。 エントリー価格 ストップロス テ
ARIPoint
Temirlan Kdyrkhan
1 (1)
ARIPoint is a powerful trading companion designed to generate high-probability entry signals with dynamic TP/SL/DP levels based on volatility. Built-in performance tracking shows win/loss stats, PP1/PP2 hits, and success rates all updated live. Key Features: Buy/Sell signals with adaptive volatility bands Real-time TP/SL/DP levels based on ATR Built-in MA Filter with optional ATR/StdDev volatility Performance stats panel (Success, Profit/Loss, PP1/PP2) Alerts via popup, sound, push, or email Cu
MasterTrend Indicator for MT5 A powerful trend-following and signal-evaluation tool MasterTrend   is a custom MT5 indicator that combines Moving Averages and ATR-based risk/reward logic to generate clear buy/sell signals. It visualizes dynamic SL/TP levels, evaluates past trade outcomes, and displays win/loss statistics in a clean on-chart panel. Key features include: Buy/Sell signals based on MA crossovers ATR-based SL/TP1/TP2/TP3 levels with visual lines and labels Signal outcome tracking wit
Crystal Heikin Ashi Signals - Professional Trend & Signal Detection Indicator Advanced Heikin Ashi Visualization with Intelligent Signal System for Manual & Automated Trading Final Price: $149 ---------> Price goes up $10 after every 10 sales . Limited slots available — act fast . Overview Crystal Heikin Ashi Signals is a professional-grade MetaTrader 5 indicator that combines pure Heikin Ashi candle visualization with an advanced momentum-shift detection system. Designed for both manual traders
Azimuth Pro
Ottaviano De Cicco
5 (7)
Azimuth Pro V2:MT5向けシンセティック・フラクタル構造分析と確認済みエントリー 概要 Azimuth Pro は Merkava Labs によるマルチレベルスイング構造インジケーターです。4つのネストされたスイングレイヤー、スイングアンカーVWAP、ABCパターン検出、3タイムフレーム構造フィルタリング、そして確定バーでの確認済みエントリー — 1つのチャートで、ミクロスイングからマクロサイクルまでを網羅するワークフロー。 これはブラインドシグナル製品ではありません。ロケーション、コンテキスト、タイミングを重視するトレーダーのための構造ファーストワークフローです。 V2発売記念オファー — Azimuth Pro V2をUSD 399で(次の100本)。最終価格:USD 499。 1. V2での変更点 シンセティック・マルチタイムフレームエンジン 上位タイムフレーム分析をMeridian Proと同じ独自のシンセティックアーキテクチャで一から再構築。よりクリーンなHTFコンテキスト、安定したライブ動作、従来のMTF同期問題なし。シンセティックエンジンは 固定比率タ
ScalpPoint is a powerful trading companion designed to generate high-probability entry signals with dynamic TP/SL/DP levels based on volatility. Built-in performance tracking shows win/loss stats, PP1/PP2 hits, and success rates — all updated live. Key Features: Buy/Sell signals with adaptive volatility bands Real-time TP/SL/DP levels based on ATR Built-in MA Filter with optional ATR/StdDev volatility Performance stats panel (Success, Profit/Loss, PP1/PP2) Alerts via popup, sound, push, or emai
MT4版もご用意しています https://www.mql5.com/ja/market/product/170617  M30/H1/H4スイング版もあります M5/M15では取りきれない大きな波を狙いたい方へ。 Gold Signal Swing Pro(M30/H1/H4対応)を販売中。 1トレードで$20〜$80+の値幅を狙う。 https://www.mql5.com/en/market/product/177643 KURAMA GOLD SIGNAL PRO(MT5版)— 7層フィルター搭載 XAUUSD完全トレードシステム リペイントなし。リドローなし。ラグなし。すべてのサインは確定後に変わりません。 購入者限定特典:買い切りライセンスをご購入いただいた方に、AI Zone Radar($59相当)+PDFマニュアルを無料プレゼント。購入後にMQL5でメッセージをお送りください。 AI Zone Radar:
Quant Direction は、3次元の市場分析ツールです。完全に客観的なアルゴリズムベースの市場分析を提供し、様々なパラメータにわたる正確なパーセンテージ偏差を同時に算出します。高度なAI搭載モデリングツールで開発され、厳密なテストを経て開発されたこのアルゴリズムは、かつてない精度で市場を分析するように設計されています。プラットフォーム上では、あらゆる通貨ペアや金融商品を分析できます。 短期取引、デイトレード、スイングトレードなど、どのような取引スタイルに も、Quant Directionは最適な選択肢です。 オペレーターの本当の利点 Quant Directionの真の利点は、感情、眼精疲労、過剰分析を完全に排除できる点にあります。方向性を探るために何十ものチャートを手作業で精査したり、自分の好みを常に疑ったりする必要がなくなります。このシステムは、8つの時間間隔(5ヶ月から月単位まで)をミリ秒単位で処理します。あらゆる瞬間に市場を支配している主体を正確に明らかにし、常に成功確率が最も高い方向で取引できるようにします。 市場分析の3つの側面 このアルゴリズムは市場を3つの
Meridian Pro
Ottaviano De Cicco
5 (2)
Meridian Pro 2.00:MT5向けプロ仕様マルチタイムフレーム・トレンドマトリクス Meridian Pro 2.00 は、MetaTrader 5 向けのプロ仕様の適応型トレンドマトリクスです。オリジナルの Meridian トレンドエンジン、クリーンなチャート ribbon、確定足ベースのシグナル矢印、8時間足 dashboard、Fuel momentum、weighted consensus、synthetic HTF processing、そしてチャート上に直接表示される上位足コンテキストラインを統合します。 目的はシンプルです。現在のトレンド、マルチタイムフレーム構造、強度、momentum、EA-ready 状態を、複数チャートに無関係なインジケータを重ねるのではなく、1つの整理された workflow で読むことです。 Meridian Pro の違い 1つの適応型エンジン - 同じ volatility-aware Meridian ロジックを M1 から W1 まで適用します。 Synthetic HTF architecture - 上位足行は下位足デ
この製品は 2026 年の市場向けに更新され、最新の MT5 ビルドに最適化されています。 価格更新のお知らせ: MENA Trend Scanner Pro は現在 $99 で提供されています。 次の 30 件の購入 後、価格は $199 に上がります。 特別オファー: MENA Trend Scanner Pro を購入後、私にプライベートメッセージを送ることで、 Smart Universal EA を無料 で受け取り、MENA Trend のシグナルを自動売買に変えることができます。 まず、このトレーディングシステムはリペイントなし、再描画なし、遅延なしのインジケーターであり、手動取引とロボット取引の両方に理想的であることを強調しておきます。 Online course, user manual, and downloadable presets included. MENA Trend Scanner Pro は、複数のシンボルと複数の時間足を同時に分析する完全な multi-pair scanner dashboard として機能します。手動で何度もチャートを切り替える代
MasterTrend Indicator for MT5 A powerful trend-following and signal-evaluation tool MasterTrend   is a custom MT5 indicator that combines Moving Averages and ATR-based risk/reward logic to generate clear buy/sell signals. It visualizes dynamic SL/TP levels, evaluates past trade outcomes, and displays win/loss statistics in a clean on-chart panel. Key features include: Buy/Sell signals based on MA crossovers ATR-based SL/TP1/TP2/TP3 levels with visual lines and labels Signal outcome tracking wit
FX Volume MT5
Daniel Stein
4.79 (24)
FX Volume:ブローカー視点で捉える本物の市場センチメント クイック概要 トレード手法をさらに高めたいとお考えですか? FX Volume は、リテールトレーダーやブローカーのポジション状況をリアルタイムで提供します。これは、COTのような遅延レポートよりもはるかに早く知ることができます。安定した利益を目指す方も、さらなる優位性を求める方も、 FX Volume は大きな不均衡を見極め、ブレイクアウトを確認し、リスク管理を洗練させるのに役立ちます。今すぐ始めて、実際の出来高データがどのように意思決定を変革するかを体感してください! 1. FX Volume がトレーダーにとって非常に有益な理由 高精度の早期警戒シグナル • 各通貨ペアを売買しているトレーダー数を、他者よりも早く、ほぼリアルタイムで把握できます。 • FX Volume は、複数のリテールブローカーから得られる本物の出来高データを収集し、分かりやすい形式で提供する 唯一 のツールです。 強力なリスク管理 • ロングやショートの大きな偏り(インバランス)を特定し、潜在的なトレンド転換を見逃しません。ストップ
FX Power: 通貨の強弱を分析して、より賢い取引を実現 概要 FX Power は主要通貨と金の実際の強弱をあらゆる市場状況で理解するための必須ツールです。強い通貨を買い、弱い通貨を売ることで、 FX Power は取引の意思決定を簡素化し、高い確率の取引機会を見出します。トレンドを追従する場合でも、極端なデルタ値を使用して反転を予測する場合でも、このツールはあなたの取引スタイルに完全に適応します。ただ取引するだけではなく、 FX Power で賢く取引をしましょう。 1. なぜ FX Power がトレーダーにとって非常に有益なのか 通貨と金のリアルタイム強弱分析 • FX Power は主要通貨と金の相対的な強弱を計算し、マーケットダイナミクスに関する明確な洞察を提供します。 • どの資産がリードしているか、または後れを取っているかを監視して、取引するペアを賢く選びましょう。 マルチタイムフレームの包括的なビュー • 短期、中期、長期のタイムフレームで通貨と金の強弱を追跡し、マーケットトレンドに基づいて取引戦略を調整できます。 • スキャルピングからスイングトレード
ご紹介     Quantum Breakout PRO は 、ブレイクアウト ゾーンの取引方法を変革する画期的な MQL5 インジケーターです。 13年以上の取引経験を持つ経験豊富なトレーダーのチームによって開発されました。     クォンタム ブレイクアウト プロ   は、革新的でダイナミックなブレイクアウト ゾーン戦略により、あなたのトレーディングの旅を新たな高みに押し上げるように設計されています。 クォンタム ブレイクアウト インジケーターは、5 つの利益ターゲット ゾーンを備えたブレイクアウト ゾーン上のシグナル矢印と、ブレイクアウト ボックスに基づいたストップロスの提案を提供します。 初心者トレーダーにもプロのトレーダーにも適しています。 量子EAチャネル:       ここをクリック 重要!購入後、インストールマニュアルを受け取るためにプライベートメッセージを送ってください。 推奨事項: 時間枠: M15 通貨ペア: GBPJPY、EURJPY、USDJPY、NZDUSD、XAUUSD アカウントの種類: ECN、Raw、またはスプレッドが非常に低い R
フィルタ:
レビューなし
レビューに返信