UltimateSystem

Ultimate_Combined_System_V16.3_EN Indicator Introduction
Ultimate_Combined_System_V16.3 (UCS V16.3) is a professional comprehensive trend-following indicator designed for MetaTrader 4 (MT4). It integrates five core technical analysis factors—MACD, ADX, EMA, Momentum, and Donchian Channel—to provide accurate trend identification and market state judgment, serving as an essential auxiliary tool for trend traders.
At the core of the indicator lies a 4-factor voting scoring system, which evaluates the market's bullish, bearish, or neutral state through multi-dimensional criteria: ADX+DI/-DI comparison (trend direction), ADX strength threshold (trend validity), closing price vs. EMA (medium-term price gravity), and Momentum (price movement momentum). Only when the score difference between bullish and bearish exceeds 1 will a clear trend be confirmed, effectively filtering out choppy market noise.
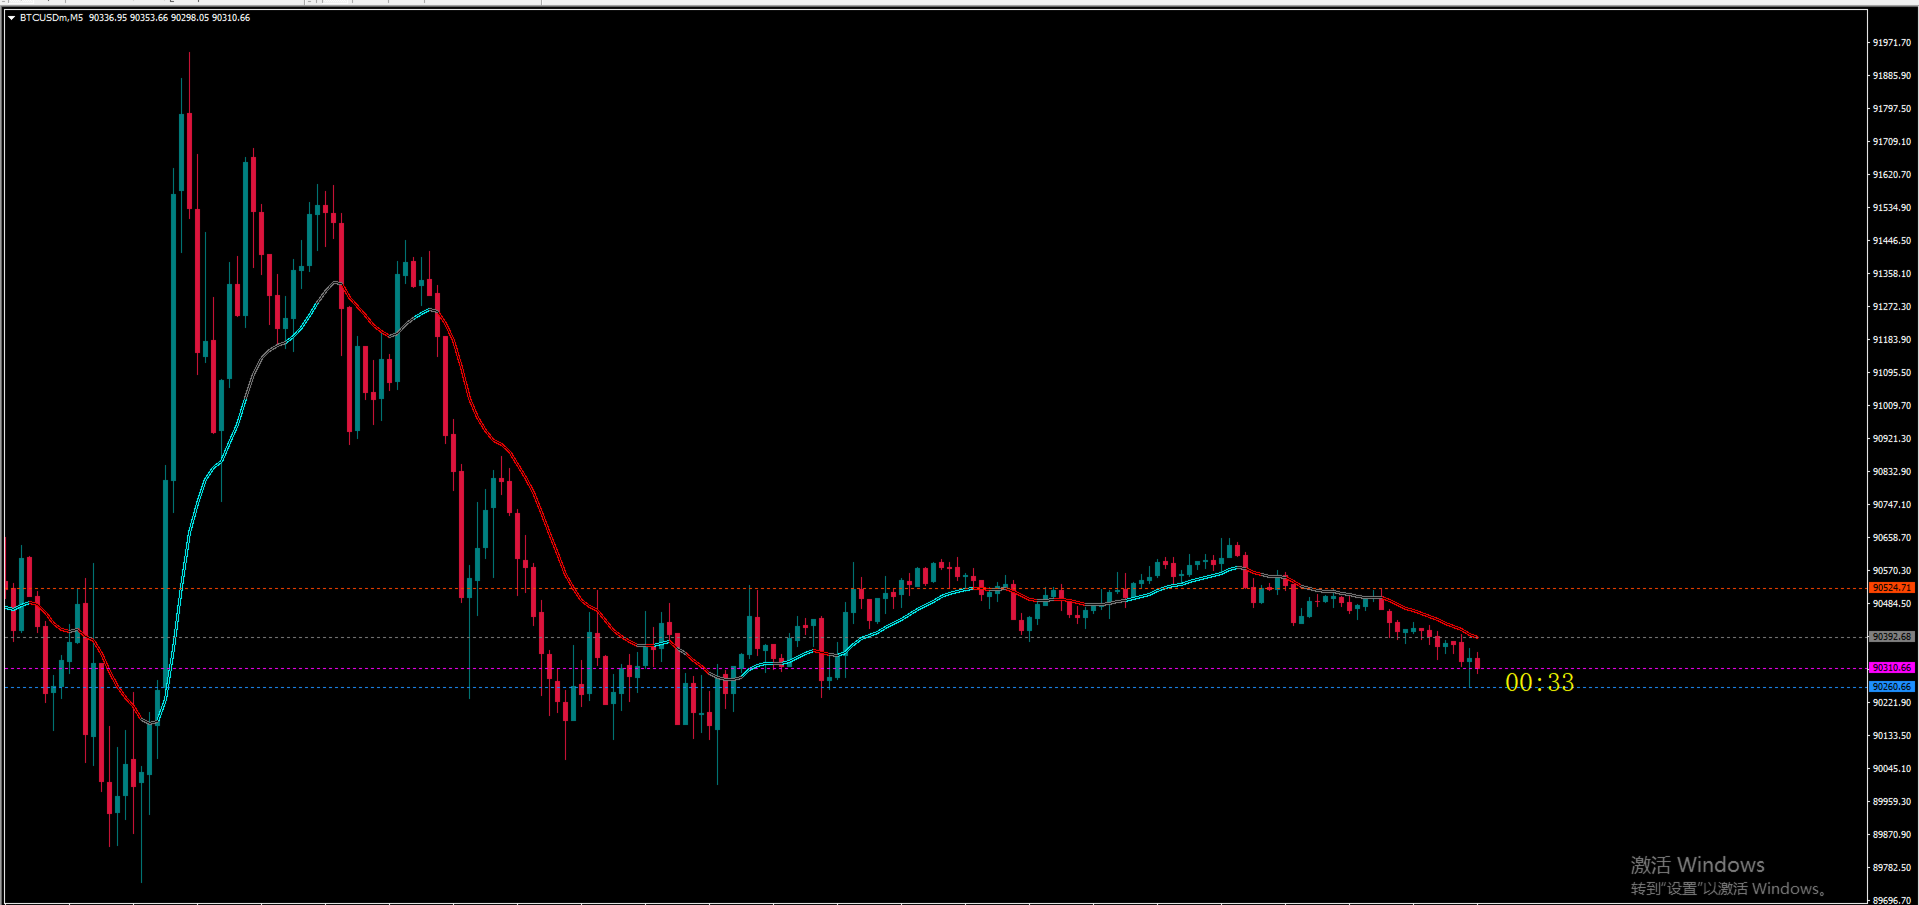
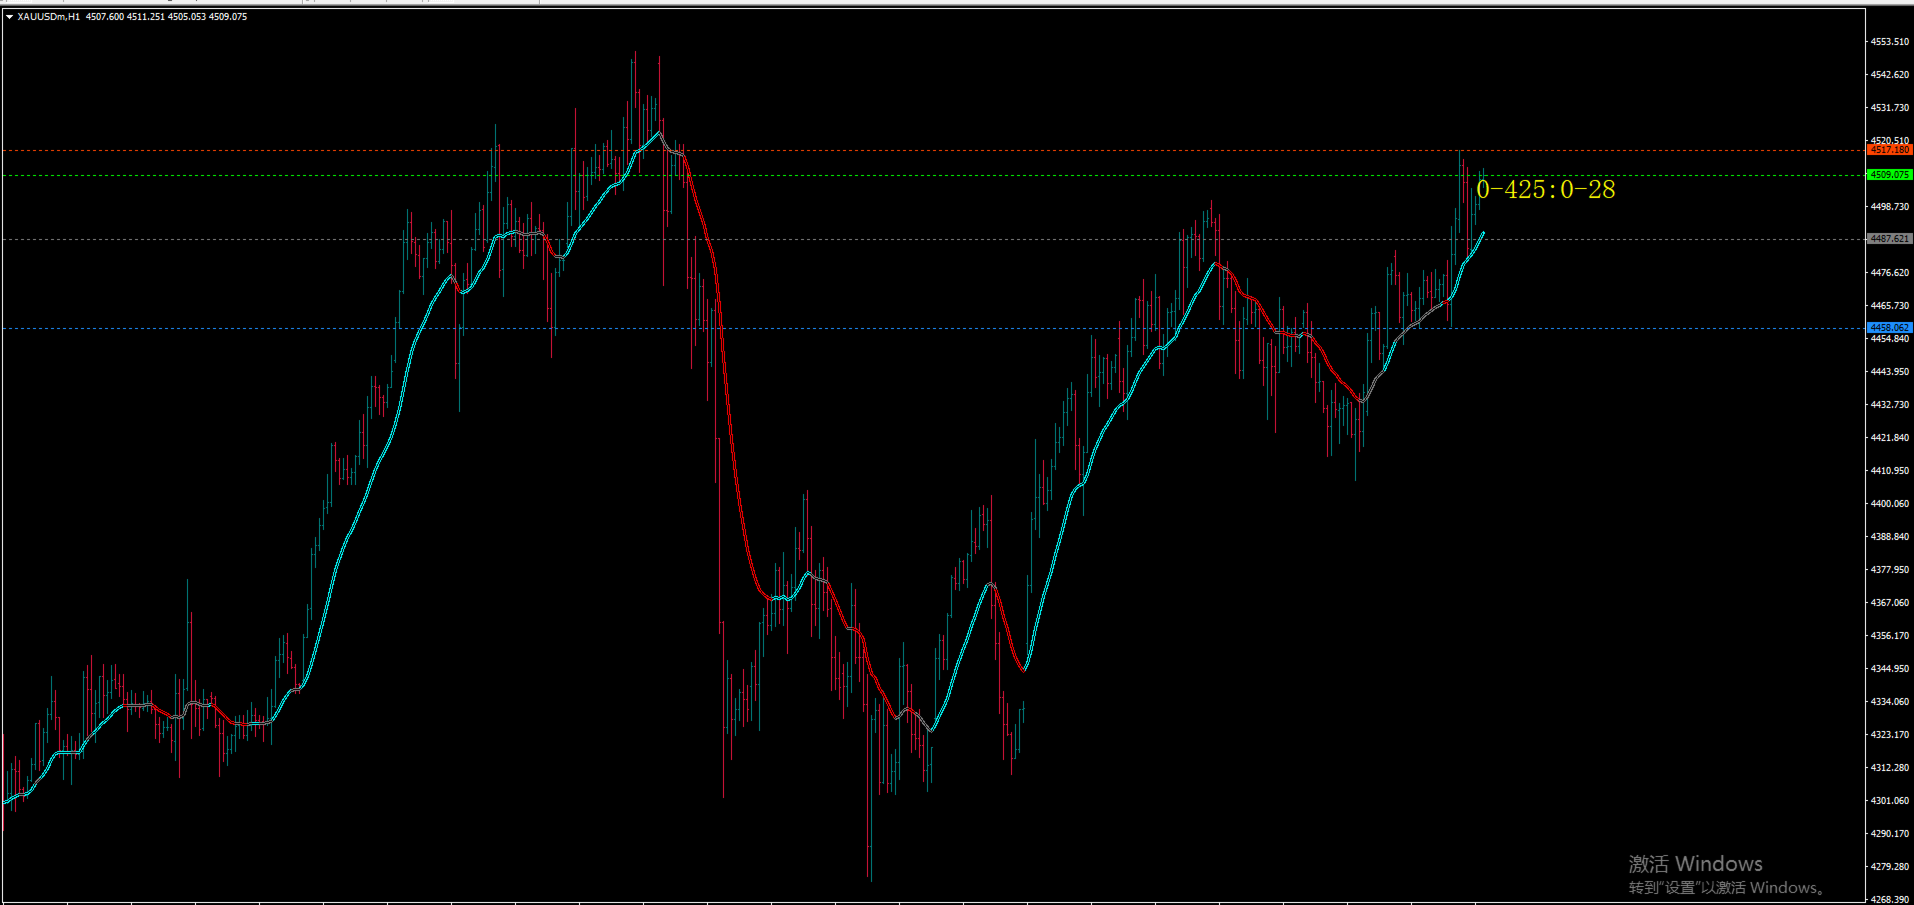
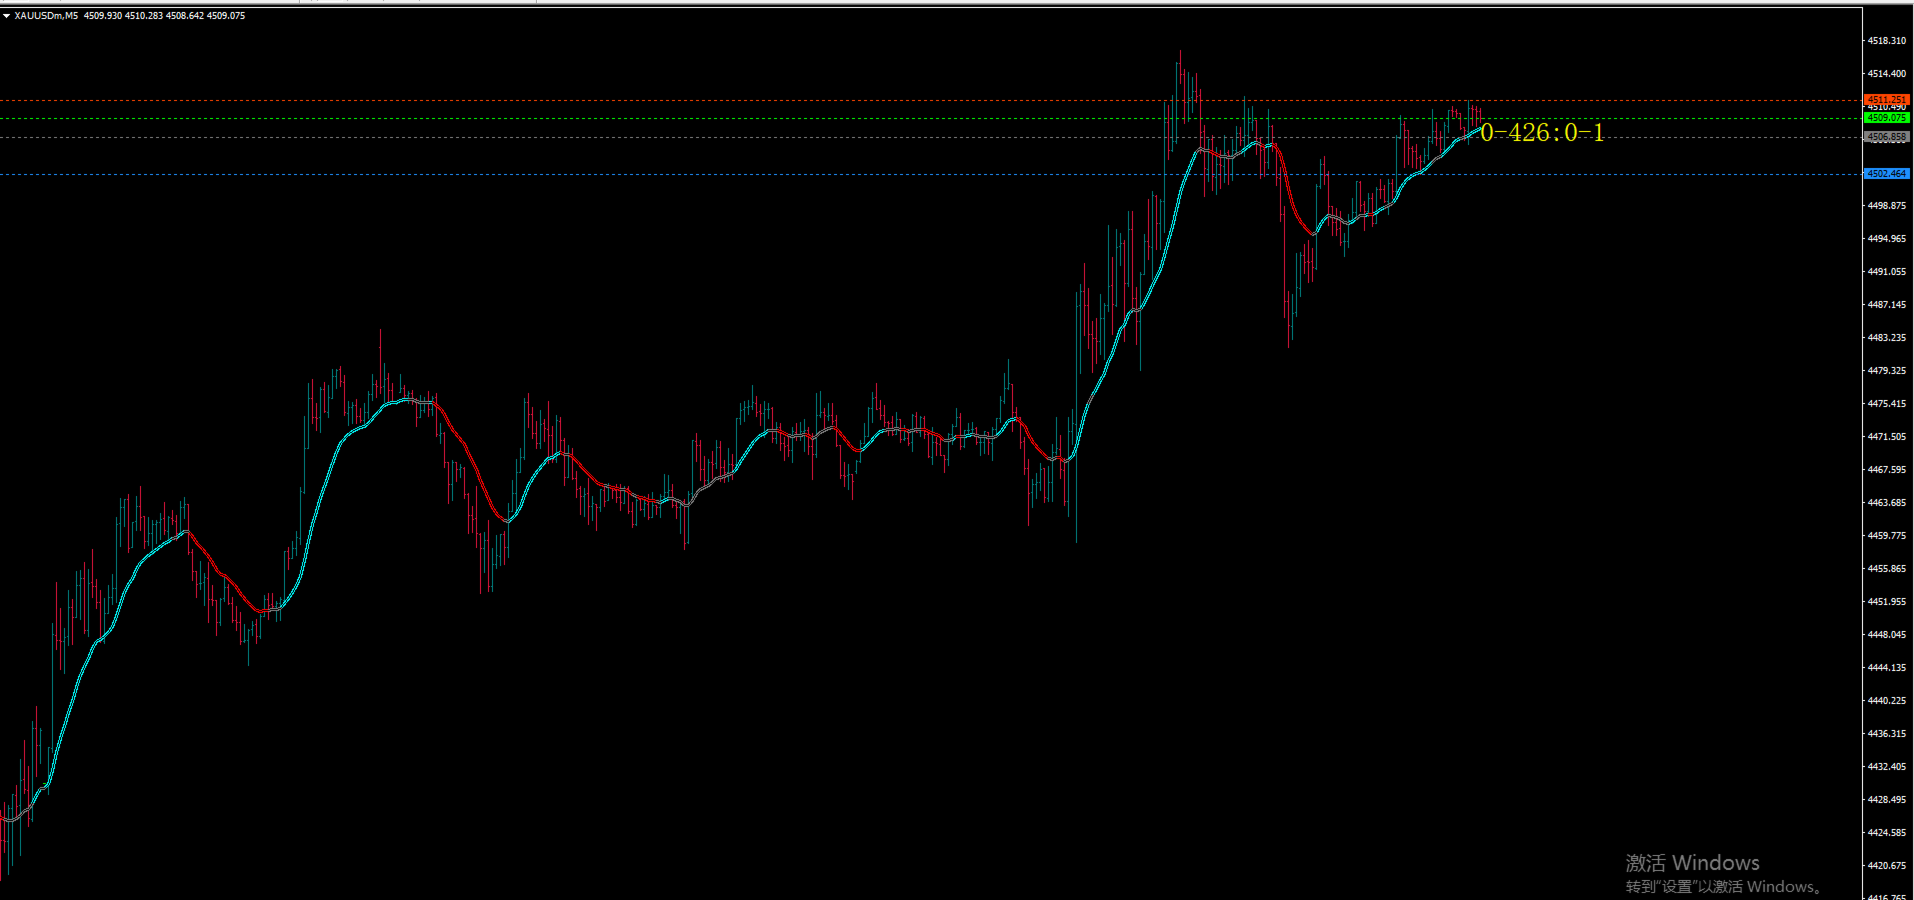
Key functions include: 1) Visual trend display (cyan line for bullish trends, red line for bearish trends, and gray line for neutral/choppy markets); 2) Real-time Donchian Channel (20-period) to define price ranges (upper rail: 20-period high, lower rail: 20-period low, middle rail: average of high and low); 3) Right-side current price tag with color coding (lime for MACD > 0, magenta for MACD < 0) to intuitively reflect short-term bullish/bearish strength.
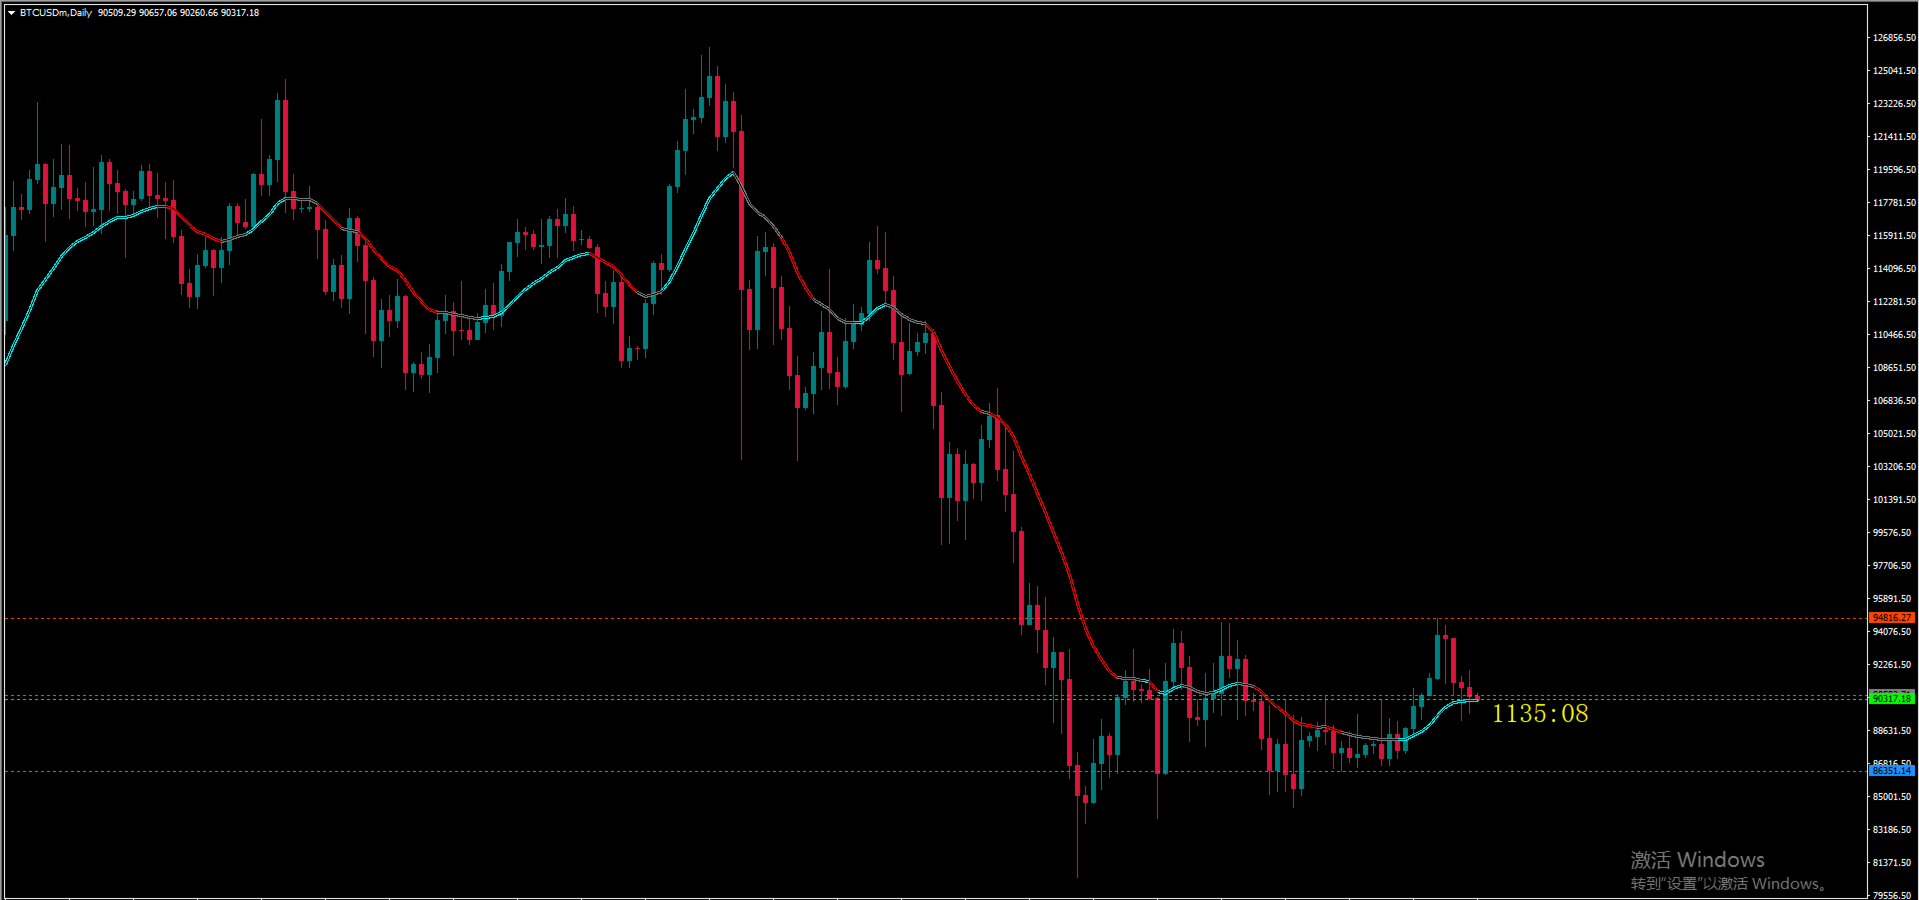
Optimized with bug fixes (including array out-of-bounds and incorrect cycle verification), the indicator features stable performance, smooth trend lines, and real-time data updates. It is suitable for various financial instruments such as forex majors, gold, and crude oil, and performs excellently on timeframes from 4-hour to daily charts. It is recommended for trend traders to use it for trend filtering, and to combine it with moving averages, support/resistance levels, or candlestick patterns to improve trading accuracy.

おすすめのプロダクト
The Trends Trg indicator determines the prevailing trend. They help to analyze the market at the selected time interval. Easy to set up and works on all pairs and all time frames. Trend indicators make it possible to classify the direction of price movement by determining its strength. Solving this problem helps investors enter the market on time and get a good return. It is extremely important for any trader to correctly determine the direction and strength of the trend movement. Unfortunatel
AI Supertrend timely alerts MT4 Super Trend timely reminder indicator introduction I. Overview of indicators The MT4 Super Trend Alert Indicator is a technical analysis tool specifically designed for the MetaTrader 4 platform to help traders accurately capture changes in market trends and send timely signals to alert traders to potential trading opportunities. It is based on a unique AI-based algorithm that takes into account factors such as price volatility, trend strength, and market volatil
EA Scalping Expert
Gerard Valldosera Gomez
3 (1)
This is a fully automated scalping Expert Advisor that can be run successfully using EURUSD currency pair at H1 timeframe. This EA can't run in the same account. If you want an Expert Advisor that trades daily this is not because it requires patience to wait for a few days or weeks on the right opportunity for it to trade. It takes advantage of the volatility of the price movement.
FREE
This indicator is a perfect tool able to compare which brokers have the lower latency. It shows us immediately which brokers are slower or faster. When you see the dot icon on the line, it means this broker is the faster one and the red line (Broker_A) is the slower one. See the example on the screenshot. How It Works? This indicator shares the prices information to and from the "shared" common data folder. It compares all the prices. The price is based on average by (Ask + Bid) / 2. There are
FREE
Two Lines MACD Many people who conduct technical transactions on MT4 like to use MACD to judge the turning or continuation of the market. When everyone uses the MACD indicator that comes with MT4, they find that the indicator is a single-line MACD, and the histogram seems to be similar to the past. The MACD that I understand does not match. In order to provide traders with a perfect trading experience, we especially provides free two-line MACD indicators for all traders! The single line in the
FREE
インジケータは、チャート上の端子RSI発振器に基づく信号を示しています。 繰り返し信号をフィルタリングすることができます。 ここでは、発振器は逆信号を検索するために使用されます。 これは、レベルからスイング戦略や取引のエントリポイントとして推奨されます。 マルチ通貨ダッシュボードが利用可能です。 それを使用すると、簡単にチャートを切り替えることができます。 製品のディスカッションでは、ダッシュボードを埋め込むことができるアルゴリズムを提案できます。 入力パラメータ 。 主な設定 。 Bars Count – インジケータが動作する履歴バーの数 。 RSI Period – オシレーター周期 。 RSI Level – オシレータのレベル。 発振器は0と100の間に行きます。 10を選択すると、信号は10以上90以下になります 。 RSI Applied Price 。 Repeat Signal - 繰り返し信号 。 Enable – すべての繰り返し信号は、矢印/アイコンで表示されます 。 No Signal – 繰り返されるものはすべて無視されます 。 視覚的な矢印 。
FREE
The Stock Exchange One Sessions Hours version 2.00 This indicator facilitates observing the currency pair's quotations during subsequent parts of the stock exchange session live. Before the session starts, a rectangle is drawn on the chart but not filled in with color. It means the extent of the session duration. Before the first bar enters the rectangle of the session, a sound signal or pop-up window will notify us that the session will just start. When the price graph crosses the edge of the
FREE
WAD Stoch
Yonny Pascal Ekwa Mezui
WAD Divergence + Stochastic Overview WAD Divergence + Stochastic is a technical indicator designed to assist traders in identifying potential market turning points. It combines price behavior with momentum confirmation to highlight areas where buying or selling pressure may be shifting. The indicator works directly on the chart and provides clear visual signals to support decision-making in fast-moving markets. How It Works The indicator analyzes the relationship between price movement and inte
FREE
The   OHLC indicator   shows the current and historical values of High, Low, Open, Close and Mid for a specific time period. It can plot the current values or the values from the previous session. The indicator's range can be calculated from a daily, weekly, monthly, or user-specified session. Levels High  of the current or previous session. Low  of the current or previous session. Open  of current or previous session. Close  of the current or previous session. Midpoint  of the current or prev
FREE
Limited-time free release: Relative Volume Breakout Signals MT4 is published free while MetaCoderStore collects trader feedback, comments, and feature requests. Relative Volume Breakout Signals measures the current bar tick volume against its recent average and marks range breakouts that happen on unusual participation. Use cases Identify breakouts with stronger-than-normal tick volume. Filter quiet range breaks from high-participation expansion moves. Feed relative-volume and signal buffers int
FREE
Awesome MACD Indicator
Komang Putra Riswanjaya
5 (1)
AWESOME MACD INDICATOR Awesome MACD Indicator is a powerful trading tool that combines the strengths of Moving Average (MA) and Moving Average Convergence Divergence (MACD) to provide accurate and reliable trading signals. Designed for forex and stock traders, this indicator simplifies the identification of trading opportunities by detecting significant crosses in price movements. Key Features: MA and MACD Combination: Awesome MACD leverages the power of Moving Averages (MA) to identify short-te
FREE
This indicator is suitable for trading Forex and Binary Options, depending on its settings. The indicator is designed for trend trading. A buy signal: An up arrow appears on the chart. A sell signal: A down arrow appears on the chart. Input parameters === Setup CCI === Period CCI 1 - Period of the CCI Period CCI 2 - Period of the CCI Level BUY - Level of the CCI for buying Level SELL - Level of the CCI for selling === Setup RSI === Level SELL - Level of the RSI for selling Period SELL - Period
FREE
The indicator displays signals according to the strategy of Bill Williams on the chart. Demo version of the indicator has the same features as the paid, except that it can work only on a demo account . Signal "First Wise Man" is formed when there is a divergent bar with angulation.  Bullish divergent bar - with lower minimum and closing price in the upper half. Bearish divergent bar - higher maximum and the closing price at the bottom half. Angulation is formed when all three lines of Alligator
FREE
The popular "SuperTrend" indicator is a technical analysis tool designed to help identify trend direction and potential entry or exit points in financial markets. This indicator is built upon the Average True Range (ATR) , which gauges market volatility based on price ranges. It is available for free on other platforms, and this should be no exception! Common Use Cases The SuperTrend is typically utilized in three primary ways: Trend Identification: When the price is trading above the indicator
FREE
トレンドとボラティリティアナライザーインジケーターを分析するカスタムMT5(メタトレーダー5)インジケーター。さらに、ほとんどの通貨ペアと時間枠で機能するトレンドの始まりと終わりを識別します。 結論として、ボラティリティアナライザーを追加することで、より正確になるようにスーパートレンドフォーミュラに基づいてコーディングしました。 信頼性の高いサポートとレジスタンスのインジケーターをお探しの場合は、オールインワンレベルのインジケーター(プルバックゾーン、強力なサポート/レジスタンスゾーン、市場構造スクリーナーなど)をお試しください。,  ここをクリック。 主な機能 トレンドの始まりと終わりを特定します。 トレンドの強さを簡単に特定します(最大増加と最大減少) 市場の修正を特定します。 (弱い傾向) Potentielトレンドが始まるとアラートを受け取ります。 アドバンテージ すべてのペア(外国為替、暗号、インデックス、コメディー)での作業 すべての時間枠での作業。 (推奨される時間枠:H1およびH4の時間枠) アラートジェネレータ。 (ポップアップアラート、プッシュ通知ア
FREE
MACD Intraday Trendは、1960年代にGeraldAppelによって作成された元のMACDを適応させて開発された指標です。 長年の取引を通じて、MACDのパラメーターをフィボナッチの比率で変更することにより、トレンドの動きの連続性をより適切に表現できることが観察され、価格トレンドの開始と終了をより効率的に検出できるようになりました。 価格トレンドの検出が効率的であるため、トップとボトムの相違を非常に明確に識別し、取引機会をより有効に活用することもできます。 設定可能な機能とアラートを備えたプロフェッショナルバージョンをぜひお試しください: MACD Intraday Trend PRO 特徴 任意の通貨ペアで機能します 任意の時間枠で動作します 練行足チャートで動作します それでも質問がある場合は、直接メッセージで私に連絡してください。 https://www.mql5.com/ja/users/robsjunqueira/
FREE
SensorMap
Juergen Thielen
5 (1)
Concept Market arranges in Time upcoming Phases according to the present Results of its Interest. Directing Modulations are an Interaction of immanent Periods, which show in Reference to Time cyclic Activity and to Price leveling Activity. SensorMap is a reflecting Volume Mask of this Concept of Time and Price and apportioning developed Price Movements in an equalized 100 % - Range: how far moved ? indicating their Status by marking special Events: when which Action ? setting the Situation in a
FREE
PointZero
Juergen Thielen
5 (1)
Concept Market arranges in Time upcoming Phases according to the present Results of its Interest. Directing Modulations are an Interaction of immanent Periods, which show in Reference to Time cyclic Activity and to Price leveling Activity. PointZero is a projecting Price Mask of this Concept of Time and Price and categorizing developed Price Movements related to their own Range: how far moved ? indicating their Status by marking special Events: when which Action ? setting the Situation in a fun
FREE
Arrow Indicator (Buy/Sell Alerts) – Simple Yet Powerful Tool!             Product Version: 1.01           Indicator Type: Trend Reversal Signals           Timeframes Supported: All (Recommended: H1, H4, D1)           Key Features: Buy Signal: Green upward arrow () appears below the candle  Sell Signal : Red downward arrow () appears above the candle Accurate Trend Reversal Detection – Based on tried and tested SMA strategy. ️ Clean Chart View – Minimalist, non-i
FREE
Line
Andrea Fontanini
free only until the end of the week The following indicator must be used and contextualized according to your trading methodologies. It provides excellent trading insights and identifies rejection zones on the drawn lines. Several parameters can be customized. The indicator will plot three levels above and below the opening price on D1, W1, and MN1. It will provide the daily ADR and display two additional daily sessions (EUROPE session and USA session). The colors of the various lines can be cu
FREE
Pin Bars
Yury Emeliyanov
5 (5)
主な目的:"ピンバー"は、自動的に金融市場チャート上のピンバーを検出するように設計されています。 ピンバーは、特徴的なボディと長いテールを持つキャンドルであり、トレンドの反転または修正を知らせることができます。 それがどのように機能するか:インジケーターはチャート上の各キャンドルを分析し、キャンドルの体、尾、鼻のサイズを決定します。 事前定義されたパラメータに対応するピンバーが検出されると、インジケータはピンバーの方向(強気または弱気)に応じて、上矢印または下矢印でチャート上に パラメータ: TailToBodyRatio-テールの長さとピンバーのボディサイズの最小比率を定義します。 NoseToTailRatio-ピンバーの「ノーズ」とテールの間の最大許容比を設定します。 ArrowSize-マークされたピンバーとチャート上のピンバーを指す矢印との間の距離を定義します。 適用:"ピン棒"の表示器が潜在的な傾向の逆転ポイントを識別し、市場か近い位置を書き入れる信号を発生させるのに使用することができます。 正しく使用され、他のテクニカル指標や分析方法と組み合わせると、指標は取引結果
FREE
This indicator allows to hide CCI oscillator (on all MT4 timeframes) from a date define by the user, with a vertical line (Alone) or a panel (with "Hidden Candles"). Indicator Inputs: Period Apply To Information on "Commodity Channel Index" indicator is available here:   https://www.metatrader4.com/en/trading-platform/help/analytics/tech_indicators/commodity_channel_index ************************************************************* Hey traders!!  Give me your feeds!  We are a community here and
FREE
R シルバー トレンド インジケーターは、Metatrader 4 アクティビティ チャートに現在のトレンドを直接表示するトレンド フォロー型取引インジケーターです。 2 種類のろうそくを描画します。 青は強気の値動きです。 弱気の価格変動の場合は赤。 R シルバー トレンド インジケーターを使用した取引は、まったくの初心者でも非常に簡単で、スキャルピング (M1、M5)、デイ トレード (M5、M15、M30)、スイング トレード (H1、H4、D1) の通貨に使用できます。 基本的な取引シグナル R シルバー トレンド インジケーターのシグナルは解釈しやすく、次のようになります。 買いシグナル: インジケーターがチャート上に青いろうそくを描いたときに買いポジションを開きます. 売りシグナル: インジケーターがチャート上に赤いろうそくを描いたときに売りポジションを開きます. 取引の終了: 反対のシグナルが表示されたら、開いている取引を終了するか、独自の取引終了方法を使用します。 ヒント R シルバー トレンド インジケーターを使用して下落して売る戦略をトレードするには
FREE
Mr Beast Indicator
Luis Mariano Vazquez Marcos
Indicador Gratuito desarrollado por Mr Beast Inversiones Mr Beast : Gestión de riesgo profesional. Brindo a la comunidad la entrada a productos de M Beast. Echar un vistazo a mis señales y expert advisors. Descuentos de hasta 70% Diclaimer: La negociación en Forex, CFD y Opciones conlleva un riesgo de pérdida sustancial y no es adecuada para todos los inversores. El alto grado de apalancamiento puede actuar en su contra y también en su favor, Antes de decidirse a operar en productos tan apalanca
FREE
***IMPORTANT:  This free indicator works with the paid for Strong Weak Forex Expert Advisor. The EA also depends on the following custom indicators: Strong Weak Parabolic Strong Weak Symbols Strong Weak Values Strong Weak Indicator Download them for free in the Market. The EA will not work without it. These are all custom indicators which the Strong Weak Forex Expert Advisor relies on to generate trading signals. If you have any problems with installation send me a message.
FREE
MACD Trend FREE
Vojtech Svobodnik
5 (1)
MACD Trend FREE is Expert Advisor for EURJPY  based on MACD Indicator . You can completely edit settings of MACD Indicator, TakeProfit, StopLoss and TrailingStop. Default paramters are optimized for best results. But you can test other settings for antoher currency pairs or timeframe. MACD Trend FREE  has been tested from year 2003 to 2021 . My test used the real tick data with 99,90% accuracy. Doesn't use Martingale or other dangerous strategies.  Recommendations Symbol:   EURJPY Timeframe:  
FREE
YOU CAN NOW DOWNLOAD FREE VERSIONS OF OUR PAID INDICATORS . IT'S OUR WAY OF GIVING BACK TO THE COMMUNITY ! >>>    GO HERE TO DOWNLOAD   The system is a free open source pine script originally published on TradingView by everget   . It was converted to Mt4 by Forex Robot Makers. This system is a  popular trend indicator based on ATR ( Average True Range ) , Moving Averages and the Donchian channel . System BackGround ATR The average true range is an indicator of the price volatility of an asse
FREE
FFx Bulls Power
Eric Venturi-Bloxs
3.67 (3)
The purpose of this new version of the MT4 standard indicator provided in your platform is to display in a sub-window multiple timeframes of the same indicator. See the example shown in the picture below. But the display isn’t like a simple MTF indicator. This is the real display of the indicator on its timeframe. Here's the options available in the FFx indicator: Select the timeframes to be displayed (M1 to Monthly) Define the width (number of bars) for each timeframe box Alert pop up/sound/ema
FREE
このインジケーターは、重要なサポートラインやレジスタンスラインのブレイクアウトに基づいてトレンドを判定する、先進的な分析ツールです。 価格が特定の水準を突破したときにシグナルを発することで、トレーダーは明確な方向性を把握しやすくなり、エントリーのチャンスを逃さず捉えることができます。 従来の複雑なインジケーターとは異なり、このツールは設定項目が1つだけ。 そのため、どのような通貨ペアや銘柄に対しても迅速に適応し、最小限の調整で最大のパフォーマンスを発揮します。 例えば、ドル円、ユーロドル、ゴールド、株価指数など、幅広い市場に柔軟に対応でき、余計な最適化作業を省くことが可能です。 さらに大きな特徴は、リペイントを一切しないという点です。 これは一度確定したシグナルが後から変わることがないという意味であり、信頼性の高いシグナルを得られることを保証します。 特に短期トレードやスキャルピングでは「正確さ」と「スピード」が重要ですが、このインジケーターはその両方を兼ね備えています。 通知機能も充実しています: モバイル PUSH 通知 – 外出中でもリアルタイムでシグナルを受信可能。 デスク
FREE
Price Action 需給リバーサルダッシュボード Price Action Demand & Supply Reversal Dashboard は、複数銘柄を同時にスキャンし、高確率の反転ポイントを特定するために設計された高度なインジケーターです。マーケットウォッチ内のすべての銘柄を分析し、リアルタイムのダッシュボードで分かりやすく表示します。 スマートマネーコンセプト(SMC)とプライスアクションを組み合わせることで、多数のチャートを手動で分析することなく、最も有望な反転機会を迅速に見つけることができます。 主な機能 マルチ銘柄リバーサルスキャナー インジケーターは、Market Watch 内のすべての銘柄を自動的にスキャンし、以下の要素に基づいて評価を行います: 流動性のスイープ 構造転換(ChoCH) オーダーブロック フェアバリューギャップ(FVG) 需給ゾーン 各条件はスコアに反映され、トレード機会を客観的にランク付けします。 インテリジェントスコアリングシステム 各銘柄には 0〜100 の反転スコアが付与されます: 70以上:有効な反転シグナル 85以上:高確率の
FREE
このプロダクトを購入した人は以下も購入しています
Trend Breakout Arrows Indicator The Trend Breakout Arrows Indicator is a momentum-based signal tool designed to identify potential bullish and bearish breakout opportunities. It displays clear arrow signals directly on the price chart, helping traders quickly recognize possible trend changes and continuation setups. Up Arrow (Buy Signal) A magenta up arrow appears below a candle when bullish momentum begins to strengthen. This signal indicates that buying pressure may be overtaking selling press
El indicador "MR BEAST ALERTAS DE LIQUIDEZ" es una herramienta avanzada diseñada para proporcionar señales y alertas sobre la liquidez del mercado basándose en una serie de indicadores técnicos y análisis de tendencias. Ideal para traders que buscan oportunidades de trading en función de la dinámica de precios y los niveles de volatilidad, este indicador ofrece una visualización clara y detallada en la ventana del gráfico de MetaTrader. Características Principales: Canal ATR Adaptativo: Calcula
A scalping indicator based on mathematical patterns, which on average gives signals with relatively small SL, and also occasionally helps to catch big moves in the markets (more information in the video) This indicator has three main types of notifications: The first type warns of a possible/upcoming signal on the next bar The second type indicates the presence of a ready signal to enter the market/open a position The third type is for SL and TP levels - you will be notified every time price re
一款信号统计指标(MT4)——实现基于当前图表周期下的单线MA转向和双线MA金叉/死叉统计 . 转向定义:前一K向下或走平,当前K向上,视为转向向上;反之,转向向下。 金死叉定义:前一K快线在慢线下方,当前K快线在慢线上方,为金叉;反之,死叉。 参数及使用说明: 1、可指定统计K线数。 2、可指定4个不同的日内时间段,格式如"03:00-07:59",4个时间段可交叉任意输入。 3、可配置ABC三个浮盈区间段点值。如:分界区间统计小点值设为500,即当某转向信 号出现后到下一反向信号止浮盈<=此点值,计入A区间; 若大于此点值<大分界点值时,计入B区间;若大于“大分界点值”计入C区间。 4、最大/最小浮盈统计。显示所有统计区间内的最大浮盈点值和最小浮盈点值(亏损点值)。 5、输出完整信号,按信号出现顺序排列,如“ACCBCA”之类。 6、综合预测。使用概率、周期、趋势、马尔可夫链等综合概算输出预测该信号出现的归类概率值。 7、加载指定MA线。在当前图表自动载入相应设置的MA线。 8、自适应列宽。以完整显示统计信号数。 9、用法:点击相应统计按钮即输出相应的统计表格.
PairMaster Buy Sell Arrow Indicator for MT4 Trade Reversals Like a Pro — Catch Every Swing Point with Precision The PairMaster Buy Sell Arrow Indicator is a powerful MetaTrader 4 tool built to identify high-probability swing trading opportunities . Designed for traders who value accuracy, clarity, and simplicity, PairMaster detects key market turning points and plots intuitive buy and sell arrows directly on your chart. Key Features Accurate Swing Point Detection – Automatically identifies ma
Rtc ML Ai | Predictor CORE MACHINE LEARNING ENGINE Adaptive ML Market Predictor – Multi-Bar Trend & Candle Forecast What This Indicator Does This indicator is a  real-time market prediction engine  designed to analyze price behavior and estimate  future market tendencies . Unlike conventional indicators, this system  does not rely on static parameters or historical curve-fitting , but adapts its internal state dynamically during live market operation. Instead of using static rules, the indic
Fxland Price Reversal Zones (MT4) FXLAND Smart Reversal Indicator is a professional technical analysis tool designed to help traders identify potential price reversal zones and key market turning points with clarity and precision. The best reversal indicator and price return by choosing only one ceiling or floor in each time frame A masterpiece of combining mathematics and Gann, fractal matrix, Fibonacci, movement angle and time. Completely intelligent Key Features Detects potential pr
VTrende Pro MT4 - MTF indicator for trend trading with a display panel for MT5 *** Videos can be translated into any language using subtitles (video language - Russian) Although the signals of the VTrende Pro indicator can be used as signals of a full-fledged trading system, it is recommended to use them in conjunction with the Bill Williams TS. VTrende Pro  MT4 is an extended version of the VTrende indicator. Difference between Pro version and VTrende: - Time zones - Signal V - signal 1-2 wave
FFx Engulfing Setup Alerter gives trade suggestions with Entry, Target 1, Target 2 and StopLoss. Below are the different options available: Entry suggestion - pips to be added over the break for the entry 3 different options to calculate the SL - by pips, by ATR multiplier or at the pattern High/Low 3 different options to calculate the 2 TPs - by pips, by ATR multiplier or at Risk/Reward Offset the dashboard - any place on the chart Remove the suggestion once the price reached the SL line Lines
FFx InsideBar Setup Alerter gives trade suggestions with Entry, Target 1, Target 2 and StopLoss. Below are the different options available: Entry suggestion - pips to be added over the break for the entry Minimum candle size - to avoid too close buy/sell entry suggestions 3 different options to calculate the SL - by pips, by ATR multiplier or at the pattern High/Low 3 different options to calculate the 2 TPs - by pips, by ATR multiplier or at Risk/Reward Offset the dashboard - any place on the c
FFx OutsideBar Setup Alerter gives trade suggestions with Entry, Target 1, Target 2 and StopLoss. Below are the different options available: Entry suggestion - pips to be added over the break for the entry. 3 different options to calculate the SL - by pips, by ATR multiplier or at the pattern High/Low. 3 different options to calculate the 2 TPs - by pips, by ATR multiplier or at Risk/Reward. Offset the dashboard - any place on the chart. Remove the suggestion once the price reached the SL line.
FFx PinBar Setup Alerter gives trade suggestions with Entry, Target 1, Target 2 and StopLoss. Below are the different options available: Entry suggestion - pips to be added over the break for the entry Minimum candle size - to avoid too small candles 3 different options to calculate the SL - by pips, by ATR multiplier or at the pattern High/Low 3 different options to calculate the 2 TPs - by pips, by ATR multiplier or at Risk/Reward Offset the dashboard - any place on the chart Remove the sugges
Automatic, live & interactive picture of all trendlines. Assign push, email and sound alerts to the lines of your choice and be informed about price rollback, breakout, rollback after breakout, number of rollbacks, line expiration by double breakout. Correct, drag or delete the lines and interactively tune the line system. https://youtu.be/EJUo9pYiHFA . Chart examples https: //www.mql5.com/en/users/efficientforex Price Interaction Events All events are effective immediately and only after one
The purpose of this new version of the MT4 standard indicator provided in your platform is to display in a sub-window multiple timeframes of the same indicator with its divergences. See the example shown in the picture below. But the display isn't like a simple MTF indicator. This is the real display of the indicator on its timeframe. Here's the options available in the FFx divergences indicator: Select the timeframes to be displayed (M1 to Monthly) Define the width (number of bars) for each tim
The purpose of this new version of the MT4 standard indicator provided in your platform is to display in a sub-window multiple timeframes of the same indicator with its divergences. See the example shown in the picture below. But the display isn't like a simple MTF indicator. This is the real display of the indicator on its timeframe. Here's the options available in the FFx divergences indicator: Select the timeframes to be displayed (M1 to Monthly). Define the width (number of bars) for each ti
The FFx Dashboard MTF alerter will show you on a single chart all the timeframes (M1 to Monthly) with their own status for the indicator. 2 Alert Options: Single timeframe: each selected timeframe alert separately when a signal occurs Multi timeframes: all selected timeframes must agree for an alert to be triggered Both options have an input to select the timeframes to be used for the alert(s). How to Understand the Status: Green/Red square: histogram above/below 0 line Green square + Red bord
The FFx Dashboard MTF alerter will show you on a single chart all the timeframes (M1 to Monthly) with their own status for the indicator. 2 Alert Options: Single timeframe: each selected timeframe alert separately when a signal occurs Multi timeframes: all selected timeframes must agree for an alert to be triggered Both options have an input to select the timeframes to be used for the alert(s). How to understand the status: Green/Red square: RSI above/below 50 line Green square + Red border: R
The FFx Dashboard MTF alerter will show you on a single chart all the timeframes (M1 to Monthly) with their own status for the indicator. 2 Alert Options: Single timeframe: each selected timeframe alert separately when a signal occurs Multi timeframes: all selected timeframes must agree for an alert to be triggered Both options have an input to select the timeframes to be used for the alert(s). How to understand the status: Green/Red square: Stoch above/below 50 line Green square + Red border:
The FFx Dashboard MTF alerter will show you on a single chart all the timeframes (M1 to Monthly) with their own status for the indicator. 2 Alert Options: Single timeframe: each selected timeframe alert separately when a signal occurs Multi timeframes: all selected timeframes must agree for an alert to be triggered Both options have an input to select the timeframes to be used for the alert(s). How to understand the status: Green/Red square: Price above/below Cloud (Kumo) Green square + Red bo
The FFx Dashboard MTF alerter will show you on a single chart all the timeframes (M1 to Monthly) with their own status for the indicator. 2 Alert Options: Single timeframe: each selected timeframe alert separately when a signal occurs Multi timeframes: all selected timeframes must agree for an alert to be triggered Both options have an input to select the timeframes to be used for the alert(s). How to understand the status: Green/Red square: MA pointing Up/Down Green square + Red border: MA po
The FFx Dashboard MTF alerter will show you on a single chart all the timeframes (M1 to Monthly) with their own status for the indicator. 2 Alert Options: Single timeframe: each selected timeframe alert separately when a signal occurs. Multi timeframes: all selected timeframes must agree for an alert to be triggered. Both options have an input to select the timeframes to be used for the alert(s). How to understand the status: Green square: Price above PSAR Red square: Price below PSAR Options
The FFx Dashboard MTF alerter will show you on a single chart all the timeframes (M1 to Monthly) with their own status for the indicator. 2 Alert Options: Single timeframe: each selected timeframe alert separately when a signal occurs Multi timeframes: all selected timeframes must agree for an alert to be triggered Both options have an input to select the timeframes to be used for the alert(s). How to understand the status: Green/Red square: CCI above/below levels (ie. 100/-100) Grey square: C
The FFx Dashboard MTF alerter will show you on a single chart all the timeframes (M1 to Monthly) with their own status for the indicator. 2 Alert Options: Single timeframe: each selected timeframe alert separately when a signal occurs Multi timeframes: all selected timeframes must agree for an alert to be triggered Both options have an input to select the timeframes to be used for the alert(s). How to understand the status: Green/Red square: ADX above level Grey square: ADX below level Red bor
The FFx Dashboard MTF alerter will show you on a single chart all the timeframes (M1 to Monthly) with their own status. 2 Alert Options: Single timeframe: each selected timeframe alert separately when a signal occurs Multi timeframes: all selected timeframes must agree for an alert to be triggered Both options have an input to select the timeframes to be used for the alert(s). How to understand the status: Green/Red square: bullish/bearish candle Options available in the FFx Dashboard Alerter
The [GRAFF] III manual trading system is based on multiple MetaTrader (MT4) indicators. Together, the entire PACK of GRAFF III indicators makes an advanced trading tool. The system consists of over 20 different custom-built indicators which have been carefully selected and tested in the long term to produce strong and efficient trading signals. The particular indicators are based on different mathematical formulas, so the entire system is calibrated to remove false signals from its own indicator
FFx Universal Strength Meter PRO is more than a basic strength meter. Instead of limiting the calculation to price, it can be based on any of the 19 integrated strength modes + 9 timeframes. With the FFx USM, you are able to define any period for any combination of timeframes. For example, you can set the dashboard for the last 10 candles for M15-H1-H4… Full flexibility! Very easy to interpret... It gives a great idea about which currency is weak and which is strong, so you can find the best pai
A simplistic indicator informing a user on RSI divergence by sending messages to mobile device and email. The indicator draws 2 vertical lines, marking two RSI extrema that formed the divergence. You get the alert, open the charts and make a decision. The indicator does not show past divergences, thus when you attach it to a chart for the first time you see nothing. Graphics and alerts will appear as soon as divergences do. Drop it in Tester to see how it works. Parameters: RSIPeriod - number of
作者のその他のプロダクト
左右交易的其实都是情绪,把握情绪才是交易最终能够获得盈利的关键。 所以我这是一个「趋势氛围灯」指标,它能为您的交易图表做三件事: 1. 一眼识别市场状态 深蓝色背景   → 市场处于 强劲多头氛围 深红色背景   → 市场处于 强劲空头氛围 深灰色背景   → 市场处于 震荡平衡状态 2. 提供直观的视觉辅助 将复杂的多空力量对比 转化为最直观的背景色 让您 无需分析数据 就能感受市场情绪 在多个图表间切换时能 瞬间把握每个品种的当前强弱 3. 辅助交易决策 避免在强势多头时逆势做空 避免在强势空头时逆势做多 在震荡行情中提醒您保持观望或采用区间策略 本质上,它就像为您的交易图表安装了一个「情绪指示灯」,用颜色告诉您市场此刻的“性格”是强势上涨、强势下跌还是犹豫不决.
Long-Term Trend Top & Bottom Identification Indicator (Exclusive for Medium-to-Long-Term Trading) I. Core Orientation of the Indicator This indicator is a streamlined analysis tool   focused on long-term market trends , designed to identify   top and bottom inflection points   for trading varieties such as forex and precious metals. By filtering out interfering signals from small-to-medium cycles, it provides clear guidance for medium-to-long-term trading decisions. II. Core Functions & Chart Pr
The ADX Dashboard V11.03 is a professional MT4 indicator designed to provide traders with an intuitive visual overview of trend strength and market sentiment across multiple timeframes. It integrates ADX (Average Directional Index) and RSI (Relative Strength Index) indicators, presenting key data in a concise dashboard to help traders make quick and informed trading decisions without complex analysis of individual indicator charts. First, the installation process is straightforward. Copy the co
FiboPro 2.11 Indicator User Manual I. Overview FiboPro 2.11 is a dynamic Fibonacci support/resistance indicator for MT4. It calculates multiple Fibonacci levels via a dynamic central line and volatility, intuitively showing market trends (bullish/bearish/sideways) and identifying overbought/oversold signals. Suitable for forex, futures, stocks, etc., it’s recommended for M15+ timeframes to avoid short-term noise. II. Installation Guide Copy fiboz.mq4 to the "MQL4/Indicators" folder in your MT4
================================ ENGLISH MANUAL ================================ Product Name: One-Click Close Utility v9.4 Developer: Gemini Partner Version: 9.40 Platform: MetaTrader 4 Type: Expert Advisor I. PRODUCT OVERVIEW --------------- One-Click Close is a professional order management utility designed for  MetaTrader 4 platform. It provides rapid batch closing operations through  intuitive button interface, integrated with intelligent risk management  system. Suitable for both manual
フィルタ:
レビューなし
レビューに返信