ON Trade Channels

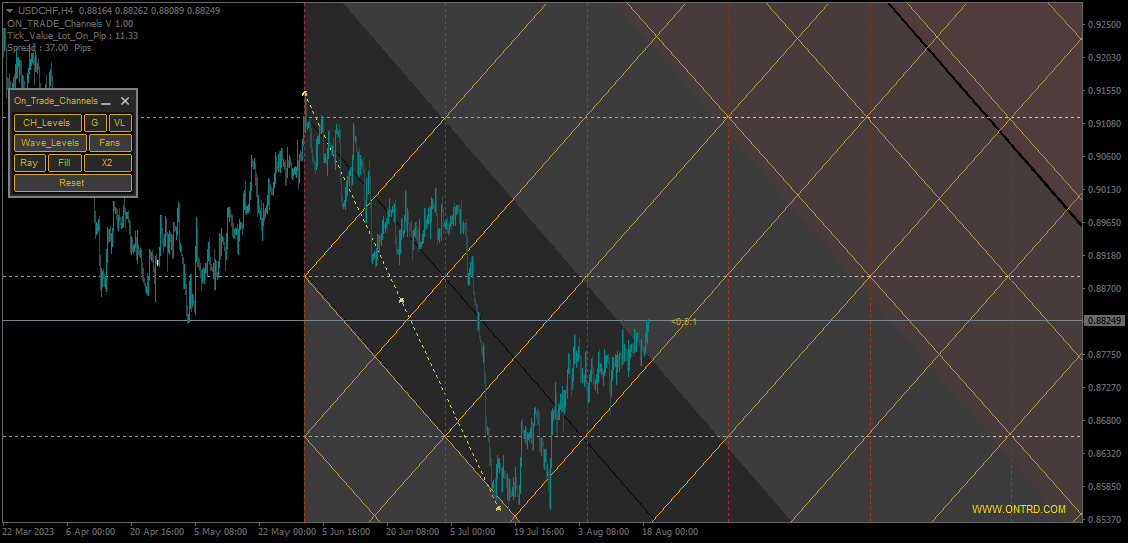
このインジケーターは、「回帰チャンネルツール」のコンセプトに基づいた堅牢な市場分析手法を提供します。このツールを活用することで、トレーダーはチャートの回帰チャンネルに対して優れたコントロールを行い、より情報を得てトレードの決定を行うことができます。

回帰チャンネルツールは、トレーダーのツールボックスにおける強力な道具です。価格トレンドや潜在的なサポートと抵抗レベルに対する貴重な洞察を提供することを目的としています。このツールは特にトレンド内の修正波動を視覚化するのに効果的であり、価格のダイナミクスの包括的なビューを提供します。

以下は、このインジケーターを使用する際の主な特徴と利点について詳しく説明します:

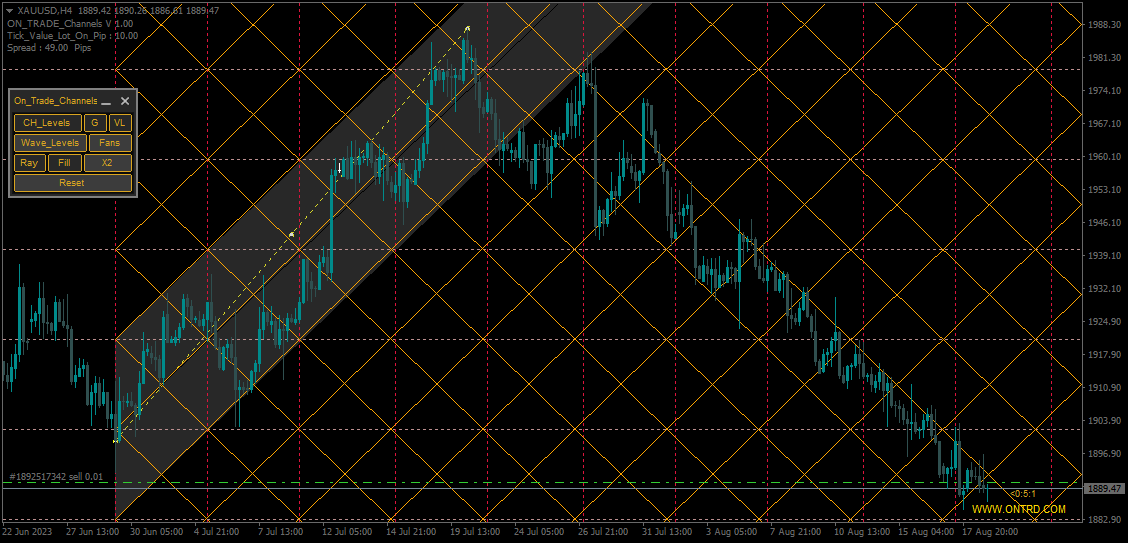
チャンネルレベルとサポート/レジスタンス: このインジケーターの主な利点の一つは、動的なサポートとレジスタンスゾーンとして機能するチャンネルレベルを生成する能力です。これらのレベルは潜在的なエントリーポイントや出口ポイントを特定するのに重要であり、トレーディング戦略の精度を向上させます。

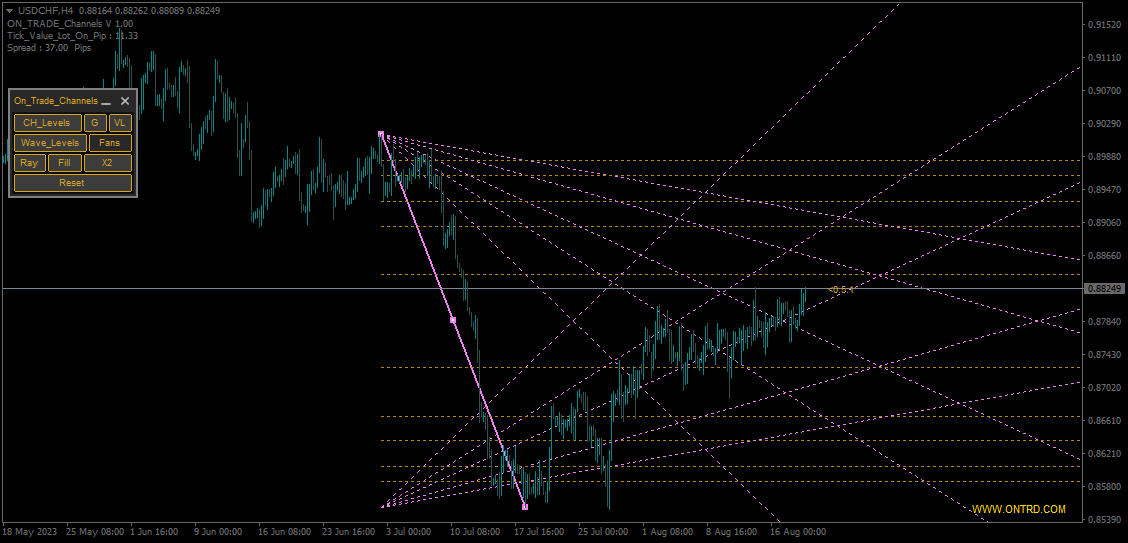
修正波動レベル: 修正波動レベルを有効にすることで、トレーダーは大きなトレンド内での潜在的な修正を見つけることができます。この機能はリトレースメントを認識するのに役立ち、有利な価格変動を活用するのに役立ちます。

直接コントロール: インジケーターのコントロールパネルにより、回帰チャンネルのシームレスな操作が可能です。トレーダーは塗りつぶしや線のオプションなどの設定を微調整でき、彼らの分析スタイルに合ったカスタマイズされたチャンネルのビューを提供します。

高い時間枠の分析: インジケーターは高い時間枠のデータを読み込む能力を持っており、トレーダーは異なる時間枠でのトレンドやチャンネルを評価するのに役立ちます。これにより市場のダイナミクスのより包括的な理解が可能となります。

使用方法:

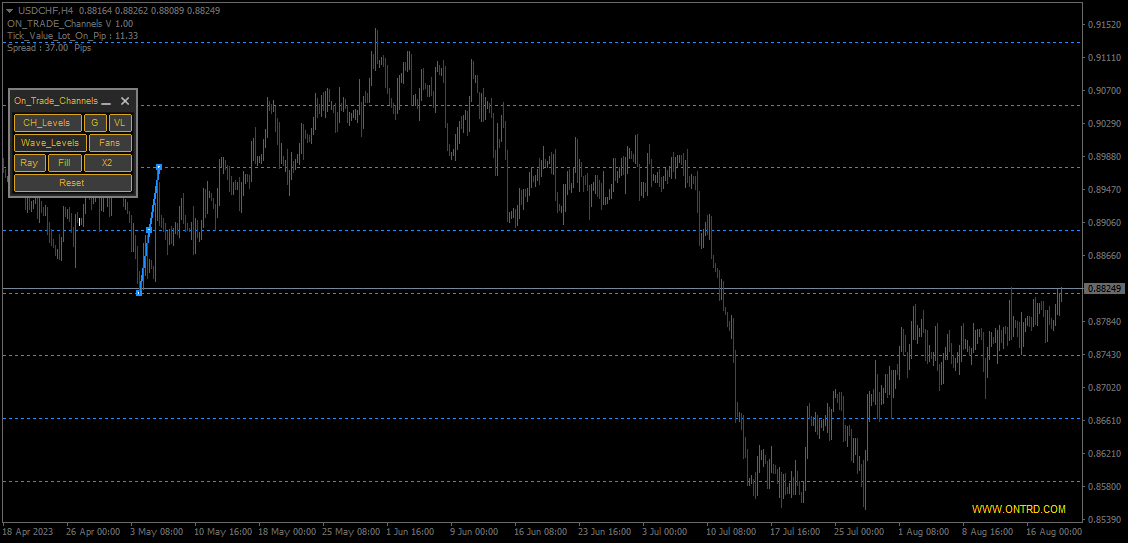
  1. トレンドラインの設定: ウェーブの動きの開始地点にトレンドラインを配置します。トレンドが上昇している場合は低値に配置し、トレンドが下降している場合は高値に配置します。

  2. トレンドラインの終了: トレンドがベアリッシュ(下降トレンド)の場合は、トレンドラインを最後の高値まで延長します。トレンドがブルリッシュ(上昇トレンド)の場合は最後の安値まで延長します。

  3. チャンネルレベルメソッド: チャンネルレベルメソッドを有効にして、潜在的なエントリーポイントや出口ポイントとなるチャンネルレベルを視覚化します。上昇トレンドの場合は上部チャンネルレベルの近くで売ることを検討します。下降トレンドの場合は下部チャンネルレベルの近くで買うことを検討します。

  4. 修正波動レベル: 修正波動に関与するには、最初の修正波動の開始地点にトレンドラインを配置します。

  5. ターゲティング: チャンネルの中心は買いポジションと売りポジションの両方の戦略的なターゲットです。

パラメータ:

  • Use_System_Theme:システムテンプレートの有効化または無効化。
  • Trends_Color:メイントレンドチャンネルの色の選択。
  • Channel_Color:チャンネル自体の色の選択。
  • Show_Center_CH_Levels:セカンダリチャンネルレベルの有効化または無効化。
  • Max_Ch_Levels:チャンネルレベルの最大数の設定。
  • Ch_Levels_Color:チャンネルレベルの色の選択。
  • Verticals_Colors:垂直チャンネルレベルの色の選択。
  • Max_Wave_Levels:修正波動レベルの最大数の設定。
  • Wave_Levels_Color:修正波動レベルの色の選択。
  • Upper_Dupilcate_Color:上位複製チャンネルの色の選択。
  • Lower_Duplicate_Color:下位複製チャンネルの色の選択。
  • Fans_Color:ファンの色の選択。
  • Show_Last_Candle_Counter:ろうそくの時間カウンターの有効化または無効化。
  • Candle_Counter_Color:ろうそくの時間カウンターテキストの色の選択。

要約すると、このインジケーターは市場トレンドを分析し、情報を得てトレードの決定を行うための包括的なツールセットをトレーダーに提供します。チャンネルレベル、サポート/レジスタンスエリア、修正波動を強調する能力により、これはどのトレーダーのアーセナルにも貴重な追加となります。このインジケーターの機能とパラメータを活用することで、トレーダーは価格ダイナミクスの理解を向上させ、トレード戦略を洗練させることができます。"

ご希望に合わせて、この翻訳を調整・修正してください。


おすすめのプロダクト
もちろんです。以下は、提供いただいたテキストの日本語への翻訳です: MT4用の天文学指標をご紹介します:究極の天体トレーディングコンパニオン トレーディング体験を天空の高みに高める準備はできていますか?私たちの革命的なMT4用の天文学指標をご紹介します。この革新的なツールは、複雑なアルゴリズムの力を借りて、類まれなる天文学的洞察と精密な計算を提供します。 あなたの指先で宇宙の情報を: 宝のような天文学的データが明らかになる包括的なパネルをご覧ください。惑星の地理的/太陽中心座標、太陽と地球の距離、星の大きさ、伸び、星座、黄道座標および赤道座標、さらには水平座標まで、それぞれが綿密に計算され美しく表示されています。指標によって生成される垂直線は時間値に対応し、トレーディングの旅に宇宙の視点を提供します。 惑星のラインと関係: グラフを飾る惑星のラインの魔法を体験し、スケールと角度をカスタマイズできます。直感的なコントロールパネルを介して各惑星のラインの表示を簡単に切り替えることができます。指定された時刻範囲内での合会、六分会、四分会、三分会、対会、逆行の指標で天体の関係の芸術を発見してく
Everyday trading represents a battle of buyers ("Bulls") pushing prices up and sellers ("Bears") pushing prices down. Depending on what party scores off, the day will end with a price that is higher or lower than that of the previous day. Intermediate results, first of all the highest and lowest price, allow to judge about how the battle was developing during the day. It is very important to be able to estimate the Bears Power balance since changes in this balance initially signalize about possi
The Trend Professor is a moving average based indicator designed for the purpose of helping the community of traders to analyse the price trend. The indicator will be displayed in the main chart as it is indicated on the screenshot section. How it works The indicator has lines of moving averages and colored histograms to depict the direction of the trend. There will be a fast signal line colored blue/yellow/red at some points. The red/yellow colored lines stands for bearish trend/signal while th
Advanced Signal System is an indicator that generates trade arrows. It generates trade arrows with its own algorithm. These arrows give buying and selling signals.  Can be used in all pairs. Sends a signal to the user with the alert feature. The indicator certainly does not repaint. Trade rules Enter the signal when the buy signal arrives. In order to exit from the transaction, an opposite signal must be received. It is absolutely necessary to close the operation when an opposite signal is rece
The indicator scans for stop grabber (special pattern of Joe Dinapoli which gives very high probability buy / sell signals and does not repaint ) signals in multiple timeframes for the all markets filtered and shows the results on Dashboard. Key Features Dashboard can be used for all markets It can scan for stop grabber pattern on MN1, W1, D1, H4, H1, M30, M15 ,M5, M1 timeframes Parameters UseMarketWatch: Set true to copy all symbols available in market watch MarketWatchCount : Set the number
Everyday trading represents a battle of buyers ("Bulls") pushing prices up and sellers ("Bears") pushing prices down. Depending on what party scores off, the day will end with a price that is higher or lower than that of the previous day. Intermediate results, first of all the highest and lowest price, allow to judge about how the battle was developing during the day. It is very important to be able to estimate the Bears Power balance since changes in this balance initially signalize about possi
This indicator Super Channel Pro indicator.Indicator displays trend movement. Indicator calculates automatically line. Features FiltPer - displays indicator channel period. deviation - displays indicator channel deviation. deviation2 - displays indicator channel deviation. How to understand the status: If the arrow is green, trend is up. If the arrow is red, trend is down. ///////////////////////////////////////////////////////////////////////////////////////////////////////////////////////////
The Squat is a function of the range of a given price bar and the volume, or TIC volume, that occurs while that range is being created. The basic idea is that high volume and little price movement indicate substantial support or resistance. The idea behind the approach to this indicator is to first look for likely Fibonacci support and resistance and then see if Squat manifests when that point is reached. The indicator determines one of the high probability patterns of DiNapoli. It does not re
Crypto_Forex MT4用インジケーター「 CHANNEL of FRACTALS 」 - このインジケーターは、フラクタルの高値/安値に基づいて、実際のローカルトレンドラインを表示します。 - グラフィカル分析を使用するトレーダーに最適です。 - レジスタンスローカルトレンドライン - 赤色。 - サポートローカルトレンドライン - 青色。 - フラクタルの数、トレンドラインの色、幅など、いくつかのパラメーターを設定できます。 - このインジケーターは、現在の市場状況を把握するのに最適です。 - 強気相場 - 両方のラインが上昇している場合。 - 弱気相場 - 両方のラインが下降している場合。 - 横ばい - 両方のラインが反対方向に動いている場合。 高品質のトレーディングロボットとインジケーターをご覧になるにはここをクリックしてください! これは、このMQL5ウェブサイトでのみ提供されるオリジナル製品です。
Scalper Terminal インターフェイス ソフトウェアはインジケーターであり、自動売買取引には関与しません。 このインジケーターは、スキャルピング取引機会が発生したときに取引を開始できる現在の取引ゾーンを示します。 スキャルピング シグナルがある場合、関連する取引ペアの右側にターコイズ色のライトが点灯し、その上に正確な取引方向が表示されます。 その後、「ターコイズ」ボタンをクリックしてトランザクションを入力します。 新しいタブが開きます。 その後、ローソク足の終値が予想され、これがスキャルピング取引に参加するための条件となります。 Scalper Terminal でスキャルピング取引取引を成功させるため; 説明セクションにあるビデオを必ずご覧ください。 兵士のように Scalper Terminal ソフトウェアに固執します。 各取引ペアの右側には、5M、15M、および DIRECTION 列があります。 まず、「通知」ボタンをクリックして緑色にします。 常に画面を見続ける必要はありません。 ターコイズ色の光信号またはメタトレーダー警告メッセージ音が鳴るのを待ってくだ
Adjustable Consecutive Fractals  looks for 2 or more fractals in one direction and sends out a on screen alert, sound alert and push notification, for strong reversal points . Adjustable Consecutive Fractals, shows the fractals on chart along with a color changing text for buy and sell signals when one or more fractals appear on one side of price. Adjustable Consecutive Fractals is based Bill Williams Fractals . The standard Bill Williams fractals are set at a non adjustable 5 bars, BUT withe th
BoxProfile MT4
Evgeny Shevtsov
4.92 (12)
The indicator displays volume profiles based on the nesting principle. Profiles periods are pre-set so that each subsequent profile has a length twice as long as the length of the previous profile. In addition to profiles, the indicator displays volume clusters sorted by color, depending on the volume they contain. Indicator operation features The indicator works on typical timeframes from M5 to MN, but for calculations uses historical data from smaller timeframes: M1 - for timeframes from M5
FREE
Candle EA MT4
Mansour Babasafary
3.68 (19)
This expert is based on patterns The main patterns of this specialist are candlestick patterns Detects trends with candlestick patterns It has a profit limit and a loss limit, so it has a low risk The best time frame to use this expert is M30 time frame The best currency pairs to use with this expert is the EURUSD, GBPUSD, AUDUSD, USDCAD currency pairs Attributes: Can be used in the EURUSD, GBPUSD, AUDUSD, USDCAD  currency pairs Can be used in M30, H1, H4 time frames Has profit limit and loss
The product has been removed from sale。 Sales suspended, do not download. 2025/1/28 The product has been removed from sale。 Sales suspended, do not download. 2025/1/28 产品已下架  产品已下架 The product has been removed from sale。Sales suspended, do not download. 2025/1/28 The product has been removed from sale。Sales suspended, do not download. 2025/1/28 产品已下架 产品已下架 The product has been removed from sale 产品已下架 The product has been removed from sale 产品已下架  The product has been removed from sale The product
平均日次範囲は、特定の期間にわたって測定された外国為替ペアの平均ピップ範囲を示します。トレーダーはADRを使用して、平均的な1日の動き以外の潜在的な価格行動を視覚化できます。 ADRが平均を上回っている場合、それは毎日のボラティリティが通常よりも高いことを意味します。これは、通貨ペアがその基準を超えて拡大している可能性があることを意味します。 ADRアナライザーは5つの主要な機能で構成されています。 範囲(ADR)スクリーナー:複数通貨のADR分析。 ADRゾーン:ADRゾーンの価格ブームの外で日中に予想される市場範囲を示します。 Xバーゾーン:ユーザーが指定したXバーのX量のブレークを表示します。 毎日の高および低ゾーン:前日の高レベルまたは低レベルの休憩を識別します。 ウィークリーハイゾーンとローゾーン:週の休憩日ハイレベルまたはローレベルを識別します。 期間限定オファー:レンジアナライザーインジケーターは、50ドルと寿命でのみご利用いただけます。 (元の価格125 $) 主な機能 マルチ通貨スクリーナー。 ADRゾーンブレイクアウト すべてのタイプのアラート(ポップ、プッ
TMoney TrendCycle
Moises Orlando Urbina Sojo
The indicator plots the trend from an EMA of "n" periods and the cycle from another EMA of "k" periods from the previous EMA. This allows the crosses to be much more effective and the amplitude of the cycle allows to verify the strength of the trend. This indicator should be used as a complementary tool to confirm market entry signals. It is possible to add three times the indicator applied to maximum price, minimum price and median price in TimeFrame of one hour for example, in order to identif
このプロジェクトが好きなら、5つ星レビューを残してください。 このインジケータは、指定されたためのオープン、ハイ、ロー、クローズ価格を描画します 特定のタイムゾーンの期間と調整が可能です。 これらは、多くの機関や専門家によって見られた重要なレベルです トレーダーは、彼らがより多くのかもしれない場所を知るために有用であり、 アクティブ。 利用可能な期間は次のとおりです。 前の日。 前週。 前の月。 前の四半期。 前年。 または: 現在の日。 現在の週。 現在の月。 現在の四半期。 現年。
FREE
OFFER!   OFFER ! After 3 weeks the unlimited price will be 500$ and in the future you will regret why you didn't make a purchase at this lowest price. Dear Traders, the atomic power Entries Indicator is one of the indicators that if used wisely and correctly can help you to find an edge over the market.  The indicator will work for all forex pairs, all markets and all timeframes. Still it is your duty to find the most effective timeframe for you. When the sell or buy arrow appears you will get a
YOU CAN NOW DOWNLOAD FREE VERSIONS OF OUR PAID INDICATORS . IT'S OUR WAY OF GIVING BACK TO THE COMMUNITY ! >>>    GO HERE TO DOWNLOAD   The system is a free open source pine script originally published on TradingView by everget   . It was converted to Mt4 by Forex Robot Makers. This system is a  popular trend indicator based on ATR ( Average True Range ) , Moving Averages and the Donchian channel . System BackGround ATR The average true range is an indicator of the price volatility of an asse
FREE
The Trends Trg indicator determines the prevailing trend. They help to analyze the market at the selected time interval. Easy to set up and works on all pairs and all time frames. Trend indicators make it possible to classify the direction of price movement by determining its strength. Solving this problem helps investors enter the market on time and get a good return. It is extremely important for any trader to correctly determine the direction and strength of the trend movement. Unfortunatel
The SniperPro(XAU-USD) trading indicator has performed well for 15 days on XAU USD.....When trading on this indicator, the order sometimes goes into a drawdown.....The indicator does not redraw!!!!!! The indicator works on time intervals M1-D1....He performed well during the release of economic news… We attach the indicator to the XAU – USD M5 chart with standard settings without changing anything.....
The Urgently indicator is designed to quickly determine the situation in the market, reflect the state of the market and signal profitable levels for opening trades. Market conditions change quickly enough, requiring constant calibration of trading strategies. Recommended for use in conjunction with any of the oscillators. The Urgently forex market trend indicator shows the trend direction and entry points. It smooths out price fluctuations when generating a signal by averaging the data and the
NM and A Professional  is a high-precision trend indicator designed  according to my personal strategy, which I have been using for many years,   for traders who value speed and reliability. It combines a proprietary system of 7 Exponential Moving Averages (EMA) with integrated levels. Fast EMA Group: Calculated using Open prices. This unique approach allows the indicator to react to market momentum faster than standard tools. Slow EMA Group: Calculated using Close prices, acting as a "concrete"
"The VIX Fix is a powerful indicator that detects market bottoms for any asset " The VIX (volatility index) is a ticker symbol of implied volatility of the S&P 500, calculated by the Chicago Board Options Exchange. VIX is a popular measure of market risk, and is one of the best measures of market bottoms that currently exists. Unfortunately, it only exists for the S&P 500... The VIX Fix was published by Larry Williams in 2007, and it synthesizes a VIX volatility index for any asset (not just the
Pips 外国為替はすぐに使える取引システムです。 このインジケーターは、いつ、どの方向で注文をオープンする必要があるかをチャート上の矢印で示します。 矢印が緑の場合は買い取引をオープンし、矢印が赤の場合は売り取引をオープンします。 すべてが非常にシンプルで非常に効果的です。 テイクプロフィットは15~25ポイントを設定。 ストップロスはポイントレベルで設定されます。 ドットが移動すると、すぐに StopLoss をオーバーライドします。 M1 と M5 の取引に推奨される時間枠。 これはスキャルピング戦略であり、最小の時間枠で最も効果的です。 通貨ペアは任意です。 推奨される通貨のうち、GBPUSD、EURUSD、XAUUSD、USDCHF を提供できます。 設定はデフォルトのままにすることができます。 この戦略を使用すると、毎日 10 ~ 20 件の取引を開始できます。 Pips 外国為替インジケーターの利点: これは、あらゆる通貨ペアに対応する既成の取引戦略です。 これは最小の時間枠 M1 および M5 で取引するためのスキャルピング取引戦略です。 この戦略は非常にシンプルで
Indicator for binary options arrow is easy to use and does not require configuration works on all currency pairs, cryptocurrencies buy signal blue up arrow sell signal red down arrow tips do not trade during news and 15-30 minutes before their release, as the market is too volatile and there is a lot of noise it is worth entering trades one or two candles from the current period (recommended for 1 candle) timeframe up to m 15 recommended money management fixed lot or fixed percentage of the depo
Break Out Signal Osw
William Oswaldo Mayorga Urduy
ユーザーマニュアル:BOS Breakout Signal (OswalTrading) BOS Breakout Signalは、構造のブレイク(Break of Structure)を取引するトレーダーのために特別に設計された、MetaTrader用の高精度ツールです。このインジケーターは、ランダムな信号でチャートを混乱させることはありません。代わりに、最適化されたZigZagアルゴリズムを使用して市場のノイズをフィルタリングし、ブレイクを確認する前に最も重要なサポートおよびレジスタンスレベルのみを特定します。 1. 目的と機能 このシステムは構造スキャナーとして機能します。開始時、価格が明確な振動を展開する必要があるため、インジケーターがすぐに信号を表示しない場合があります。市場が有効な反転パターンを確立すると、インジケーターは目に見えない「アクティベーション」レベルをプロットします。価格がこれらのレベルを力強くブレイクすると、エントリー信号が生成されます。 2. パラメーターガイド(入力メニュー) ZigZagアルゴリズム設定 Depth(深度):動きの振幅を決定します。
Accumulation/Distribution Technical Indicator is determined by the changes in price and volume. The volume acts as a weighting coefficient at the change of price – the higher the coefficient (the volume) is, the greater the contribution of the price change (for this period of time) will be in the value of the indicator. In fact, this indicator is a variant of the more commonly used indicator   On Balance Volume . They are both used to confirm price changes by means of measuring the respective vo
Simple QM Pattern is a powerful and intuitive trading indicator designed to simplify the identification of the Quasimodo (QM) trading pattern. The QM pattern is widely recognized among traders for effectively signaling potential reversals by highlighting key market structures and price action formations. This indicator helps traders easily visualize the QM pattern directly on their charts, making it straightforward even for those who are new to pattern trading. Simple QM Pattern includes dynamic
FREE
バイナリオプション取引の世界では、正確な市場分析と戦略的な意思決定が重要です。利益を生むチャンスを開拓するための優れた取引インジケーターを求める旅は終わりません。秘密のインジケーターが登場します。これはMT4バイナリオプション取引ツールで、そのクラスで最も優れた、最も強力な評判を築いています。 秘密のインジケーターは、熟練したトレーダーとエキスパートプログラマーのチームによる、年単位の入念な研究、開発、テストの結果です。独自のアルゴリズムと高度な数学モデルは、バイナリオプションの高速な世界でトレーダーに無類の優位性を提供するように微調整されています。 秘密のインジケーターを他の取引インジケーターとは異なるものにするのは、驚くべき正確さで利益を生む取引のチャンスを見つける能力です。そのシグナルは、強力なテクニカルインジケーター、価格行動分析、市場センチメント評価の組み合わせから派生しています。この多面的なアプローチにより、秘密のインジケーターは短期の変動と長期のトレンドの両方を捉え、トレーダーに市場の包括的な視点を提供します。 秘密のインジケーターの中でも際立った特徴の1つは、そ
このプロダクトを購入した人は以下も購入しています
「 Dynamic Scalper System 」インジケーターは、トレンド波の中でスキャルピング取引を行う手法のために設計されています。 主要通貨ペアと金でテスト済みで、他の取引商品との互換性があります。 トレンドに沿った短期的なポジションオープンのシグナルを提供し、追加の価格変動サポートも提供します。 インジケーターの原理 大きな矢印はトレンドの方向を決定します。 トレンド波の中では、小さな矢印の形でスキャルピングシグナルを生成するアルゴリズムが機能します。 赤い矢印は強気方向、青い矢印は弱気方向です。 トレンドの方向には敏感な価格変動ラインが描かれ、小さな矢印のシグナルと連動します。 シグナルは次のように機能します。適切なタイミングでラインが現れるとエントリーシグナルが形成され、ラインが開いている間はポジションが保持され、完了すると取引が終了します。 推奨される動作時間枠はM1~H4です。 矢印は現在のローソク足に形成され、次のローソク足が開いている場合は、前のローソク足の矢印は再描画されません。 入力パラメータ Trend Wave Period - トレンド方向
Linear Trend Predictor ー - エントリ ポイントと方向サポート ラインを組み合わせたトレンド インジケーター。高値/安値チャネルを突破するという原理に基づいて機能します。 インジケーターのアルゴリズムは市場のノイズをフィルタリングし、ボラティリティと市場の動向を考慮します。 インジケーターの機能  平滑化手法を使用して、市場のトレンドと、買い注文または売り注文を開くためのエントリー ポイントを表示します。  任意の時間枠のチャートを分析して、短期および長期の市場の動きを判断するのに適しています。  あらゆる市場や時間枠に適応可能な入力パラメータにより、トレーダーはインジケーターを独自にカスタマイズできます。  設定されたインジケーター信号は消えず、再描画もされません。ローソク足の終値で決定されます。  いくつかの種類の通知が矢印と組み合わされています。  このインジケーターは、独立した取引システムとして使用することも、他の取引システムへの追加として使用することもできます。  あらゆるレベルの経験を持つトレーダーが使用できます。 主なパラメータ Vol
Miraculous Indicator – ガン・スクエア・オブ・ナインに基づく100%非リペイントのFXおよびバイナリーツール この動画では、FXおよびバイナリーオプションのトレーダー向けに特別に開発された、非常に正確で強力な取引ツールである Miraculous Indicator を紹介しています。このインジケーターがユニークなのは、伝説的な ガン・スクエア・オブ・ナイン と ガンの振動の法則 に基づいている点で、現代の取引で利用できる最も正確な予測ツールの一つとなっています。 Miraculous Indicatorは 完全に非リペイント であり、ローソク足が確定した後にシグナルが変化したり消えたりすることはありません。つまり、見たものがそのまま利用できます。これにより、トレーダーは自信を持ってエントリーおよびエグジットを行うための信頼性と一貫性のある根拠を得ることができます。 主な特徴: ガン・スクエア・オブ・ナインとガン理論に基づいて構築 100%非リペイントのシグナルシステム すべての時間枠(M1、M5、H1、H4、日足、週足)で機能 FXおよびバイナリーオプション取引
Добрый День уважаемые трейдеры!  Вашему вниманию индикатор созданный и работающий на базе трендовика ADX,  для торговли на смене направления движения который учитывает коррекцию и даёт возможность на ней заработать.  Применяю этот индикатор для скальпинга. Рекомендую таймфреймы от 15 ти минутного(М15) до часового (Н1) периодов.  Красный кружок сигнал на продажу- Sell) Зелёный кружок  сигнал на покупку Buy) Чем меньше ваш таймфрейм тем меньше пунктов вы зарабатываете.   Важно выставлять стопы! !В
Precautions for subscribing to indicator This indicator only supports the computer version of MT4 Does not support MT5, mobile phones, tablets The indicator only shows the day's entry arrow The previous history arrow will not be displayed (Live broadcast is for demonstration) The indicator is a trading aid Is not a EA automatic trading No copy trading function The indicator only indicates the entry position No exit (target profit)  The entry stop loss point is set at 30-50 PIPS Or the front hi
ゴールドラッシュ・トレンド・アロー・シグナル ゴールドラッシュ・トレンド・アロー・シグナル 指標は、XAU/USDにおける高速・短期スキャルパー向けに最適化された、正確でリアルタイムのトレンド分析を提供します。 1分足専用に設計されたこのツールは、明確なエントリーポイントを示す方向矢印を表示し、スキャルパーが変動の激しい市場状況でも自信を持って取引できるよう支援します。 この指標は、PRIMARY(主要)とSECONDARY(補助)のアラート矢印で構成されています。PRIMARYシグナルは、トレンドの方向転換を示す白と黒の方向矢印であり、SECONDARYシグナルは、PRIMARY矢印が示す方向を確認し、潜在的なエントリーポイントを示す青と赤の矢印です。 注意:トレンド方向の変化後にPRIMARYアラート矢印が1つだけ表示される場合、複数のSECONDARY青/赤矢印が表示される点に注意が必要です。SECONDARYシグナルは、シグナル基準を満たす任意のローソク足後に表示されます。したがって、長期的なトレンド移動の場合、画面に多くのSECONDARY矢印が表示されます(添付の
Pulse Scalping Line - an indicator for identifying potential pivot points. Based on this indicator, you can build an effective Martingale system. According to our statistics, the indicator gives a maximum of 4 erroneous pivot points in a series. On average, these are 2 pivot points. That is, the indicator shows a reversal, it is erroneous. This means that the second signal of the indicator will be highly accurate. Based on this information, you can build a trading system based on the Martingale
El indicador "MR BEAST ALERTAS DE LIQUIDEZ" es una herramienta avanzada diseñada para proporcionar señales y alertas sobre la liquidez del mercado basándose en una serie de indicadores técnicos y análisis de tendencias. Ideal para traders que buscan oportunidades de trading en función de la dinámica de precios y los niveles de volatilidad, este indicador ofrece una visualización clara y detallada en la ventana del gráfico de MetaTrader. Características Principales: Canal ATR Adaptativo: Calcula
Meravith
Ivan Stefanov
5 (3)
マーケットメーカーのためのツール。 Meravith は次の機能を提供します: すべての時間足を分析し、現在有効なトレンドを表示します。 強気と弱気の出来高が等しくなる流動性ゾーン(出来高均衡)を強調表示します。 異なる時間足のすべての流動性レベルをチャート上に直接表示します。 テキスト形式の市場分析を生成し、参考情報として表示します。 現在のトレンドに基づいて目標値、サポートレベル、ストップロスを計算します。 取引のリスクリワード比を算出します。 口座残高に基づいてポジションサイズを計算し、潜在的な利益を推定します。 また、市場に大きな変化があった場合には警告を表示します。 インジケーターの主要ライン: 強気/弱気の出来高エグゾーストライン ― 目標値として機能します。 市場のトレンドを示すライン。市場が強気か弱気かによって色が変わり、トレンドのサポートとして機能します。主にその色が市場センチメントを示します。 出来高均衡ライン(Eq)。Eq(Volume Equilibrium)ラインはシステムの中核です。これは買い手と売り手の出来高のバランスポイントを表します。市場の流動性を示し
F-16 Plane Indicatorをご紹介します。これは、取引体験を革新するために設計された最先端のMT4ツールです。F-16戦闘機の無類のスピードと精度に触発され、このインジケーターは高度なアルゴリズムと最新技術を組み合わせ、金融市場で比類のないパフォーマンスを提供します。 F-16 Plane Indicatorを使用すると、リアルタイムの分析と高精度な取引シグナルの生成が可能で、競争相手を圧倒します。ダイナミックな機能により、さまざまな資産クラスで利益を見つけることができ、自信を持って的確な決定を行うことができます。 使いやすいインターフェースを備えたF-16 Plane Indicatorは、人気のあるMetaTrader 4プラットフォームとシームレスに統合され、スムーズで効率的な取引プロセスを実現します。初心者のトレーダーでも経験豊富なプロフェッショナルでも、このインジケーターは独自の取引スタイルと好みに合わせて簡単にカスタマイズすることができます。 F-16 Plane Indicatorのパワーを体感し、市場のトレンドを精密かつ敏捷にナビゲートします。高度なチャー
GEM Signal Pro GEM Signal Pro は、MetaTrader 4 向けのトレンドフォロー型インジケーターです。より明確なシグナル、より整理されたトレードセットアップ、そして実用的なリスク管理をチャート上で確認したいトレーダーのために設計されています。 単純な矢印だけを表示するのではなく、GEM Signal Pro はトレード全体の考え方を、より見やすく分かりやすい形で表示します。条件が確認されると、インジケーターはエントリー価格、ストップロス、利確目標をチャート上に表示し、トレードセットアップをより効率的に確認できるようにします。 動作の仕組み このインジケーターは、まず内部ロジックに基づいて有効なシードシグナルを検出します。 確認条件が満たされると、GEM Signal Pro はチャート上に完全なセットアップを表示します。これにより、トレーダーはトレード構造をより明確に把握し、手作業による分析を減らすことができます。 チャート上のトレードレベル 確認済みシグナルに対して、GEM Signal Pro は以下を表示できます。 エントリー価格 ストップロス テ
Product Name:   Quantum Regime Indicator Short Description:   A multi-engine structural regime and volatility filter. Description: Quantum Regime Indicator (QRI) is a sophisticated technical analysis algorithm designed to identify market structure shifts and volatility regimes. Unlike standard indicators that rely on immediate price action, QRI utilizes a hierarchical logic architecture to filter market noise and identify statistical extremes. The indicator is built on the philosophy of "Market
PairMaster Buy Sell Arrow Indicator for MT4 Trade Reversals Like a Pro — Catch Every Swing Point with Precision The PairMaster Buy Sell Arrow Indicator is a powerful MetaTrader 4 tool built to identify high-probability swing trading opportunities . Designed for traders who value accuracy, clarity, and simplicity, PairMaster detects key market turning points and plots intuitive buy and sell arrows directly on your chart. Key Features Accurate Swing Point Detection – Automatically identifies ma
Weis Wave with Alert
Trade The Volume Waves Single Member P.C.
4.82 (22)
Rental/Lifetime Package Options and Privileges' Rent Monthly Six Months   Yearly/Lifetime Weis Wave with Speed with Alert+Speed Index x x x Manual  x x x Quick Set up Video x x x Blog x x x Lifetime Updates x x x Setup and Training Material x x Rectangle Break Alert Tool      x Discord Access Channel "The SI traders" x   How to trade info visit:    http://www.tradethevolumewaves.com   ** If you purchase please contact me to setup your  : training Room and  complete manual access.  This is
The Nihilist 5.0 Indicator includes Forexalien and Nihilist Easy Trend trading strategies and systems. It is composed of an MTF Dashboard where you can analyze the different input possibilities of each strategy at a glance. It has an alert system with different types of configurable filters. You can also configure which TF you want to be notified on your Metatrader 4 platform and Mobile application The indicator has the option to view how could be a TP and SL by using ATR or fixed points, even w
"Dragon's Tail" is an integrated trading system, not just an indicator. This system analyzes each candle on a minute-by-minute basis, which is particularly effective in high market volatility conditions. The "Dragon's Tail" system identifies key market moments referred to as "bull and bear battles". Based on these "battles", the system gives trade direction recommendations. In the case of an arrow appearing on the chart, this signals the possibility of opening two trades in the indicated directi
Currently switched to the 4 hour chart - but use other time frames for confirmation. :-)  I change my main time frame based on the market movement at the time. The Hurricane Forex Indicator is a multi time frame indicator that includes such things as Trade Notifications, Trade Calculator, Momentum Indicator, risk reward and much more. We have a free Trade room for our users as well. Please check out the video for full details of how this indicator works as it has over 15 years worth of developme
ZeusArrow Smart Liquidity Finder  Smart Liquidity Finder is Ai controlled indicator based on the Idea of Your SL is My Entry. It scan and draws the major Liquidity areas on chart partitioning them with Premium and Discount Zone and allows you find the best possible trading setups and help you decide the perfect entry price to avoid getting your Stop Loss hunted . Now no more confusion about when to enter and where to enter. Benefit from this one of it's kind trading tool powered by Ai an trade
This indicator depends on some secrets equations to draw Signals with Stop loss and maximum 4 Take profits. There is a free EA depends on this indicator as a gift when you purchase/rent it. Features Simply it gives you entry point as Ready sign (Buy / Sell) and arrow (Buy / Sell) after candle closed, also SL line and 4 TP lines or less. Once SL-TP lines are shown with the arrow, they remains as they are until signal change. It is historical indicator. No Repaint. user manual for V5 please click
Naked Forex Kangaroo Tail Pro Indicator Kangaroo Tail Pro Indicator is a pattern recognition indicator for Forex, Stocks, Indices, Futures, Commodities and Cryptos. The Kangaroo Tail is a multi-bar pattern. The Kangaroo Tail pattern is very effective and is very simple to trade. The strategy that comes with the Kangaroo Tail is based on price action. The indicator does what it was designed for: displaying Kangaroo Tail patterns.   Don't expect to follow the up and down arrows and make money
Algo Trading Indicaor  With this indicator , you’ll have zones and trends that hight probability the price will reverse from it. so will gives you all the help that you need  MT5 Version                    https://www.mql5.com/en/market/product/170028 MT4 Version                    https://www.mql5.com/en/market/product/88034 Why should you join us !?  1-This indicator is logical since it’s working in previous days movement , to predict the future movements. 2-Algo trading indicator will hel
Bomb Bank Signal
Igor Pereira Calil
5 (1)
Bomb Bank シグナル: MetaTrader 4 の信頼度インジケーター Bomb Bank Signal は、金融市場で最も関連性の高いトレンドを特定するように設計された MetaTrader 4 の強力なインジケーターです。動きを正確に予測するツールをお探しなら、Bomb Bank が最適です。 仕組み: このインジケーターは、出来高分析、ローソク足終値、対称トレンドという 3 つの異なる方法を組み合わせて、売買の機会を検出してシグナルを送ります。 Bomb Bank は、買いの機会を特定するときは「爆弾」のようなものであり、売りシグナルを検出するときは「ドクロ」のようなものです。 ボムバンクはなぜ違うのですか? 完全な信頼性: Bomb Bank Signal は信号を削除しません。一度シグナルが発せられると、シグナルは残り続けるので、チャンスを逃すことはありません。 極めて高い精度: Bomb Bank は誤った信号を送信しません。リアルタイムで最新情報を更新し、市場の進化に合わせて調整しながら、以前のシグナルの透明性を維持します。 ライブアップデート: シ
BinaryIndicator is a highly accurate indicator for trading binary options. It shows excellent results in scalping. This indicator is based in multifactor analysis of trend indicators, as well as confirmation oscillators, which in the end gives an increased accuracy of signals. Advantages of the indicator Increased accuracy of signals. Excellent results when trading binary options with a short expiration time from M30 to M1 . It works on any timeframes. Works with any trade symbols. Parameters
OrderFlow Absorption – MT4用プロフェッショナル・デルタ&アブソープションシグナルインジケーター OrderFlow Absorptionで本物のオーダーフロー分析の力を解き放ちましょう。MetaTrader 4向けの究極のデルタヒストグラム&アブソープションシグナルインジケーターです。あらゆる価格変動の裏側で何が起きているのかを知りたいトレーダーのために設計されており、市場を動かす隠れた買い/売り圧力や吸収イベントを明らかにします。 特徴 デルタヒストグラムの可視化:   買い圧力・売り圧力を色分けされたヒストグラムで即座に表示。 アブソープションシグナル検出:   高度なロジックで強気・弱気の吸収イベントを特定し、反転の兆しを早期に通知。 チャートマーカー:   吸収シグナルをチャート上に直接マークし、視覚的に分かりやすく表示。 ポップアップアラート:   新しい吸収シグナルが出現した際にリアルタイムで通知。 カスタマイズ可能な閾値:   弱いシグナルを除外し、高確率のセットアップに集中。 リソース管理:   大きなチャートでも高速に動作する効率的な計算。
Gold Channel is a volatility-based indicator, developed with a specific timing algorithm for the XAUUSD pair, which consists of finding possible corrections in the market. This indicator shows two outer lines, an inner line (retracement line) and an arrow sign, where the theory of the channel is to help identify overbought and oversold conditions in the market. The market price will generally fall between the boundaries of the channel. If prices touch or move outside the channel it is a tradi
Rtc ML Ai | Predictor CORE MACHINE LEARNING ENGINE Adaptive ML Market Predictor – Multi-Bar Trend & Candle Forecast What This Indicator Does This indicator is a  real-time market prediction engine  designed to analyze price behavior and estimate  future market tendencies . Unlike conventional indicators, this system  does not rely on static parameters or historical curve-fitting , but adapts its internal state dynamically during live market operation. Instead of using static rules, the indic
ECM Elite Channel is a volatility-based indicator, developed with a specific time algorithm, which consists of finding possible corrections in the market. This indicator shows two outer lines, an inner line (retracement line) and an arrow sign, where the channel theory is to help identify overbought and oversold conditions in the market. The market price will generally fall between the boundaries of the channel. If prices touch or move outside the channel, it's a trading opportunity. The ind
*This is tradingview indicator converted to mql4* The Chandelier Exit Indicator is a popular technical analysis tool developed by Chuck LeBeau. It is designed to help traders identify potential exit points for their trades based on market volatility and the concept of trailing stops. The Chandelier Exit Indicator consists of three main components: Average True Range (ATR): The indicator utilizes the Average True Range, which measures market volatility. The ATR calculates the average range betwe
ConfluencePro v2.0 – Ultimate Confluence Indicator for Binary Options & Forex Professional Multi-Filter Signal System with Dashboard, News Filter & Real-Time Statistics ConfluencePro v2.0 is the most advanced confluence-based indicator ever released on the MQL5 Market. It combines 17+ professional filters (Trend, Smart Money Concepts, Market Structure, Divergence, MTF Confirmation, News Events, Volume, Regime Detection and more) into a single, easy-to-read confluence score (0–100%). Only the hi
What indicator do you look at most on your MT4 charts? Is it the Moving Average? I d o not believe that the default grid lines on MT4 charts—which you likely see hundreds or thousands of times—are designed with the intent of helping the user win. This is why MT4 users apply various indicators and go through trial and error. Because it is a chart you look at every day, it must present reliable information that we humans can recognize intuitively. This indicator was born from a single core concep
作者のその他のプロダクト
ON Trade Waves Patterns Harmonic Elliot Wolfeをご紹介します。これは手動および自動の方法を使用して市場のさまざまなパターンを検出するために設計された高度なインジケーターです。以下はその動作方法です: ハーモニックパターン: このインジケーターは、チャートに表示されるハーモニックパターンを識別できます。これらのパターンは、Scott Carneyの「Harmonic Trading vol 1および2」で説明されているように、ハーモニックトレーディング理論を実践するトレーダーにとって重要です。手動で描画するか、自動検出に頼るかにかかわらず、ON Trade Waves Patternsがお手伝いします。 コントロールパネル: このインジケーターはユーザーフレンドリーなコントロールパネルを備えています。チャートと時間枠の設定を保存し、異なる構成間をスムーズに切り替えることができます。チャートスペースを最大限に活用するために最小化することもできます。他の分析ツールで作業することを好む場合、閉じるボタンをクリックするだけで、すべてのインジケーターデ
Gannスクエアインジケーターは、W.D. Gannによって執筆された「市場予測のための数学的な式」の記事に基づく強力な市場分析ツールです。このツールは、解析に数学的な概念を応用し、Gann理論に基づいています。それは、144、90、52のスクエアや9のスクエアなど、Gannの関連テクニックの要素を取り入れています。さらに、の方法を組み込んでおり、9のスクエアとその関連性についてのチャネルやスターパターンに焦点を当てています。 ユーザーマニュアルと使用方法: このインジケーターを使用する前に、ユーザーマニュアルを読んで疑問点を解決するためにお問い合わせいただくことをお勧めします。ユーザーマニュアルの完全版は、当社のウェブサイトで入手できます。 MT5の完全版は購入できますし、MT4の無料版も試すことができます。両方のバージョンへのリンクを提供していますので、ご利用ください。 主な機能と機能: Gannスクエアインジケーターは、市場分析のための完全なツールセットを提供し、幾何学的な概念とGann理論に基づいて的確な判断を行う手助けをします。以下に主な機能を示します。 9のスクエアの分析:
もちろんです。以下は、提供いただいたテキストの日本語への翻訳です: MT4用の天文学指標をご紹介します:究極の天体トレーディングコンパニオン トレーディング体験を天空の高みに高める準備はできていますか?私たちの革命的なMT4用の天文学指標をご紹介します。この革新的なツールは、複雑なアルゴリズムの力を借りて、類まれなる天文学的洞察と精密な計算を提供します。 あなたの指先で宇宙の情報を:   宝のような天文学的データが明らかになる包括的なパネルをご覧ください。惑星の地理的/太陽中心座標、太陽と地球の距離、星の大きさ、伸び、星座、黄道座標および赤道座標、さらには水平座標まで、それぞれが綿密に計算され美しく表示されています。指標によって生成される垂直線は時間値に対応し、トレーディングの旅に宇宙の視点を提供します。 惑星のラインと関係:   グラフを飾る惑星のラインの魔法を体験し、スケールと角度をカスタマイズできます。直感的なコントロールパネルを介して各惑星のラインの表示を簡単に切り替えることができます。指定された時刻範囲内での合会、六分会、四分会、三分会、対会、逆行の指標で天体の関係の芸術を発
もちろんです、以下はあなたの投稿の日本語への翻訳です: "このインジケーターは、シンプルなトレンド検出ツールです。 スキャルピングモードなど、良いエントリーを得るために戦略と組み合わせて使用できます。 価格の周りにチャンネルを描画し、時間の経過とともに拡張されます。カスタム期間では、アルゴリズムによって時間と価格を一緒に考慮し、拡張の始点に戻ります。 逆転の兆候が現れた後、チャネルの下限で買うことができます。 逆転の兆候を見た後、チャネルの上限から売ることができます。 パラメータ: システムのテーマを使用:ここからテーマを選択できます。 計算タイプ:次の3つのオプションから選択できます。 1- オリジナルの計算:このエリアは、その日のトレンドを定義し、このエリアよりも上または下で開く場合のトレンドを定義します。 2- 新しい計算:トレンドを検出するために依存するチャンネルを描画します。 3- Sheph:新しい計算方法と互換性のないシンボル上に描画される修正されたチャンネルです。" 何か他に質問があるか、またはもっとお手伝いが必要な場合は、お気軽にお知らせください!
もちろん、こちらが日本語への翻訳です: "このインジケーターは、バイストラ・パターン理論に基づいてエントリーを検出し、エントリー値を提供し、ターゲットとストップのレベルでリミットオーダーを配置します。これにより、リスクの割合を計算できます。 注意事項: このインジケーターにはEAで使用できるバッファがあります。 この製品を使用する際には、良好なマネーマネジメントを実践することが重要です。 タイムフレームを変更すると、 インジケーターは前回のセッションで使用したテンプレートを保存します。 この方法を学ぶための書籍が必要な場合は、購入後にお知らせいただくか、ご購入後にご意見をお寄せください。 パラメーター: システムビジュアルを使用 - この製品の視覚的なテーマを有効/無効にします。 スピードに関連 - 最後の波の速い動きのみでパターンを検出するを有効/無効にします。 最後のキャンドルカウンターを表示 - キャンドルタイマーを有効/無効にします。 キャンドルカウンターの色 - キャンドルタイマーのテキストの色。 上昇パターンの色 - 上昇パターンの色。 下降パターンの色 - 下降パターンの
このインジケーターは、トレードチャート上でドンチャンチャネルを視覚的に表現するためのものです。ドンチャンチャネルは、特定の期間における最高値と最低値の間の範囲を描画するためのシンプルなテクニカルツールです。このインジケーターは、価格動向の視覚的な分析を向上させ、潜在的なブレイクアウトとトレンドの継続ポイントに関する洞察を提供します。ドンチャンチャネルは、現在の時間枠とより高い時間枠の両方に適用できるため、このオプションを有効にすることができます。 インジケーターの主な特徴: Use_System_Visuals: このパラメータを有効にすると、システムの視覚スタイルとインジケーターの外観を切り替えることができます。有効にすると、インジケーターの視覚的要素はトレードプラットフォーム全体のテーマに合わせられます。 Signal_from_HT_Timeframe: このオプションを有効にすると、より高い時間枠からのシグナルを受信できます。言い換えれば、現在の時間枠でのトレーディングの決定に影響を与えるために、より長い時間枠でのドンチャンチャネルの動作を考慮できます。 HT_Timefram
FREE
Introducing the Pivot Point Selector Indicator: Your Ultimate Tool for Custom Pivot Levels Are you ready to take your trading to the next level? Say hello to the Pivot Point Selector Indicator, a game-changing tool that puts you in control of your pivot levels. This innovative indicator empowers you to choose three specific points that will determine the pivot level calculations, giving you unparalleled customization and precision in your trading strategy. Key Features and Benefits: Custom Pivo
FREE
ゴールドグラム価格計算ツールインジケーターのご紹介 地域通貨における金価格を常に把握したいですか?もっと探す必要はありません。ゴールドグラム価格計算ツールインジケーターは、お好きな地域通貨でグラム当たりの金価格をリアルタイムで計算できる画期的なツールを提供します。このインジケーターを使用することで、金融洞察力を活用して情報に基づいた意思決定ができます。 主な特徴: 地域化された金価格: ゴールドグラム価格計算ツールインジケーターは、特定の地域通貨での金属のグラム単位の価格、具体的には金のグラム単位の価格を提供します。これにより、身近な通貨で金の価値を便利に追跡できます。 ユーザーフレンドリーな設定: 当インジケーターは利便性を考慮して設計されています。インジケーターの設定から直接調整するか、メインチャート上で調整することができ、シームレスで個別の体験が可能です。 パラメータの説明: Use_System_Theme (システムテーマを使用): 好みのカラースキームを選択するオプションで、インジケーターの視覚的な外観を取引環境に簡単に統合できます。 Ounce_Value (オンス価値)
FREE
ON Trade Pivots is A technical indicator that Draws all Pivot levels depending on time frame that defined in settings. Notes It will be good tool for all traders who use pivot levels in their trades. Let me inform you that this indicator draw this level as buffers not as objects then you can connect it easily to EA. This indicator allow you to find pivots levels for any time frame not only daily you are free to choose time frame from settings. Parameters Use_System_Visuals - Enable /Disable Sy
FREE
このインジケーターは、エリオット波動理論と組み合わせて作動し、2つの方法で使用されます: 自動モード: このモードでは、インジケーターがチャート上の全ての5つのモーティブ波を自動的に検出し、予測とポテンシャルな逆転ゾーンを提供します。また、アラートやプッシュメッセージを生成する能力も備えています。この自動機能により、エリオット波動パターンの識別と分析のプロセスが効率化されます。 手動モード: このオプションは、エリオット波動理論を手動で扱いたいトレーダー向けです。9つの段階を使用して波を描画することができます。各段階は、表示された後に描画されたラインを調整して個別に定義できます。この機能により、手動で波を描画するプロセスがより効率的になります。重要な点として、すべての描画データが将来の参照のためにプラットフォームのデータフォルダに保存されることに注意してください。 パラメータ: Name: インジケーターの名前。 Use_System_Visuals: インジケーターのテーマを有効または無効にして、取引プラットフォーム全体の外観に合わせます。 Explain_Comment: 波の番号
"私たちの強力な外国為替インジケーターをご紹介します。これは、トレード戦略を向上させ、市場のトレンドについて正確な洞察を提供するために設計されました。この先進のツールは、蝋燭の測定を詳細に分析し、最適な精度を得るために調整を行う複雑なカスタムアルゴリズムを使用しています。その結果、戦略的なエントリーポイントを示すチャート上に巧みにプロットされた矢印のセットが得られます。 このインジケーターの素晴らしさは、蝋燭のパターンの力を活用し、それらを慎重に調整された調整と組み合わせる能力にあります。これにより、市場の動きに対する独自の視点が提供され、トレードの意思決定に優位性が生まれます。 このインジケーターの際立った特徴の1つは、H1時間枠での優れたパフォーマンスです。この時間枠に特化したトレーダーは、正確なエントリーポイントの多くを提供することがわかるでしょう。ただし、私たちは相乗効果の力を信じています。このインジケーターは単独で強力なツールですが、より広範なトレード戦略に組み込まれると、そのパフォーマンスはさらに向上します。既存のアプローチと組み合わせることで、その真のポテンシャルが発揮さ
このインジケーターは、ガン理論に基づく特定のパターンであるダイヤモンドガン波を検出して可視化するために設計されています。このインジケーターは、パターンのABCポイントに基づいてポイント(P)を描画することで、市場の反転の可能性についてトレーダーに洞察を提供します。さらに、インジケーターは予測されたポイント(P)から垂直線を引いて、トレーダーが潜在的な反転ポイントをより簡単に特定できるようサポートします。 インジケーターの特徴: Use_System_Visuals:このパラメーターを有効にすると、インジケーターの外観にシステムのビジュアルテーマを使用するかどうかを切り替えることができます。このオプションを有効にすると、インジケーターのビジュアル要素が取引プラットフォーム全体のテーマと一致します。 Show_Last_Candle_Counter:このオプションを有効にすると、現在のローソク足が終了するまでの残り時間を示すカウンターが表示されます。このタイマーは、特定のローソク足のパターンや時間間隔に依存するトレーダーにとって役立つ場合があります。 Candle_Counter_Colo
もちろん、こちらが「Fibo Star」という指標についての詳細な説明です。これはFibonacciファンを星の形でチャートに描画するためのもので、価格の動きに効果的であり、描画と設定を行う際の手間を減らすためのコントロールパネルもサポートされています。 使用方法: この指標は手動の使用になります。効果的に使用するためには、以下の手順に従ってください: チャート上でFibonacciファンを描画するための高値と安値のポイントを特定します。 これらの高値と安値に紫色のラインを置きます。 価格がこれらのラインに到達するのを待ち、それらがサポートと抵抗のラインとして機能するのを観察します。 パラメータ: Use_System_Theme: このパラメータを使用して、外観をトレーディングプラットフォーム全体のテーマに合わせるか、独自にカスタマイズするかを選択できます。 Levels_Color: Fibonacciファンのレベルに適用する色を選択します。 Levels_Style: Fibonacciファンのレベルのスタイルを定義し、外観を好みに調整します。 Levels_Width: チャー
「通貨強度インジケーター」は、外国為替市場での異なる通貨の相対的な強さに関する情報を提供するために開発された強力なツールです。各通貨の強さをそれぞれの対応する時間枠に基づいて計算し描画することで、この指標はトレーダーに、特に顕著なダイバージェンスやクロスが観察された場合に潜在的なトレード機会を特定する機会を提供します。 指標の主な特徴: 1. 通貨の強さの計算: この指標は、各通貨の強さを対応する時間枠に基づいて計算します。この計算は、指定された期間内に一つの通貨が他の通貨のバスケットに対するパフォーマンスを評価することを含みます。これにより、トレーダーは通貨の相対的な強さまたは弱さを理解することができます。 2. 収縮とダイバージェンス: 2つの通貨の強さの間に収縮またはダイバージェンスの動きがある場合、これは潜在的なトレード機会を示唆する可能性があります。例えば、ある通貨が著しく強くなる一方、別の通貨が弱くなる場合、可能なエントリーポイントを示す可能性があります。 3. ゼロレベルのクロス: この指標は、通貨の強さがゼロレベルをクロスする場合も識別します。ゼロを上回るクロスは強化傾
Gannスクエアインジケーターは、W.D. Gannによって執筆された「市場予測のための数学的な式」の記事に基づく強力な市場分析ツールです。このツールは、解析に数学的な概念を応用し、Gann理論に基づいています。それは、144、90、52のスクエアや9のスクエアなど、Gannの関連テクニックの要素を取り入れています。さらに、の方法を組み込んでおり、9のスクエアとその関連性についてのチャネルやスターパターンに焦点を当てています。 ユーザーマニュアルと使用方法: このインジケーターを使用する前に、ユーザーマニュアルを読んで疑問点を解決するためにお問い合わせいただくことをお勧めします。ユーザーマニュアルの完全版は、当社のウェブサイトで入手できます。 MT5の完全版は購入できますし、MT4の無料版も試すことができます。両方のバージョンへのリンクを提供していますので、ご利用ください。 主な機能と機能: Gannスクエアインジケーターは、市場分析のための完全なツールセットを提供し、幾何学的な概念とGann理論に基づいて的確な判断を行う手助けをします。以下に主な機能を示します。 9のスクエアの分析:
このインジケーターは、手動および自動的な方法で描かれる調和パターンを検出します。 ご自身のレビューを追加してください。 注意事項: インジケーターにはコントロールパネルがあり、各(チャートとタイムフレーム)の設定を保存します。スペースを確保するために最小化することができ、他の分析ツールと一緒に作業する際にインジケーターデータをすべて非表示にするために閉じるボタンを押すこともできます。 このインジケーターを使用して設定を変更し、移動平均線やボリンジャーバンドなどのインジケーターを追加する場合、このインジケーターは自動的に編集したテンプレートを保存し、必要なときにロードすることができます。 Windows 10を使用している場合は、MetaTraderアイコンを右クリックして > 互換性 > 高DPI設定の変更 > システム(強化)を選択して、最適な画面設定にしてください(これはHDデバイスで行う必要があります)。 このインジケーターは、チャート上で調和トレーディング理論を解釈したもので、チャート上の調和パターンを検出します。詳しく学びたい場合は、Scott Carneyの「ハーモニックト
このインジケーターは、チャート上で形成されているすべてのヒッカケ価格アクションパターンを検出するための専門のツールです。 ヒッカケパターンは、偽のインサイドバーのブレイクアウトに基づいており、このインジケーターは過去の5本のローソク足を調べ、ヒッカケパターンの条件を満たしているかどうかを判断します。パターンが確認されると、それを形成するローソク足の周りに四角形が表示され、トレーダーがパターンを簡単に見つけて解釈できるようになります。 インジケーターの主な特徴: パターンの検出:ヒッカケインジケーターは、ヒッカケ価格アクションパターンを検出して強調表示するようにプログラムされています。これらのパターンは、インサイドバーのフォーメーションからの偽のブレイクアウトのアイデアを中心にしています。 最後の5本のローソク足による確認:ヒッカケパターンの存在を検証するために、インジケーターはチャート上の直近の5本のローソク足を調べます。これらのローソク足の配置と関係を評価して、パターンの条件が満たされているかどうかを判断します。 四角形の視覚化:インジケーターが有効なヒッカケパターンを特定すると、該
強力な価格アクションパターンを検出するためのテクニカルインジケーター:ピンバー、インサイドバー、アウトサイドバー はじめに: テクニカル分析の領域において、価格アクションパターンは市場の動向の可能性を示す重要な指標です。私たちは、チャート上での堅牢な価格アクションパターンの特定を効率化する高度なテクニカルインジケーターを開発しました。私たちのインジケーターは、ピンバー、インサイドバー、アウトサイドバーの3つの基本的なパターンを検出するのに特化しています。 主な検出パターン: ピンバー: ピンバーパターンは、市場トレンドのポテンシャルな反転を示す単一のローソク足の形成です。小さな実体と、実体の上または下に突き出る長いしっぽまたは「ヒゲ」が特徴です。バルシュピンバーは可能なバルシュ反転を示し、ベアリッシュピンバーはベアリッシュ反転を示唆します。 インサイドバー: インサイドバーパターンは、単一のローソク足の価格範囲が前のローソク足の価格範囲に含まれるときに発生します。このパターンは一時的な相場のコンソリデーションや未決定を示し、しばしばどちらかの方向にのみブレイクアウトする前に現れます。
MetaTrader用 数秘術ベースのサポートとレジスタンスインジケーター 紹介: MetaTrader用 数秘術ベースのサポートとレジスタンスインジケーターで、テクニカル分析の新たな側面を開拓しましょう。このユニークなツールは、数秘術の力を活用して、チャート上で重要なサポートとレジスタンスレベルを特定し、潜在的な価格変動に関する貴重な洞察を提供します。 主要なコンセプト: トレーディングの数秘術: 数秘術は数字とその私たちの生活における意味に関する神秘的な研究です。数秘術の原則をトレーディングに適用することは、象徴的な重要性を持つ特定の数字を特定し、それらを使用して購入または売却の活動を引き寄せる可能性のある価格レベルを予測することを含みます。 インジケーターの機能: 当社のインジケーターは、数秘術の隠れたパターンを利用して、チャート上にサポートとレジスタンスのレベルを描画します。これらのレベルは、金融市場で有意義な数秘術の重要な数字から派生しています。 学習のためのおすすめステップ: 数秘術の理解:インジケーターを使用する前に、数秘術の基本を理解するために時間をかけてください。重要
Shepherd Numerology Levels インジケーターを用いて、革新的なトレード手法を発見しましょう。この画期的なツールは、古代の数秘術の知恵を最新のトレードテクニックと組み合わせて、チャート上の主要なサポートとレジスタンスレベルを特定できるようサポートします。9のマス法を使用することで、このインジケーターは市場のダイナミクスに独自の視点を提供し、より情報豊かなトレード判断を行えるようにします。 主な特徴とメリット: 数秘術と9のマス法: Shepherd Numerology Levels インジケーターは、9のマス法と呼ばれる手法を活用しています。これは古くからの数秘術のアプローチで、価格動向の隠れたパターンを明らかにします。この手法は、市場の転換点やリバーサルの予測においてその精度で知られています。 正確なサポートとレジスタンス: Shepherd Numerology Levels を使用すると、従来の分析では明確でない可能性のある正確なサポートとレジスタンスのレベルを特定できます。これらのレベルは数秘術の原則に基づいており、市場の振る舞いに新たな視点を提供します
ON Trade Numerology Mirror インジケーターのご紹介: 数秘術を活用して隠れた逆転パターンを明らかにする ON Trade Numerology Mirror インジケーターを使って、テクニカル分析の新たな側面を探索してみましょう。この革新的なツールは、古代の数秘術の知恵を活用して、チャート上の重要な価格逆転レベルを特定します。数字を逆向きの位置に再配置することで、このインジケーターは隠れたパターンを明らかにし、重要な価格逆転の兆候を示す可能性を提供し、トレーディングの意思決定に独自のアドバンテージをもたらします。 主な特徴とメリット: 数秘術の活用: ON Trade Numerology Mirror インジケーターは、数秘術の神秘的な力を結集し、隠れた価格逆転のパターンを明らかにします。数字を逆向きに配置することで、数秘術のシンボリックな意味を活用し、価格の逆転を予測するための可能性があります。 数字のミラーパターン: このインジケーターは、数字の順序を逆にする概念を適用して、チャート上に価格逆転のレベルを描画します。これらのレベルは数字のミラーパターンか
もちろんです。以下は、提供いただいたテキストの日本語への翻訳です: MT4用の天文学指標をご紹介します:究極の天体トレーディングコンパニオン トレーディング体験を天空の高みに高める準備はできていますか?私たちの革命的なMT4用の天文学指標をご紹介します。この革新的なツールは、複雑なアルゴリズムの力を借りて、類まれなる天文学的洞察と精密な計算を提供します。 あなたの指先で宇宙の情報を: 宝のような天文学的データが明らかになる包括的なパネルをご覧ください。惑星の地理的/太陽中心座標、太陽と地球の距離、星の大きさ、伸び、星座、黄道座標および赤道座標、さらには水平座標まで、それぞれが綿密に計算され美しく表示されています。指標によって生成される垂直線は時間値に対応し、トレーディングの旅に宇宙の視点を提供します。 惑星のラインと関係: グラフを飾る惑星のラインの魔法を体験し、スケールと角度をカスタマイズできます。直感的なコントロールパネルを介して各惑星のラインの表示を簡単に切り替えることができます。指定された時刻範囲内での合会、六分会、四分会、三分会、対会、逆行の指標で天体の関係の芸術を発見してく
Introducing the ON Trade Melad Pattern Indicator: Enhance Your Trading Strategy with Breakout Patterns Discover the power of the ON Trade Melad Pattern Indicator—an intuitive tool designed to elevate your trading decisions by detecting and highlighting breakout patterns on your charts. This indicator is your key to identifying crucial breakout points and potential trend shifts with simplicity and precision. Key Features: Breakout Pattern Detection: The ON Trade Melad Pattern Indicator focuse
This indicator will give you entries as result of scalping strategy that will be applied on 14 symbols in same time and you are able to be notified with this entries  Note :   This indicator for scalping on 5 minutes timeframe only . How to use it : 1-Open chart and adjust settings (edit symbols names as your platform names , activate the alert system if you need it . 2-Wait for any signal you have it from this scanner you will have it as alert and as notification and you will see it on board
This indicator gives you the signal of real cross on stochastic indicator. This indicator is easy to attach to an ea. This indicator will work best on All time frames. Arrow appears depending on many algorithms that study the cross parameters. Indicator properties Use_System_Visuals: enable/disable visual styles. Stochastic_K_Period. Stochastic_D_Period. Stochastic_Slowing. Use_Notifications: enable/disable Push Notifications. Use_Alert: enable/disable Alerts. Use_E_Mail: enable/disable Email n
「ON Trade VSA」をご紹介します - ボリュームと分布の究極の分析ツール! 我々の先進的な指標「ON Trade VSA」を使って、ボリュームスプレッド分析(VSA)の力を解き放ちましょう。VSAは、市場の強さを評価し、トレンドを特定し、情報に基づいた判断を行うためのトレーダーによって使用される強力な手法です。以下に、「ON Trade VSA」を必携の取引ツールとするための主な特徴を探ってみましょう: マルチカラーのボリュームキャンドル :平均動きに基づいてボリュームキャンドルに異なる色を割り当てるユニークな機能を通じて、市場のダイナミクスについての洞察を得ることができます。この直感的な視覚化は、市場センチメントの変化を素早く把握するのに役立ちます。 強力なトレンドの検出 :私たちの指標は基本的な要素を超えます。グラフ上で最も強力なトレンドを正確に特定してプロットし、市場の主要な方向性を明確に示します。 ボリューム-レンジ乗数 :レンジにボリュームを乗じる機能を通じて、隠れたパターンを発見します。ボリュームと価格レンジの関係を分析することで、市場のボラティリティと潜在的なブ
This product is a part of  ON Trade Waves Patterns Harmonic Elliot Wolfe you can test free version on EURJPY from this link  Wolf Waves Indicator ウルフウェーブを発見しよう - あなたの究極の取引ツール! どんな時間軸でも簡単にウルフウェーブを見つけるための強力なツールを探していますか?もう探す必要はありません!私たちのウルフウェーブインジケーターは、その仕事を簡単にこなします。なぜこのインジケーターがあなたにぴったりか、以下でご紹介します。 主な特徴: 自動検出: ウルフウェーブインジケーターは、複雑なアルゴリズムを使用して、チャート上のキーポイントを自動的に見つけ、対応するラインを描画します。手動でパターンを探す手間が不要です。 使いやすさ: このインジケーターはシンプルなデザインで、経験豊富なトレーダーからウルフウェーブ初心者まで、誰でも簡単に利用できます。 高精度: 数多くのウルフウェーブインジケーターの中で、当社のものは完璧さの
This program serves as an effective tool for sending messages through a Telegram bot using the MetaTrader platform. It enables you to send your trading recommendations related to the orders you open on the trading platform directly to your Telegram channel or group. These messages may include details about open trades and can be accompanied by illustrative images of the orders. Alternatively, they can be configured to be without images based on your preferences. This means that if you are the ow
新しいインジケーターのご紹介:[ON Trade Breakout Zone] すべてのトレーダーに向けたシンプルでありながら強力な市場分析ツール! プロフェッショナルから初心者まで、どなたにも適しています トレーディング戦略を一層強力にしませんか?当社の最新のインジケーターは市場分析を簡素化し、あらゆるレベルのトレーダーに力を与えるよう設計されています。経験豊富なプロであろうと、たった今始めたばかりであろうと、[ON Trade Breakout Zone] は市場で潜在的な利益を引き出すための鍵です。 [ON Trade Breakout Zone] の使い方: この賢明なツールは、毎日、先進的なアルゴリズムを使用してチャート上にゾーンを描きます。最大限に活用する方法は以下の通りです: ゾーンの識別: [ON Trade Breakout Zone] は高い精度でチャート上の重要なゾーンを識別し、潜在的なトレードの機会を簡単に見つけるのに役立ちます。 トレードの実行: 描かれたゾーンのどちらかの側に価格が移動するのを待ちます。 価格が購入ラインを上回った場合
User Manual Download link: https://ontrd.com/our-books/ For all who are asking about indicator  ON Trade Numerology Station It obtain about 16 numerology strategies it make together completed unit control your trading . Basic strategies to work with it are 3 strategies statistics about them are the following : 1. RBA levels success rate more then 95%. 2. FF more then 96%  3.RBA SUN 98% We will not say 100 % as they are .. Ratio rates as following :  1.Rba levels more then 1/3 to 1/6 . 2.FF MORE
フィルタ:
レビューなし
レビューに返信