ON Trade Channels


이 인디케이터는 "회귀 채널 도구" 개념을 기반으로 한 강력한 시장 분석 방법을 제공합니다. 이 도구를 활용하여 트레이더는 차트의 회귀 채널을 탁월하게 제어하고 보다 근거 있는 거래 결정을 할 수 있습니다.

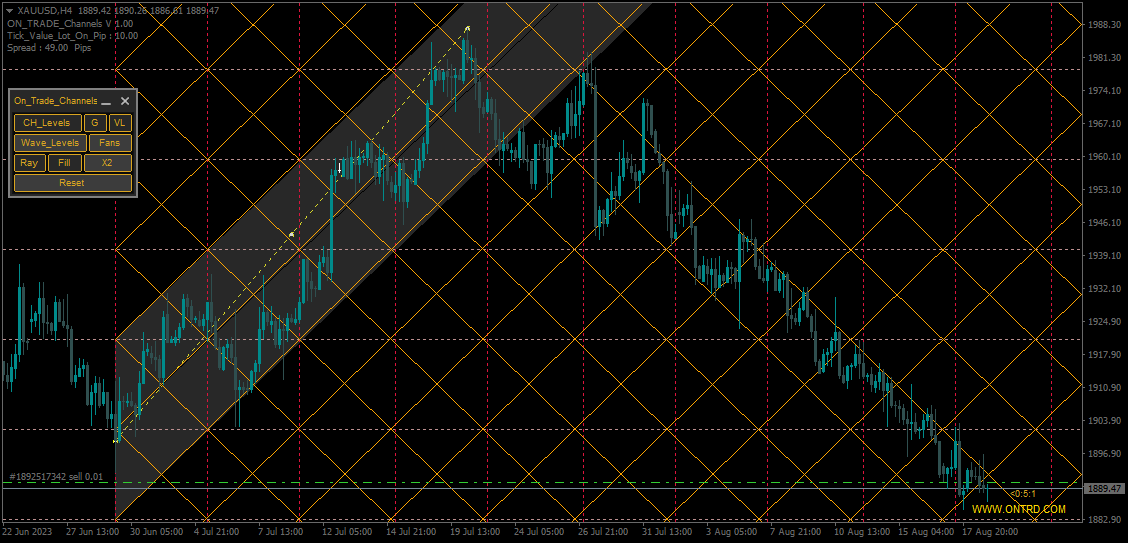
회귀 채널 도구는 트레이더 도구 상자 내에서 강력한 도구입니다. 가격 트렌드와 잠재적인 지지 및 저항 수준에 대한 유용한 통찰력을 제공하는 것을 목표로합니다. 이 도구는 특히 트렌드 내의 수정 웨이브를 시각화하는 데 효과적이며 가격 역학의 포괄적인 전망을 제공합니다.

이제 이 인디케이터의 주요 기능과 이점에 대해 더 자세히 살펴보겠습니다:

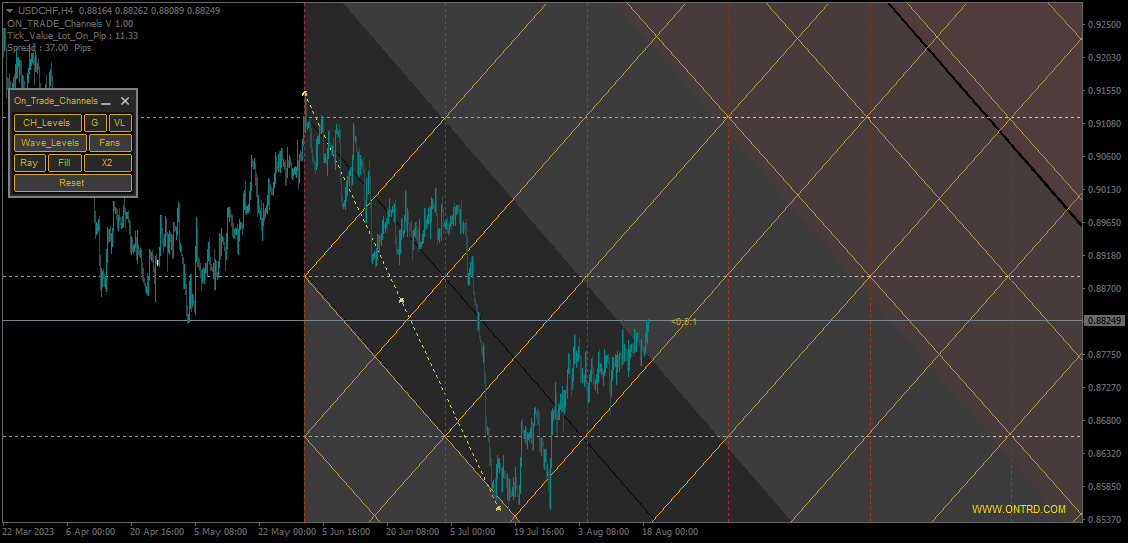
채널 수준 및 지지/저항: 이 인디케이터의 주요 장점 중 하나는 동적인 지지 및 저항 영역으로 작동하는 채널 수준을 생성할 수 있는 능력입니다. 이러한 수준은 잠재적인 진입 및 이탈 포인트를 식별하는 데 중요하며 거래 전략의 정밀도를 향상시킵니다.

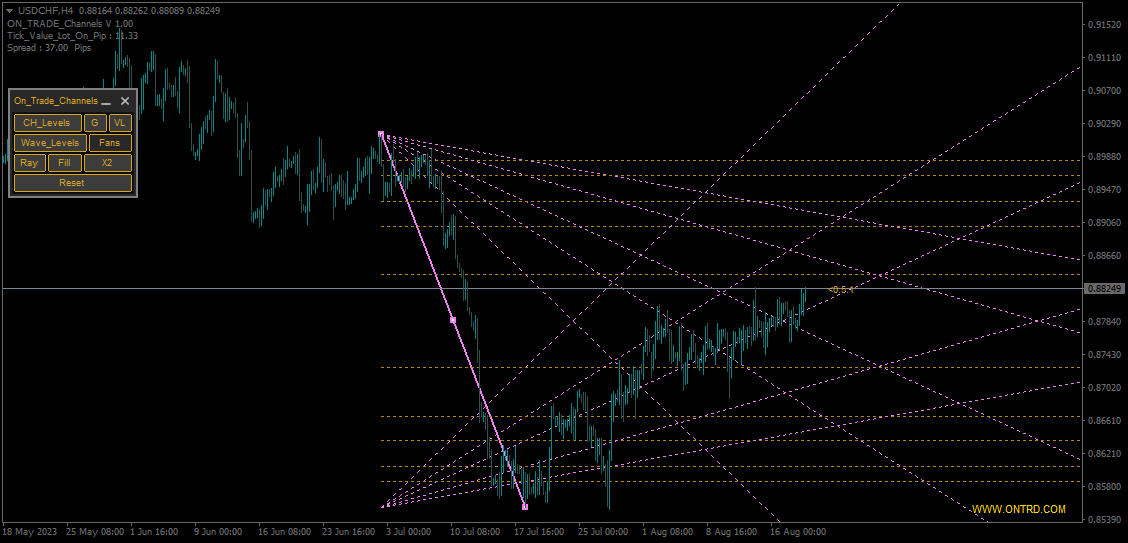
수정 웨이브 수준: 수정 웨이브 수준을 활성화하여 트레이더는 큰 트렌드 내에서 잠재적인 수정을 식별할 수 있습니다. 이 기능은 리트레이스먼트를 인식하는 데 도움이되며 유리한 가격 움직임을 활용하는 데 도움이됩니다.

직접 제어: 인디케이터의 제어 패널을 통해 회귀 채널을 원활하게 조작할 수 있습니다. 트레이더는 채우기 및 선 옵션과 같은 설정을 미세 조정하여 분석 스타일에 맞는 채널 뷰를 제공할 수 있습니다.

상위 시간대 분석: 더 넓은 시각을 위해 이 인디케이터는 상위 시간대의 데이터를 로드하는 기능을 갖추고 있습니다. 이 기능은 트레이더가 다양한 시간 단위에서 트렌드 및 채널을 평가하는 데 도움이되며 시장 역학의 보다 포괄적인 이해를 용이하게합니다.

사용 방법:

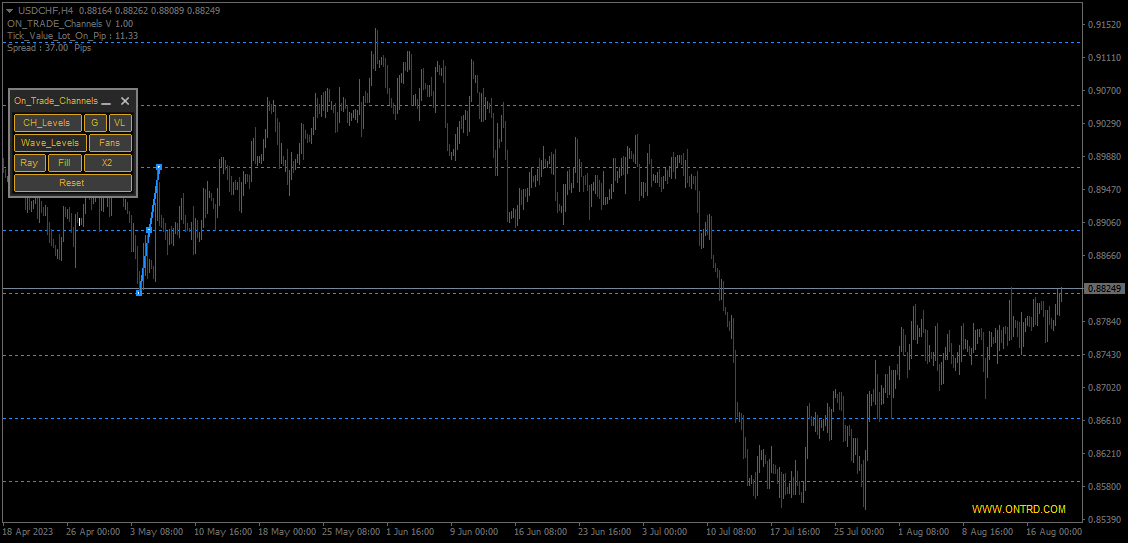
  1. 트렌드 라인 설정: 웨이브의 움직임 시작점에 트렌드 라인을 배치하여 시작합니다. 트렌드가 상승하는 경우 낮은 지점에 배치하고 트렌드가 하강하는 경우 높은 지점에 배치합니다.

  2. 트렌드 라인 종료: 트렌드가 매매적인 경우 (하락 추세) 트렌드 라인을 마지막 고점까지 연장합니다. 트렌드가 상승적인 경우 (상승 추세) 트렌드 라인을 마지막 저점까지 연장합니다.

  3. 채널 수준 메소드: 채널 수준 메소드를 활성화하여 잠재적인 진입 및 이탈 포인트로 작용하는 채널 수준을 시각화합니다. 상승 추세의 경우 상단 채널 수준 근처에서 판매를 고려하십시오. 하락 추세의 경우 하단 채널 수준 근처에서 매수를 고려하십시오.

  4. 수정 웨이브 수준: 수정 웨이브와 상호 작용하려면 첫 번째 수정 웨이브의 시작점에 트렌드 라인을 배치하십시오.

  5. 목표 설정: 채널의 중심은 매수 및 매도 포지션 모두의 전략적 목표입니다.

매개 변수:

  • Use_System_Theme: 시스템 템플릿 활성화 또는 비활성화.
  • Trends_Color: 주요 트렌드 채널의 색상 선택.
  • Channel_Color: 채널 자체의 색상 선택.
  • Show_Center_CH_Levels: 보조 채널 수준 활성화 또는 비활성화.
  • Max_Ch_Levels: 채널 수준의 최대 개수 설정.
  • Ch_Levels_Color: 채널 수준의 색상 선택.
  • Verticals_Colors: 수직 채널 수준의 색상 선택.
  • Max_Wave_Levels: 수정 웨이브 수준의 최대 개수 설정.
  • Wave_Levels_Color: 수정 웨이브 수준의 색상 선택.
  • Upper_Dupilcate_Color: 상단 중복 채널의 색상 선택.
  • Lower_Duplicate_Color: 하단 중복 채널의 색상 선택.
  • Fans_Color: 팬의 색상 선택.
  • Show_Last_Candle_Counter: 양초 시간 카운터 활성화 또는 비활성화.
  • Candle_Counter_Color: 양초 시간 카운터 텍스트의 색상 선택.

요약하면, 이 인디케이터는 시장 트렌드를 분석하고 근거 있는 거래 결정을 내리기 위한 포괄적인 도구 세트를 트레이더에게 제공합니다. 채널 수준, 지지/저항 영역 및 수정 웨이브를 강조하는 능력은 어떤 트레이더의 아카이브에 가치 있는 추가 요소로 작용합니다. 이 인디케이터의 기능과 매개 변수를 활용하여 트레이더는 가격 역학의 이해를 향상시키고 거래 전략을 미화할 수 있습니다."


추천 제품
ON Trade Optuma Astro
Abdullah Alrai
5 (5)
물론입니다. 아래는 제공해주신 텍스트의 한국어 번역입니다: MT4용 천문학 지표 소개: 귀하의 최상급 하늘 트레이딩 동반자 트레이딩 경험을 천체의 높이로 끌어올리기 준비가 되셨나요? MT4용 천문학 지표를 소개합니다. 이 혁신적인 도구는 복잡한 알고리즘의 힘을 활용하여 탁월한 천문학적 통찰과 정밀한 계산을 제공합니다. 정보의 우주를 손에 담다: 천문학적 데이터의 보물함을 드러내는 포괄적인 패널을 살펴보세요. 행성의 지오/헬리오센트릭 좌표, 태양/지구 거리, 크기, 길이, 별자리, 황도 좌표 및 적도 좌표, 심지어 수평 좌표 등 각각이 정밀하게 계산되고 아름답게 제시됩니다. 지표에 의해 생성된 수직선은 시간 값에 해당하여 트레이딩 여정에 우주적인 시각을 부여합니다. 행성 라인과 관계: 수정 가능한 스케일과 각도로 차트를 장식하는 행성 라인의 마법을 경험해보세요. 직관적인 컨트롤 패널을 통해 각 행성의 라인의 가시성을 손쉽게 전환할 수 있습니다. 쥰션이나 섹스타일, 사분각, 삼분각, 트
Everyday trading represents a battle of buyers ("Bulls") pushing prices up and sellers ("Bears") pushing prices down. Depending on what party scores off, the day will end with a price that is higher or lower than that of the previous day. Intermediate results, first of all the highest and lowest price, allow to judge about how the battle was developing during the day. It is very important to be able to estimate the Bears Power balance since changes in this balance initially signalize about possi
The Trend Professor is a moving average based indicator designed for the purpose of helping the community of traders to analyse the price trend. The indicator will be displayed in the main chart as it is indicated on the screenshot section. How it works The indicator has lines of moving averages and colored histograms to depict the direction of the trend. There will be a fast signal line colored blue/yellow/red at some points. The red/yellow colored lines stands for bearish trend/signal while th
Advanced Signal System is an indicator that generates trade arrows. It generates trade arrows with its own algorithm. These arrows give buying and selling signals.  Can be used in all pairs. Sends a signal to the user with the alert feature. The indicator certainly does not repaint. Trade rules Enter the signal when the buy signal arrives. In order to exit from the transaction, an opposite signal must be received. It is absolutely necessary to close the operation when an opposite signal is rece
The indicator scans for stop grabber (special pattern of Joe Dinapoli which gives very high probability buy / sell signals and does not repaint ) signals in multiple timeframes for the all markets filtered and shows the results on Dashboard. Key Features Dashboard can be used for all markets It can scan for stop grabber pattern on MN1, W1, D1, H4, H1, M30, M15 ,M5, M1 timeframes Parameters UseMarketWatch: Set true to copy all symbols available in market watch MarketWatchCount : Set the number
Power Bears Rich
Pham Trong Khanh
Everyday trading represents a battle of buyers ("Bulls") pushing prices up and sellers ("Bears") pushing prices down. Depending on what party scores off, the day will end with a price that is higher or lower than that of the previous day. Intermediate results, first of all the highest and lowest price, allow to judge about how the battle was developing during the day. It is very important to be able to estimate the Bears Power balance since changes in this balance initially signalize about possi
Breakout Quality Score (BQS) (MT4) – Breakout Strength Scoring (0–100) Overview Breakout Quality Score (BQS) is an MT4 indicator that scores breakout quality from 0 to 100, helping you quickly evaluate breakout strength using a rule-based approach. This is a visualization/alert tool only. It does not place, modify, or close any orders. What BQS provides 0–100 scoring for breakout strength Strong-only focus via a configurable threshold (example default: 80+) On-chart numeric labels for quick visu
This indicator Super Channel Pro indicator.Indicator displays trend movement. Indicator calculates automatically line. Features FiltPer - displays indicator channel period. deviation - displays indicator channel deviation. deviation2 - displays indicator channel deviation. How to understand the status: If the arrow is green, trend is up. If the arrow is red, trend is down. ///////////////////////////////////////////////////////////////////////////////////////////////////////////////////////////
The Squat is a function of the range of a given price bar and the volume, or TIC volume, that occurs while that range is being created. The basic idea is that high volume and little price movement indicate substantial support or resistance. The idea behind the approach to this indicator is to first look for likely Fibonacci support and resistance and then see if Squat manifests when that point is reached. The indicator determines one of the high probability patterns of DiNapoli. It does not re
MT4용 Crypto_Forex 지표 "프랙탈 채널" - 이 지표는 프랙탈의 고점/저점을 기반으로 실제 로컬 추세선을 보여줍니다. - 그래픽 분석을 사용하는 트레이더에게 유용합니다. - 저항선 로컬 추세선 - 빨간색 - 지지선 로컬 추세선 - 파란색 - 프랙탈 개수, 추세선 색상 및 너비를 결정하는 몇 가지 매개변수가 있습니다. - 이 지표는 현재 시장 상황을 파악하는 데 유용합니다. - 강세장 - 두 선 모두 상승할 때 - 약세장 - 두 선 모두 하락할 때 - 횡보장 - 두 선 모두 반대 방향으로 움직일 때 ............................................................................................. 여기를 클릭하여 고품질 트레이딩 로봇과 지표를 확인하세요! 이 제품은 MQL5 웹사이트에서만 제공되는 오리지널 상품입니다.
Scalper Terminal 인터페이스 소프트웨어는 지표이며 자동 구매-판매 거래에 참여하지 않습니다. 이 지표는 스캘핑 거래 기회가 발생했을 때 거래가 들어갈 수 있는 현재 거래 영역을 보여줍니다. 스캘핑 신호가 있는 경우 해당 거래 쌍의 오른쪽에 청록색 표시등이 켜지고 그 위에 정확한 거래 방향이 표시됩니다. 그런 다음 청록색 버튼을 클릭하여 거래를 입력하세요. 새 탭이 열립니다. 이후 스캘핑 거래 진입 조건인 캔들 클로징이 예상된다. 스캘퍼 터미널과 성공적인 스캘핑 거래 거래를 하기 위해서는 설명 섹션의 동영상을 꼭 시청하세요. Scalper Terminal 소프트웨어에 군인처럼 붙어보세요. 각 거래 쌍의 오른쪽에는 5M, 15M 및 DIRECTION 열이 있습니다. 먼저 알림 버튼을 클릭하고 녹색으로 만듭니다. 화면을 계속해서 볼 필요는 없습니다. 청록색 빛 신호 또는 메타 트레이더 경고 메시지 소리를 기다리십시오. 청록색 빛으로 표시된 정확한 작동 방향(DIRECTI
Adjustable Consecutive Fractals  looks for 2 or more fractals in one direction and sends out a on screen alert, sound alert and push notification, for strong reversal points . Adjustable Consecutive Fractals, shows the fractals on chart along with a color changing text for buy and sell signals when one or more fractals appear on one side of price. Adjustable Consecutive Fractals is based Bill Williams Fractals . The standard Bill Williams fractals are set at a non adjustable 5 bars, BUT withe th
BoxProfile MT4
Evgeny Shevtsov
4.92 (12)
The indicator displays volume profiles based on the nesting principle. Profiles periods are pre-set so that each subsequent profile has a length twice as long as the length of the previous profile. In addition to profiles, the indicator displays volume clusters sorted by color, depending on the volume they contain. Indicator operation features The indicator works on typical timeframes from M5 to MN, but for calculations uses historical data from smaller timeframes: M1 - for timeframes from M5
FREE
Candle EA MT4
Mansour Babasafary
3.68 (19)
This expert is based on patterns The main patterns of this specialist are candlestick patterns Detects trends with candlestick patterns It has a profit limit and a loss limit, so it has a low risk The best time frame to use this expert is M30 time frame The best currency pairs to use with this expert is the EURUSD, GBPUSD, AUDUSD, USDCAD currency pairs Attributes: Can be used in the EURUSD, GBPUSD, AUDUSD, USDCAD  currency pairs Can be used in M30, H1, H4 time frames Has profit limit and loss
Cyclic Impulse
Vitalyi Belyh
차트를 구조화하고 주기적인 가격 변동을 식별하는 기술 지표입니다. 모든 차트에서 작업할 수 있습니다. 다양한 유형의 알림. 그래프 자체에도 추가 화살표가 있습니다. 역사를 재구성하지 않고, 촛불을 닫는 작업에 임한다. M5 이상에서 권장되는 TF입니다. 사용 및 구성이 쉬운 매개변수입니다. 매개변수가 다른 2개의 지표를 사용하는 경우, 다른 지표 없이 해당 지표만 사용할 수 있습니다. 2개의 입력 매개변수가 있습니다 주기성과 신호 지속 시간 이 2개의 매개변수는 차트 구조의 처리와 관련이 있습니다. Cyclicity - 역전 주기가 얼마나 자주 바뀌는지 조절하고 주기를 매끄럽게 합니다. Signal duration - 최소 숫자에서는 가격 움직임의 충격을 감지하고, 최대 숫자에서는 장기적 추세 움직임을 감지합니다.. --------------------------------
The product has been removed from sale。 Sales suspended, do not download. 2025/1/28 The product has been removed from sale。 Sales suspended, do not download. 2025/1/28 产品已下架  产品已下架 The product has been removed from sale。Sales suspended, do not download. 2025/1/28 The product has been removed from sale。Sales suspended, do not download. 2025/1/28 产品已下架 产品已下架 The product has been removed from sale 产品已下架 The product has been removed from sale 产品已下架  The product has been removed from sale The product
평균 일일 범위는 특정 기간 동안 측정된 Forex 쌍의 평균 핍 범위를 보여줍니다. 거래자는 ADR을 사용하여 평균 일일 이동을 벗어난 잠재적인 가격 조치를 시각화할 수 있습니다. ADR이 평균보다 높으면 일일 변동성이 평소보다 높다는 것을 의미하며, 이는 통화 쌍이 정상 이상으로 확장될 수 있음을 의미합니다. ADR Analyzer는 5가지 주요 기능으로 구성됩니다. 범위(ADR) 스크리너: 다중 통화 ADR 분석. ADR 구역: ADR 구역 외의 가격 붐이 일 동안 예상되는 시장 범위를 보여줍니다. X막대 Zone : 사용자가 지정한 X막대, X막대의 틈을 보여줍니다. 일간 고저존 : 전일 고점 또는 저점의 구간을 식별합니다. Weekly High and Low Zone : 주간 High 레벨 또는 Low 레벨을 식별합니다. 기간 한정 제공: 범위 분석기 표시기는 50$ 및 평생 동안만 사용할 수 있습니다. ( 원래 가격 125$ ) 주요 특징들 다중 통화 스크리너. AD
TMoney TrendCycle
Moises Orlando Urbina Sojo
The indicator plots the trend from an EMA of "n" periods and the cycle from another EMA of "k" periods from the previous EMA. This allows the crosses to be much more effective and the amplitude of the cycle allows to verify the strength of the trend. This indicator should be used as a complementary tool to confirm market entry signals. It is possible to add three times the indicator applied to maximum price, minimum price and median price in TimeFrame of one hour for example, in order to identif
High Low Open Close MT4
Alexandre Borela
4.81 (21)
이 프로젝트를 좋아한다면 5 스타 리뷰를 남겨주세요. 이 지표는 열리고, 높은, 낮은 및 마감 가격을 지정합니다. 기간과 그것은 특정한 시간대를 위해 조정될 수 있습니다. 이들은 많은 기관 및 전문가에 의해 보는 중요한 수준입니다 상인은 당신이 더 많은 것일 수있는 장소를 알고 도움이 될 수 있습니다 이름 * 사용 가능한 기간: 이전 날. 이전 주. 지난 달. 이전 분기. 이전 연도. 또는: 현재 날. 현재 주. 현재 달. 현재 분기. 현재 년.
FREE
OFFER!   OFFER ! After 3 weeks the unlimited price will be 500$ and in the future you will regret why you didn't make a purchase at this lowest price. Dear Traders, the atomic power Entries Indicator is one of the indicators that if used wisely and correctly can help you to find an edge over the market.  The indicator will work for all forex pairs, all markets and all timeframes. Still it is your duty to find the most effective timeframe for you. When the sell or buy arrow appears you will get a
FRM Half Trend
Noiros Tech
3.5 (2)
YOU CAN NOW DOWNLOAD FREE VERSIONS OF OUR PAID INDICATORS . IT'S OUR WAY OF GIVING BACK TO THE COMMUNITY ! >>>    GO HERE TO DOWNLOAD   The system is a free open source pine script originally published on TradingView by everget   . It was converted to Mt4 by Forex Robot Makers. This system is a  popular trend indicator based on ATR ( Average True Range ) , Moving Averages and the Donchian channel . System BackGround ATR The average true range is an indicator of the price volatility of an asse
FREE
Trends Trg
Yvan Musatov
The Trends Trg indicator determines the prevailing trend. They help to analyze the market at the selected time interval. Easy to set up and works on all pairs and all time frames. Trend indicators make it possible to classify the direction of price movement by determining its strength. Solving this problem helps investors enter the market on time and get a good return. It is extremely important for any trader to correctly determine the direction and strength of the trend movement. Unfortunatel
SniperPro
Aleksandr Skorikov
The SniperPro(XAU-USD) trading indicator has performed well for 15 days on XAU USD.....When trading on this indicator, the order sometimes goes into a drawdown.....The indicator does not redraw!!!!!! The indicator works on time intervals M1-D1....He performed well during the release of economic news… We attach the indicator to the XAU – USD M5 chart with standard settings without changing anything.....
Urgently
Tatiana Savkevych
The Urgently indicator is designed to quickly determine the situation in the market, reflect the state of the market and signal profitable levels for opening trades. Market conditions change quickly enough, requiring constant calibration of trading strategies. Recommended for use in conjunction with any of the oscillators. The Urgently forex market trend indicator shows the trend direction and entry points. It smooths out price fluctuations when generating a signal by averaging the data and the
This indicator works on MT4 and is very easy to use. When you receive a signal from it, you wait for that candle with the signal to close and you enter your trade at the beginning of the next new candle . A red arrow means sell and a green arrow means buy. All arrows comes with Alert  like for easy identification of trade signal. Are you okay with that? 1 minute candle 1 minute expire
"The VIX Fix is a powerful indicator that detects market bottoms for any asset " The VIX (volatility index) is a ticker symbol of implied volatility of the S&P 500, calculated by the Chicago Board Options Exchange. VIX is a popular measure of market risk, and is one of the best measures of market bottoms that currently exists. Unfortunately, it only exists for the S&P 500... The VIX Fix was published by Larry Williams in 2007, and it synthesizes a VIX volatility index for any asset (not just the
Pips forex
Andrey Kozak
Pips forex - is a ready trading system . This indicator shows with arrows on the chart when and in what direction you need to open an order. If the arrow is green, then we open a buy deal, and if the arrow is red, then we open a sell deal. Everything is very simple and quite effective. TakeProfit set 15-25 points. StopLoss set at the level of points. When the dots move, we immediately override the StopLoss. Recommended timeframe for trading M1 and M5. This is a scalping strategy and works best
Binary Option Signal
Yaroslav Varankin
Indicator for binary options arrow is easy to use and does not require configuration works on all currency pairs, cryptocurrencies buy signal blue up arrow sell signal red down arrow tips do not trade during news and 15-30 minutes before their release, as the market is too volatile and there is a lot of noise it is worth entering trades one or two candles from the current period (recommended for 1 candle) timeframe up to m 15 recommended money management fixed lot or fixed percentage of the depo
Accumulation Basic
Thanh Quang Huynh
Accumulation/Distribution Technical Indicator is determined by the changes in price and volume. The volume acts as a weighting coefficient at the change of price – the higher the coefficient (the volume) is, the greater the contribution of the price change (for this period of time) will be in the value of the indicator. In fact, this indicator is a variant of the more commonly used indicator   On Balance Volume . They are both used to confirm price changes by means of measuring the respective vo
Simple QM Pattern
Suvashish Halder
4.5 (2)
Simple QM Pattern is a powerful and intuitive trading indicator designed to simplify the identification of the Quasimodo (QM) trading pattern. The QM pattern is widely recognized among traders for effectively signaling potential reversals by highlighting key market structures and price action formations. This indicator helps traders easily visualize the QM pattern directly on their charts, making it straightforward even for those who are new to pattern trading. Simple QM Pattern includes dynamic
FREE
이 제품의 구매자들이 또한 구매함
Miraculous Indicator – Gann Square of Nine 기반 100% 비리페인트 Forex 및 바이너리 도구 이 영상은 Miraculous Indicator 를 소개합니다. 이 지표는 Forex 및 바이너리 옵션 트레이더를 위해 특별히 개발된 매우 정확하고 강력한 트레이딩 도구입니다. 이 지표가 독특한 이유는 전설적인 **Gann Square of Nine(Gann 9의 사각형)**과 **Gann's Law of Vibration(Gann 진동의 법칙)**에 기반을 두고 있기 때문입니다. 이는 현대 트레이딩에서 가장 정밀한 예측 도구 중 하나로 손꼽힙니다. Miraculous Indicator는 완전히 비리페인트(non-repaint) 됩니다. 즉, 캔들이 마감된 후에도 신호가 변경되거나 사라지지 않습니다. 보이는 것이 곧 결과입니다. 이는 트레이더가 자신감을 가지고 거래에 진입하고 청산할 수 있는 신뢰할 수 있고 일관된 기반을 제공합니다. 주요 특징: Gann
Precautions for subscribing to indicator This indicator only supports the computer version of MT4 Does not support MT5, mobile phones, tablets The indicator only shows the day's entry arrow The previous history arrow will not be displayed (Live broadcast is for demonstration) The indicator is a trading aid Is not a EA automatic trading No copy trading function The indicator only indicates the entry position No exit (target profit)  The entry stop loss point is set at 30-50 PIPS Or the front hi
Buy Sell Arrow Swing MT4
Sahib Ul Ahsan
5 (1)
Looking for a powerful yet lightweight swing detector that accurately identifies market structure turning points? Want clear, reliable buy and sell signals that work across any timeframe and any instrument? Buy Sell Arrow MT Swing is built exactly for that — precision swing detection made simple and effective. This indicator identifies Higher Highs (HH) , Higher Lows (HL) , Lower Highs (LH) , and Lower Lows (LL) with remarkable clarity. It is designed to help traders easily visualize market stru
El indicador "MR BEAST ALERTAS DE LIQUIDEZ" es una herramienta avanzada diseñada para proporcionar señales y alertas sobre la liquidez del mercado basándose en una serie de indicadores técnicos y análisis de tendencias. Ideal para traders que buscan oportunidades de trading en función de la dinámica de precios y los niveles de volatilidad, este indicador ofrece una visualización clara y detallada en la ventana del gráfico de MetaTrader. Características Principales: Canal ATR Adaptativo: Calcula
IQ FX Gann Levels
INTRAQUOTES
5 (2)
IQ FX Gann Levels a precision trading indicator based on W.D. Gann’s square root methods . It plots real-time, non-repainting support and resistance levels to help traders confidently spot intraday and scalping opportunities with high accuracy. William Delbert Gann (W.D. Gann) was an exceptional market analyst, whose trading technique was based on a complex blend of mathematics, geometry, astrology, and ancient mathematics which proved to be extremely accurate. Setup & Guide:  Download  MT5 Ver
Meravith
Ivan Stefanov
5 (3)
마켓 메이커를 위한 도구. Meravith는 다음과 같은 기능을 제공합니다: 모든 타임프레임을 분석하고 현재 유효한 추세를 표시합니다. 강세와 약세 거래량이 동일한 유동성 구간(거래량 균형 구간)을 강조 표시합니다. 서로 다른 타임프레임의 모든 유동성 레벨을 차트에 직접 표시합니다. 텍스트 기반 시장 분석을 생성하여 참고용으로 제공합니다. 현재 추세를 기반으로 목표가, 지지선 및 손절가를 계산합니다. 거래의 위험 대비 보상 비율(Risk/Reward)을 계산합니다. 계좌 잔고에 따라 포지션 크기를 산출하고 잠재 수익을 추정합니다. 시장에 중대한 변화가 발생할 경우 경고도 제공합니다. 지표의 주요 라인: 강세/약세 거래량 소진 라인 — 목표가로 사용됩니다. 시장 추세를 나타내는 라인. 시장이 강세인지 약세인지에 따라 색상이 변경되며 추세 지지선 역할을 합니다. 색상은 주로 시장 심리를 보여줍니다. 거래량 균형선(Eq). Eq(Volume Equilibrium) 라인은 시스템의 핵심입니
Dynamic Scalper System
Vitalyi Belyh
5 (1)
" Dynamic Scalper System " 지표는 추세 파동 내에서 스캘핑 방식으로 거래하도록 설계되었습니다. 주요 통화쌍 및 금에서 테스트되었으며, 다른 거래 상품과의 호환성이 가능합니다. 추가적인 가격 변동 지원을 통해 추세에 따라 단기 포지션 진입 신호를 제공합니다. 지표의 원리 큰 화살표는 추세 방향을 결정합니다. 작은 화살표 형태의 스캘핑 신호를 생성하는 알고리즘은 추세 파동 내에서 작동합니다. 빨간색 화살표는 상승 방향을, 파란색 화살표는 하락 방향을 나타냅니다. 민감한 가격 변동선은 추세 방향으로 그려지며, 작은 화살표의 신호와 함께 작용합니다. 신호는 다음과 같이 작동합니다. 적절한 시점에 선이 나타나면 진입 신호가 형성되고, 선이 있는 동안 미결제 포지션을 유지하며, 완료되면 거래를 종료합니다. 권장되는 작업 시간대는 M1~H4입니다. 화살표는 현재 캔들에 형성되며, 다음 캔들이 이미 시작되었더라도 이전 캔들의 화살표는 다시 그려지지 않습니다. 입력 매개
Are you looking for a simple and reliable indicator that can help you spot market swing points easily? Do you want clear buy and sell signals that work on any timeframe and any trading instrument? Buy Sell Signal Pro is designed to do exactly that. It helps traders identify important market turning points and understand the current market structure in a clear and easy way. This indicator detects Higher Highs (HH), Higher Lows (HL), Lower Highs (LH), and Lower Lows (LL) so you can quickly see wh
GoldRush Trend Arrow Signal
Kirk Lee Holloway
5 (2)
GoldRush 트렌드 화살표 신호 GoldRush 트렌드 화살표 신호 지표는 XAU/USD 시장에서 고속 단기 스캘핑 트레이더를 위해 설계된 정밀한 실시간 트렌드 분석을 제공합니다. 1분 시간대에 특화되어 설계된 이 도구는 명확한 진입점을 표시하는 방향성 화살표를 제공하여 스캘퍼들이 변동성이 높은 시장 환경에서도 자신 있게 거래할 수 있도록 합니다. 이 지표는 PRIMARY 및 SECONDARY 경고 화살표로 구성됩니다. PRIMARY 신호는 추세 방향의 변화를 나타내는 흰색과 검은색 방향성 화살표이며, SECONDARY 신호는 PRIMARY 화살표가 지시하는 방향을 확인하고 잠재적인 거래 진입점을 표시하는 파란색과 빨간색 화살표입니다. 참고: 추세 방향이 변경된 후 PRIMARY 경고 화살표가 단 하나만 표시될 경우, 다수의 SECONDARY 파란색/빨간색 화살표가 표시될 수 있음을 유의해야 합니다. SECONDARY 신호는 신호 기준을 충족하는 어떤 캔들 이후에도 표시
PairMaster Buy Sell Arrow Indicator for MT4 Trade Reversals Like a Pro — Catch Every Swing Point with Precision The PairMaster Buy Sell Arrow Indicator is a powerful MetaTrader 4 tool built to identify high-probability swing trading opportunities . Designed for traders who value accuracy, clarity, and simplicity, PairMaster detects key market turning points and plots intuitive buy and sell arrows directly on your chart. Key Features Accurate Swing Point Detection – Automatically identifies ma
Quantum Regime Indicator
Gideon Asiamah Yeboah
Product Name:   Quantum Regime Indicator Short Description:   A multi-engine structural regime and volatility filter. Description: Quantum Regime Indicator (QRI) is a sophisticated technical analysis algorithm designed to identify market structure shifts and volatility regimes. Unlike standard indicators that rely on immediate price action, QRI utilizes a hierarchical logic architecture to filter market noise and identify statistical extremes. The indicator is built on the philosophy of "Market
"Dragon's Tail" is an integrated trading system, not just an indicator. This system analyzes each candle on a minute-by-minute basis, which is particularly effective in high market volatility conditions. The "Dragon's Tail" system identifies key market moments referred to as "bull and bear battles". Based on these "battles", the system gives trade direction recommendations. In the case of an arrow appearing on the chart, this signals the possibility of opening two trades in the indicated directi
Rtc ML Ai Predictor MT4
Muhammad Faisal Sagala
Rtc ML Ai | Predictor CORE MACHINE LEARNING ENGINE Adaptive ML Market Predictor – Multi-Bar Trend & Candle Forecast What This Indicator Does This indicator is a  real-time market prediction engine  designed to analyze price behavior and estimate  future market tendencies . Unlike conventional indicators, this system  does not rely on static parameters or historical curve-fitting , but adapts its internal state dynamically during live market operation. Instead of using static rules, the indic
ECM Elite Channel is a volatility-based indicator, developed with a specific time algorithm, which consists of finding possible corrections in the market. This indicator shows two outer lines, an inner line (retracement line) and an arrow sign, where the channel theory is to help identify overbought and oversold conditions in the market. The market price will generally fall between the boundaries of the channel. If prices touch or move outside the channel, it's a trading opportunity. The ind
Introducing a powerful, precision-engineered indicator that seamlessly combines Pivot Points, Moving Averages, and Multi-Timeframe Analysis to deliver high-probability Buy and Sell signals in real-time. This tool is your strategic edge, designed to identify trend reversals, market momentum, and optimal trade entries, no matter your preferred trading style. Our algorithm goes beyond standard indicators—by analyzing multiple timeframes simultaneously, it spots true market turning points while fi
Advanced Arrow
Alfred Kamal
3.9 (39)
This indicator depends on some secrets equations to draw Signals with Stop loss and maximum 4 Take profits. There is a free EA depends on this indicator as a gift when you purchase/rent it. Features Simply it gives you entry point as Ready sign (Buy / Sell) and arrow (Buy / Sell) after candle closed, also SL line and 4 TP lines or less. Once SL-TP lines are shown with the arrow, they remains as they are until signal change. It is historical indicator. No Repaint. user manual for V5 please click
Weis Wave with Alert
Trade The Volume Waves Single Member P.C.
4.82 (22)
Rental/Lifetime Package Options and Privileges' Rent Monthly Six Months   Yearly/Lifetime Weis Wave with Speed with Alert+Speed Index x x x Manual  x x x Quick Set up Video x x x Blog x x x Lifetime Updates x x x Setup and Training Material x x Rectangle Break Alert Tool      x Discord Access Channel "The SI traders" x   How to trade info visit:    http://www.tradethevolumewaves.com   ** If you purchase please contact me to setup your  : training Room and  complete manual access.  This is
Pulse Scalping Line - an indicator for identifying potential pivot points. Based on this indicator, you can build an effective Martingale system. According to our statistics, the indicator gives a maximum of 4 erroneous pivot points in a series. On average, these are 2 pivot points. That is, the indicator shows a reversal, it is erroneous. This means that the second signal of the indicator will be highly accurate. Based on this information, you can build a trading system based on the Martingale
ATC AlgoZone Indicator
Ameur Boudenne
5 (2)
Algo Trading Indicaor  With this indicator , you’ll have zones and trends that hight probability the price will reverse from it. so will gives you all the help that you need  Why should you join us !?  1-This indicator is logical since it’s working in previous days movement , to predict the future movements. 2-Algo trading indicator will help you to draw trends which is special and are too strong than the basics trend , trends will change with the frame time that you work on . 3-We can use
F-16 비행기 지표를 소개합니다. 이것은 귀하의 거래 경험을 혁신하도록 설계된 최첨단 MT4 도구입니다. F-16 전투기의 비할 데 없는 속도와 정밀성에 영감을 받아이 지표는 고급 알고리즘과 최첨단 기술을 결합하여 금융 시장에서 압도적인 성능을 제공합니다. F-16 비행기 지표를 사용하면 실시간 분석을 제공하고 매우 정확한 거래 신호를 생성하여 경쟁을 앞서갈 수 있습니다. 다양한 자산 클래스에서 수익 기회를 식별하는 데 필요한 동적 기능을 갖추고 있어 확신을 가지고 정보에 근거한 결정을 내릴 수 있습니다. 사용자 친화적인 인터페이스로 구성된 F-16 비행기 지표는 인기있는 MetaTrader 4 플랫폼과 완벽하게 통합되어 원활하고 효율적인 거래 과정을 보장합니다. 초보자 트레이더든 경험 많은 전문가든 이 지표를 쉽게 사용자 정의하여 고유한 거래 스타일과 선호도에 맞출 수 있습니다. F-16 비행기 지표의 강력함을 경험해 보세요. 이 지표는 시장 트렌드를 정확하고 민첩하게 탐색하며
OrderFlow Absorption – MT4용 전문 델타 & 흡수 신호 인디케이터 OrderFlow Absorption으로 진정한 오더플로우 분석의 힘을 경험하세요. MetaTrader 4를 위한 궁극의 델타 히스토그램 및 흡수 신호 인디케이터입니다. 가격 움직임의 이면에서 실제로 무슨 일이 일어나는지 알고 싶은 트레이더를 위해 설계된 이 도구는, 시장을 움직이는 숨겨진 매수/매도 압력과 흡수 이벤트를 드러냅니다. 주요 기능 델타 히스토그램 시각화:   매수와 매도 압력을 색상별 히스토그램으로 즉시 확인할 수 있습니다. 흡수 신호 감지:   고급 로직으로 강세 및 약세 흡수 이벤트를 식별하여 반전 신호를 미리 알려줍니다. 차트 마커:   흡수 신호가 차트에 직접 표시되어 시각적으로 쉽게 확인할 수 있습니다. 팝업 알림:   새로운 흡수 신호가 발생하면 실시간으로 알림을 받을 수 있습니다. 사용자 지정 임계값:   약한 신호는 필터링하고, 확률이 높은 기회에 집중할 수 있습니다.
[Trend Line Pro 3]  Trend Line Pro 3 is a discretionary analysis indicator that visualizes swing structure based on Dow Theory / ZigZag concepts and organizes key lines (support/resistance and trendlines) as well as potential break/structure-change points (BreakEdge) directly on the chart. * This product is NOT an EA. It does not place trades or send orders. It helps you organize market structure with the same rules and align your decision criteria more consistently.
The Nihilist 5.0 Indicator includes Forexalien and Nihilist Easy Trend trading strategies and systems. It is composed of an MTF Dashboard where you can analyze the different input possibilities of each strategy at a glance. It has an alert system with different types of configurable filters. You can also configure which TF you want to be notified on your Metatrader 4 platform and Mobile application The indicator has the option to view how could be a TP and SL by using ATR or fixed points, even w
ZeusArrow Smart Liquidity Finder  Smart Liquidity Finder is Ai controlled indicator based on the Idea of Your SL is My Entry. It scan and draws the major Liquidity areas on chart partitioning them with Premium and Discount Zone and allows you find the best possible trading setups and help you decide the perfect entry price to avoid getting your Stop Loss hunted . Now no more confusion about when to enter and where to enter. Benefit from this one of it's kind trading tool powered by Ai an trade
작성자의 메시지 저는 7년 이상 외환 시장에서 거래해 왔으며, 전업 트레이더 로 활동하고 있습니다. 오랜 트레이딩 경험을 통해 제가 강하게 느낀 점은, 트레이딩에서 가장 큰 과제는 전략 자체가 아니라 올바른 통화 페어를 선택하는 것 이라는 사실입니다. 아무리 완성도가 높은 전략이라도 잘못된 시장이나 통화 페어에 적용하면 그 효과는 크게 저하됩니다. 반대로, 적절한 통화 페어를 선택할 수 있다면 많은 전략은 자연스럽게 본래의 성과를 발휘합니다. 이러한 생각을 바탕으로 개발한 것이 Currency Strength Index – Advanced Version 입니다. 저의 경험상 통화의 강약은 추세 트레이딩의 기반 입니다. 완전한 일간 사이클( 1440분 ) 동안 시장의 관심이 가장 강한 통화와 가장 약한 통화에 집중될 경우, 이러한 강약의 편차는 단기간에 해소되지 않고 지속되는 경향이 있습니다. 많은 추세 전략이 효과를 발휘하는 이유는 진입 로직 때문만이 아니라, 이미 시장을 지배
Everyone who purchases the Scalping signals M1 indicator receives a FREE BONUS — a fully automated Expert Advisor that trades based on the indicator’s signals. The indicator shows the arrows — the robot can execute the trades for you, following all signals and risk-management rules. Scalping signals M1 – a ready-made trend-following entry system for M1 Scalping signals M1 is an indicator that turns your chart into a clear action map: a colored trend channel shows the direction of the market, and
Bomb Bank Signal
Igor Pereira Calil
5 (1)
폭탄 은행 신호: MetaTrader 4의 신뢰도 지표 Bomb Bank Signal은 금융 시장에서 가장 관련성이 높은 추세를 식별하도록 설계된 MetaTrader 4의 강력한 지표입니다. 움직임을 정확하게 예측하는 도구를 찾고 있다면 Bomb Bank가 바로 여러분에게 필요한 동맹입니다. 작동 방식: 이 지표는 거래량 분석, 양초 종가, 대칭 추세 등 세 가지 방법을 결합하여 매수 및 매도 기회를 감지하고 신호를 보냅니다. Bomb Bank는 매수 기회를 포착할 때는 '폭탄'과 같고, 매도 신호를 감지할 때에는 '해골'과 같습니다. 폭탄 은행은 왜 다른가요? 완전한 신뢰성: 폭탄 은행 신호는 신호를 제거하지 않습니다. 일단 신호가 발행되면 그 신호는 계속 유지되므로 기회를 절대 놓치지 않습니다. 극도의 정확성: Bomb Bank는 잘못된 신호를 보내지 않습니다. 시장이 발전함에 따라 조정하면서 실시간으로 업데이트하지만 이전 신호의 투명성은 유지합니다. 실시간 업데이트:
BinaryIndicator
Andrey Spiridonov
BinaryIndicator is a highly accurate indicator for trading binary options. It shows excellent results in scalping. This indicator is based in multifactor analysis of trend indicators, as well as confirmation oscillators, which in the end gives an increased accuracy of signals. Advantages of the indicator Increased accuracy of signals. Excellent results when trading binary options with a short expiration time from M30 to M1 . It works on any timeframes. Works with any trade symbols. Parameters
Gold Channel XAUUSD
Paulo Rocha
5 (4)
Gold Channel is a volatility-based indicator, developed with a specific timing algorithm for the XAUUSD pair, which consists of finding possible corrections in the market. This indicator shows two outer lines, an inner line (retracement line) and an arrow sign, where the theory of the channel is to help identify overbought and oversold conditions in the market. The market price will generally fall between the boundaries of the channel. If prices touch or move outside the channel it is a tradi
The BB Reversal Arrows technical trading system has been developed to predict reverse points for making retail decisions. The current market situation is analyzed by the indicator and structured for several criteria: the expectation of reversal moments, potential turning points, purchase and sale signals. The indicator does not contain excess information, has a visual understandable interface, allowing traders to make reasonable decisions. All arrows appear to close the candle, without redrawin
제작자의 제품 더 보기
물론입니다. 아래는 제공해주신 텍스트의 한국어 번역입니다: MT4용 천문학 지표 소개: 귀하의 최상급 하늘 트레이딩 동반자 트레이딩 경험을 천체의 높이로 끌어올리기 준비가 되셨나요? MT4용 천문학 지표를 소개합니다. 이 혁신적인 도구는 복잡한 알고리즘의 힘을 활용하여 탁월한 천문학적 통찰과 정밀한 계산을 제공합니다. 정보의 우주를 손에 담다:   천문학적 데이터의 보물함을 드러내는 포괄적인 패널을 살펴보세요. 행성의 지오/헬리오센트릭 좌표, 태양/지구 거리, 크기, 길이, 별자리, 황도 좌표 및 적도 좌표, 심지어 수평 좌표 등 각각이 정밀하게 계산되고 아름답게 제시됩니다. 지표에 의해 생성된 수직선은 시간 값에 해당하여 트레이딩 여정에 우주적인 시각을 부여합니다. 행성 라인과 관계:   수정 가능한 스케일과 각도로 차트를 장식하는 행성 라인의 마법을 경험해보세요. 직관적인 컨트롤 패널을 통해 각 행성의 라인의 가시성을 손쉽게 전환할 수 있습니다. 쥰션이나 섹스타일, 사분각, 삼분
ON Trade Waves Patterns Harmonic Elliot Wolfe를 소개합니다. 이는 수동 및 자동 방법을 사용하여 다양한 시장 패턴을 감지하기 위해 개발된 고급 지표입니다. 다음은 그 작동 방식입니다: 조화적 패턴: 이 지표는 차트에 나타나는 조화적 패턴을 식별할 수 있습니다. 이러한 패턴은 Scott Carney의 "Harmonic Trading vol 1 및 2"에서 설명한 것처럼 조화적 거래 이론을 연습하는 트레이더에게 중요합니다. 수동으로 그리든 자동 감지를 사용하든 ON Trade Waves Patterns가 도움을 줄 것입니다. 컨트롤 패널: 이 지표에는 사용자 친화적인 컨트롤 패널이 있습니다. 차트 및 시간 프레임 설정을 저장하여 다양한 구성 간에 쉽게 전환할 수 있습니다. 차트 공간을 최대화하려면 최소화할 수도 있습니다. 다른 분석 도구를 사용하는 것을 선호하는 경우 닫기 버튼을 클릭하여 모든 지표 데이터를 숨길 수 있습니다. 템플릿 저장: 설정을 사
"이 인디케이터는 바이스트라 패턴 이론을 기반으로 한 입장을 감지하고 목표 및 중지 레벨을 갖춘 한정 주문을 놓을 수 있는 입장 가치를 제공합니다. 이를 통해 리스크 비율을 계산할 수 있습니다. 참고: 이 인디케이터에는 EA에서 사용할 수 있는 버퍼가 있습니다. 이 제품을 사용하는 동안 좋은 자금 관리를 실천하는 것이 중요합니다. 시간 프레임을 변경할 때, 인디케이터는 마지막 세션에서 사용한 템플릿을 저장합니다. 이 방법을 배우려면 구매 후 저희에게 연락하고 리뷰를 추가해주시기 바랍니다. 매개변수: 시스템 비주얼 사용 - 이 제품의 비주얼 테마를 활성화/비활성화합니다. 속도 관련 - 마지막 웨이브의 빠른 움직임 중에만 패턴을 감지하도록 활성화/비활성화합니다. 마지막 양식 카운터 표시 - 양식 타이머를 활성화/비활성화합니다. 양식 카운터 색상 - 양식 타이머 텍스트의 색상입니다. 상승 패턴 색상 - 상승 패턴의 색상입니다. 하락 패턴 색상 - 하락 패턴의 색상입니다. 알림 보내기 -
ON Trade Pivoteer
Abdullah Alrai
4 (1)
Introducing the Pivot Point Selector Indicator: Your Ultimate Tool for Custom Pivot Levels Are you ready to take your trading to the next level? Say hello to the Pivot Point Selector Indicator, a game-changing tool that puts you in control of your pivot levels. This innovative indicator empowers you to choose three specific points that will determine the pivot level calculations, giving you unparalleled customization and precision in your trading strategy. Key Features and Benefits: Custom Pivo
FREE
이 인디케이터는 거래 차트에 돈치안 채널을 시각적으로 표시하는 목적으로 사용됩니다. 돈치안 채널은 특정 기간 동안의 최고점과 최저점 사이의 범위를 나타내는 간단한 기술 도구입니다. 이 인디케이터는 가격 움직임의 시각적 분석을 향상시키며 잠재적인 돌파 지점 및 추세 지속 포인트에 대한 통찰력을 제공합니다. 돈치안 채널은 현재 시간 프레임과 더 높은 시간 프레임 모두에 적용할 수 있으며 이 옵션을 활성화할 수 있습니다. 인디케이터 주요 기능: Use_System_Visuals: 이 매개변수를 활성화하면 시스템의 시각적 스타일 사용 또는 인디케이터의 외관을 사용자 정의할 수 있습니다. 활성화되면 인디케이터의 시각적 요소가 거래 플랫폼의 전반적인 테마에 일치하도록 조정됩니다. Signal_from_HT_Timeframe: 이 옵션을 활성화하면 더 높은 시간 프레임에서 신호를 수신할 수 있습니다. 다시 말해 더 긴 시간 프레임에서의 돈치안 채널 동작을 고려하여 현재 시간 프레임에서의 거래 결
FREE
ON Trade Pivots
Abdullah Alrai
ON Trade Pivots is A technical indicator that Draws all Pivot levels depending on time frame that defined in settings. Notes It will be good tool for all traders who use pivot levels in their trades. Let me inform you that this indicator draw this level as buffers not as objects then you can connect it easily to EA. This indicator allow you to find pivots levels for any time frame not only daily you are free to choose time frame from settings. Parameters Use_System_Visuals - Enable /Disable Sy
FREE
골드 그램 가격 계산기 인디케이터 소개 지역 통화에서의 금 가격을 항상 확인하고 싶으신가요? 더 이상 찾을 필요가 없습니다. 골드 그램 가격 계산기 인디케이터는 선호하는 지역 통화에서 그램 당 금 가격을 실시간으로 계산할 수 있는 혁신적인 도구를 제공합니다. 이 인디케이터를 통해 금융적인 통찰력을 활용하여 정보에 기반한 결정을 내릴 수 있습니다. 주요 특징: 지역화된 금 가격: 골드 그램 가격 계산기 인디케이터는 그램 당 금속 가격을 제공합니다. 구체적으로 그램 당 금 가격을 지역 통화에 맞게 조정한 것입니다. 이를 통해 익숙한 통화로 금 가치를 편리하게 추적할 수 있습니다. 사용자 친화적 설정: 우리의 인디케이터는 편의성을 고려하여 디자인되었습니다. 인디케이터 설정에서 직접 조정하거나 주요 차트에서 조정할 수 있어, 원활하고 맞춤화된 경험을 제공합니다. 매개변수 설명: Use_System_Theme (시스템 테마 사용): 선호하는 색상 스킴을 선택할 수 있는 옵션으로, 인디케이터의
FREE
ON Trade Angler
Abdullah Alrai
"이 지표는 간단한 트렌드 검출 도구입니다. 스캘핑 모드와 같은 전략과 함께 사용하여 좋은 진입점을 얻을 수 있습니다. 가격 주변에 채널을 그릴 것이며, 시간이 경과함에 따라 확장됩니다. 사용자 정의 기간에는 시간과 가격을 함께 고려하는 알고리즘에 따라 확장의 시작 지점으로 돌아갈 것입니다. 반전의 표시가 나타난 후 채널의 하한에서 매수할 수 있습니다. 그리고 반전의 표시를 본 후 채널의 상한에서 판매할 수 있습니다. 매개변수: 시스템 테마 사용: 여기서 테마를 선택할 수 있습니다. 계산 유형: 다음 세 가지 옵션 중에서 선택할 수 있습니다: 1- 원본 계산: 이 영역은 그 날의 트렌드를 정의하며, 이 영역 위에 열거나 아래에 열리면 됩니다. 2- 새로운 계산: 트렌드를 감지하는 데 의존할 채널을 그릴 것입니다. 3- Sheph: 새로운 계산 방법과 호환되지 않는 기호에 그려지는 수정된 채널입니다." 더 궁금한 사항이나 추가 지원이 필요하시면 언제든지 물어보세요!
이 인디케이터는 엘리어트 파동 이론과 두 가지 방식으로 작동합니다: 자동 작동: 이 모드에서는 인디케이터가 엘리어트 파동 이론에 따라 차트 상의 모든 5개의 모티브 웨이브를 자동으로 감지하고 예측 및 잠재적인 반전 지역을 제공합니다. 또한 중요한 개발 사항을 트레이더에게 알릴 수 있는 경보 및 푸시 메시지를 생성할 수 있는 능력을 갖추고 있습니다. 이 자동 기능은 엘리어트 파동 패턴의 식별과 분석 프로세스를 간소화합니다. 수동 작동: 이 옵션은 엘리어트 파동 이론을 수동으로 다루고 싶은 트레이더를 위해 설계되었습니다. 이를 통해 사용자는 아홉 가지 다른 등급을 사용하여 웨이브를 그릴 수 있습니다. 각 등급은 나타난 후에 차트에 그려진 라인을 조정하여 개별적으로 정의할 수 있습니다. 이 기능은 웨이브를 수동으로 그리는 프로세스를 간소화하며 더 효율적으로 만들어 줍니다. 중요한 점으로 모든 그림 데이터가 미래 참조를 위해 플랫폼 데이터 폴더에 저장된다는 것을 기억해야 합니다. 파라미터:
"우리는 트레이딩 전략을 향상시키고 시장 트렌드에 대한 정확한 통찰력을 제공하기 위해 개발된 강력한 외환 인디케이터를 소개합니다. 이 혁신적인 도구는 세밀한 촛대 측정을 분석하고 최적의 정확도를 얻기 위해 조정을 수행하는 정교한 사용자 정의 알고리즘을 사용합니다. 결과는 차트에 정밀하게 배치된 화살표 세트로 전략적인 진입 지점을 표시합니다. 이 인디케이터의 창의력은 촛대 패턴의 힘을 활용하고 정밀하게 교정된 조정과 결합하는 능력에 있습니다. 이를 통해 시장 움직임에 대한 독특한 시각을 제공하며 거래 결정에 우위를 제공합니다. 이 인디케이터의 특출한 특징 중 하나는 H1 시간 프레임에서의 뛰어난 성능입니다. 이 시간 프레임에 특화된 트레이더들은 많은 정밀한 진입 기회를 제공한다는 것을 발견할 것입니다. 그러나 우리는 시너지의 힘을 믿습니다. 이 인디케이터 자체로도 강력한 도구이지만, 보다 포괄적인 트레이딩 전략에 통합될 때 그 성능은 더욱 높아집니다. 기존의 접근 방식과 결합함으로써
이 지표는 간 이론에서 파생된 특정한 다이아몬드 간 웨이브 패턴을 검출하고 시각화하는데 사용됩니다. 이 패턴의 ABC 포인트를 기반으로 포인트(P)를 그려 시장의 잠재적 반전에 대한 트레이더의 통찰력을 제공합니다. 더불어, 이 지표는 예측된 포인트(P)로부터 수직선을 그려 시장의 잠재적 반전 포인트를 더 쉽게 식별할 수 있도록 돕습니다. 지표 기능: Use_System_Visuals: 이 매개변수를 활성화하면 시스템의 시각적 테마를 지표의 외관에 사용하거나 사용하지 않을 수 있습니다. 이 옵션을 활성화하면 지표의 시각적 요소는 거래 플랫폼의 전체 테마와 일관성을 유지합니다. Show_Last_Candle_Counter: 이 옵션을 활성화하면 현재 양초가 종료될 때까지 남은 시간을 나타내는 카운터가 표시됩니다. 이 타이머는 특정 양초 패턴이나 시간 간격에 의존하는 트레이더에게 유용할 수 있습니다. Candle_Counter_Color: 트레이더는 양초 카운터 텍스트의 색상을 사용자 정
"Fibo Star" 지표는 별 모양으로 피보나치 팬을 차트에 표시하는 데 사용됩니다. 이 피보나치 팬은 가격 움직임을 분석하는 강력한 도구로, 잠재적인 지지 및 저항 레벨에 대한 통찰력을 제공할 수 있습니다. 이 지표는 그리기 및 설정 과정을 간편화하기 위한 사용자 친화적인 제어판을 제공하여 시간과 노력을 절약할 수 있도록 돕습니다. 사용 방법: 이 지표는 수동 사용을 위한 것입니다. 효과적으로 사용하려면 다음 단계를 따르세요: 피보나치 팬을 기반으로 할 고점과 저점을 차트에서 식별합니다. 이러한 고점과 저점에 보라색 선을 그립니다. 가격이 이러한 선과 상호 작용하면, 이 지표가 동적인 지지 및 저항 레벨로 작동하는 것을 관찰하세요. 매개변수: Use_System_Theme: 이 매개변수를 사용하여 지표의 외관을 거래 플랫폼의 전반적인 테마에 맞출지 또는 사용자 정의할지 선택할 수 있습니다. Levels_Color: 피보나치 팬의 레벨에 적용할 색상을 선택합니다. Levels_S
"통화 강도 인디케이터"는 외환 시장에서 서로 다른 통화의 상대적인 강도에 관한 정보를 제공하기 위해 개발된 강력한 도구입니다. 각 통화의 강도를 해당 시간 프레임을 기반으로 계산하고 표시함으로써 이 인디케이터는 특히 유의미한 발산이나 교차가 관찰될 때 잠재적인 거래 기회를 식별하는 기회를 제공합니다. 인디케이터의 주요 특징: 1. 통화 강도 계산: 이 인디케이터는 각 통화의 강도를 해당 시간 프레임을 기반으로 계산합니다. 이 계산에는 지정된 기간 동안 한 통화가 다른 통화들의 바구니에 대한 성과를 평가하는 과정이 포함됩니다. 이를 통해 트레이더는 각 통화의 상대적인 강도 또는 약함을 이해할 수 있습니다. 2. 수축과 발산: 두 통화의 강도 간에 수축 또는 발산 움직임이 있는 경우, 이는 잠재적인 거래 기회를 나타낼 수 있습니다. 예를 들어 한 통화가 상대적으로 강화되는 동안 다른 통화가 약화되는 경우, 가능한 진입 지점을 나타낼 수 있습니다. 3. 제로 레벨 교차: 이 인디케이터는
간 스퀘어 지표는 W.D. 간이 쓴 "시장 예측을 위한 수학적 공식" 기사에 기반한 강력한 시장 분석 도구입니다. 이 도구는 수학적 개념과 간 이론을 사용하여 정확한 시장 분석을 수행합니다. 144, 90, 52의 제곱과 9의 제곱을 사용합니다. 또한 의 9의 제곱근 및 해당 제곱의 채널 및 스타 패턴과의 관련성을 통합합니다. 사용자 메뉴얼 및 적용: 이 지표를 사용하기 전에 사용자 메뉴얼을 읽고 질문이 있을 경우 문의하시기 바랍니다. 전체 메뉴얼은 웹사이트에서 제공됩니다. MT5의 전체 버전을 구매하거나 MT4의 무료 버전을 테스트할 수 있습니다. 두 버전 모두 링크에서 확인하실 수 있습니다. 주요 기능 및 기능: 간 스퀘어 지표는 정확한 결정을 위해 기하학적 개념과 간 이론을 활용하는 시장 분석을 위한 포괄적인 도구 집합을 제공합니다. 주요 기능은 다음과 같습니다. 9의 제곱 분석: 이 지표는 9의 제곱에 대한 수평 선, 스타 패턴, 그리드 및 간 팬을 그릴 수 있습니다. 간 이
이 인디케이터는 수동 및 자동 방법으로 차트에 그려진 조화 패턴을 감지합니다. 사용 후기를 추가하십시오. 참고 사항: 이 인디케이터에는 제어 패널이 있으며 모든 (차트 및 시간대) 설정을 저장합니다. 더 많은 공간을 확보하려면 최소화할 수 있으며 다른 분석 도구와 함께 작업하려면 모든 인디케이터 데이터를 숨기려면 닫기 버튼을 누를 수 있습니다. 이 인디케이터를 사용하고 설정을 변경하면 이동평균이나 볼린저 밴드와 같은 인디케이터를 추가할 때 편집 내용의 템플릿을 자동으로 저장하고 필요할 때 언제든지 로드할 수 있습니다. Windows 10을 사용하는 경우 MetaTrader 아이콘을 마우스 오른쪽 단추로 클릭한 다음 호환성 > 고DPI 설정 변경 > 시스템(개선)을 선택하여 최상의 화면 설정을 사용할 수 있습니다(HD 기기에서 수행되어야 함). 이 인디케이터는 본질적으로 차트에서 조화 거래 이론을 해석하는 것으로 조화 패턴을 감지합니다. 배우고 싶다면 Scott Carney의 "Har
Hikkake 일본 캔들 패턴 인디케이터는 차트에 형성되는 모든 Hikkake 가격 액션 패턴을 식별하고 감지하기 위해 특별히 설계된 전문 도구입니다. 이 패턴은 내부 바에서의 가짜 돌파 개념을 기반으로 합니다. 이 인디케이터는 차트의 마지막 다섯 개의 캔들을 분석하여 Hikkake 패턴의 특성이 충족되는지 여부를 결정합니다. 이 패턴이 확인되면 해당 패턴을 구성하는 캔들 주위에 사각형을 그려 트레이더가 패턴을 더 쉽게 식별하고 해석할 수 있도록 돕습니다. 인디케이터의 주요 기능: 패턴 감지: Hikkake 인디케이터는 특히 Hikkake 가격 액션 패턴을 감지하고 강조하는 데 특화되어 있습니다. 이러한 패턴은 내부 바 형성에서 가짜 돌파 개념을 중심으로 합니다. 마지막 다섯 개 캔들의 확인: Hikkake 패턴의 존재를 확인하기 위해 인디케이터는 차트의 마지막 다섯 개의 캔들을 연구합니다. 이 캔들의 배열과 관계를 평가하여 패턴의 기준을 충족하는지 여부를 판단합니다. 사각형 시각화
강력한 가격 행동 패턴을 감지하는 기술적 지표: 핀바, 인사이드 바, 아웃사이드 바 소개: 기술적 분석 분야에서 가격 행동 패턴은 잠재적인 시장 움직임의 중요한 지표로 기능합니다. 우리는 차트상의 견고한 가격 행동 패턴을 식별하는 데 도움을 주는 정교한 기술적 지표를 개발했습니다. 우리의 지표는 핀바, 인사이드 바, 아웃사이드 바라는 세 가지 중요한 패턴을 감지하는 데 특화되어 있습니다. 주요 감지 패턴: 핀바: 핀바 패턴은 시장 트렌드의 잠재적인 반전을 나타내는 단일 양초 형성입니다. 작은 몸체와 몸체 위나 아래로 튀어나온 긴 꼬리 또는 "위크"로 특징지어집니다. 상승 핀바는 가능한 상승 반전을 시사하며, 하락 핀바는 하락 반전을 시사합니다. 인사이드 바: 인사이드 바 패턴은 단일 양초의 전체 가격 범위가 이전 양초의 가격 범위 내에 들어가는 경우 발생합니다. 이 패턴은 임시적인 증시 합리화나 불확실성을 나타내며 종종 양방향으로의 돌파를 앞서는 신호로 작용합니다. 아웃사이드 바:
메타트레이더용 숫자로 이루어진 지지와 저항 인디케이터 소개: 메타트레이더용 숫자로 이루어진 지지와 저항 인디케이터로 기술적 분석의 새로운 차원을 경험해보세요. 이 독특한 도구는 숫자학의 힘을 활용하여 차트 상에서 주요 지지와 저항 레벨을 식별하여 가능한 가격 움직임에 대한 가치 있는 통찰력을 제공합니다. 주요 개념: 트레이딩에서의 숫자학: 숫자학은 숫자와 그들의 의미를 미스틱하게 연구하는 것으로, 트레이딩에 숫자학 원리를 적용하면 특정한 의미를 가진 숫자를 식별하고 이를 사용하여 매수 또는 매도 활동이 발생할 가능성이 있는 가격 레벨을 예측하는 것을 의미합니다. 인디케이터 기능: 우리의 인디케이터는 숫자학의 숨겨진 패턴을 활용하여 차트 상에 지지와 저항 레벨을 그립니다. 이러한 레벨은 금융 시장에서 중요한 의미를 가진 주요 숫자학 숫자에서 파생됩니다. 학습을 위한 선호되는 단계: 숫자학 이해: 인디케이터를 사용하기 전에 숫자학의 기본 개념과 트레이딩에서의 중요성을 이해하는 시간을 가
Shepherd Numerology Levels 인디케이터를 활용하여 혁신적인 거래 방식을 탐색해보세요. 이 혁신적인 도구는 고대의 숫자학 지식을 현대적인 거래 기술과 결합하여 차트에서 중요한 지지와 저항 수준을 식별할 수 있도록 돕습니다. 9의 제곱법(Square of Nine)을 사용하여 이 인디케이터는 시장 역학에 대한 독특한 관점을 제공하며 더욱 정보를 풍부하게 제공하여 거래 결정을 내리게 합니다. 주요 기능 및 이점: 숫자학과 9의 제곱법: Shepherd Numerology Levels 인디케이터는 9의 제곱법을 활용하여 가격 움직임의 숨겨진 패턴을 해석합니다. 이 방법은 시장에서 가능한 추세 반전 지점과 역전을 예측하는 데 정확성이 높다고 알려져 있습니다. 정확한 지지와 저항 수준: Shepherd Numerology Levels를 사용하면 전통적인 분석을 통해 명확하지 않을 수 있는 정확한 지지와 저항 수준을 식별할 수 있습니다. 이러한 수준은 숫자학의 원리에서 유래되
ON Trade Numerology Mirror 인디케이터 소개: 숫자학을 통한 숨겨진 반전 패턴 해석 ON Trade Numerology Mirror 인디케이터로 기술적 분석의 새로운 차원을 체험하세요. 이 혁신적인 도구는 고대 숫자학의 지식을 활용하여 차트에서 중요한 가격 반전 수준을 식별합니다. 숫자를 반전된 위치로 재배치하여 이 인디케이터는 숫자의 상징적 의미를 활용하여 가능한 가격 반전을 예측하는 능력을 제공하며 거래 결정에 독특한 이점을 제공합니다. 주요 기능과 장점: 숫자학 활용: ON Trade Numerology Mirror 인디케이터는 신비로운 숫자학의 힘을 결합하여 숨겨진 가격 반전 패턴을 해석합니다. 숫자를 반전된 위치로 재배치함으로써 숫자의 상징적 의미를 활용하여 가능한 가격 반전을 예측합니다. 반전된 숫자 패턴: 이 인디케이터는 숫자열의 반전 개념을 적용하여 차트에 가격 반전 수준을 그립니다. 이러한 수준은 반전된 숫자 패턴에서 유래되며 시장 역학에 대한 독
ON Trade Optuma Astro
Abdullah Alrai
5 (5)
물론입니다. 아래는 제공해주신 텍스트의 한국어 번역입니다: MT4용 천문학 지표 소개: 귀하의 최상급 하늘 트레이딩 동반자 트레이딩 경험을 천체의 높이로 끌어올리기 준비가 되셨나요? MT4용 천문학 지표를 소개합니다. 이 혁신적인 도구는 복잡한 알고리즘의 힘을 활용하여 탁월한 천문학적 통찰과 정밀한 계산을 제공합니다. 정보의 우주를 손에 담다: 천문학적 데이터의 보물함을 드러내는 포괄적인 패널을 살펴보세요. 행성의 지오/헬리오센트릭 좌표, 태양/지구 거리, 크기, 길이, 별자리, 황도 좌표 및 적도 좌표, 심지어 수평 좌표 등 각각이 정밀하게 계산되고 아름답게 제시됩니다. 지표에 의해 생성된 수직선은 시간 값에 해당하여 트레이딩 여정에 우주적인 시각을 부여합니다. 행성 라인과 관계: 수정 가능한 스케일과 각도로 차트를 장식하는 행성 라인의 마법을 경험해보세요. 직관적인 컨트롤 패널을 통해 각 행성의 라인의 가시성을 손쉽게 전환할 수 있습니다. 쥰션이나 섹스타일, 사분각, 삼분각, 트
Introducing the ON Trade Melad Pattern Indicator: Enhance Your Trading Strategy with Breakout Patterns Discover the power of the ON Trade Melad Pattern Indicator—an intuitive tool designed to elevate your trading decisions by detecting and highlighting breakout patterns on your charts. This indicator is your key to identifying crucial breakout points and potential trend shifts with simplicity and precision. Key Features: Breakout Pattern Detection: The ON Trade Melad Pattern Indicator focuse
This indicator will give you entries as result of scalping strategy that will be applied on 14 symbols in same time and you are able to be notified with this entries  Note :   This indicator for scalping on 5 minutes timeframe only . How to use it : 1-Open chart and adjust settings (edit symbols names as your platform names , activate the alert system if you need it . 2-Wait for any signal you have it from this scanner you will have it as alert and as notification and you will see it on board
This indicator gives you the signal of real cross on stochastic indicator. This indicator is easy to attach to an ea. This indicator will work best on All time frames. Arrow appears depending on many algorithms that study the cross parameters. Indicator properties Use_System_Visuals: enable/disable visual styles. Stochastic_K_Period. Stochastic_D_Period. Stochastic_Slowing. Use_Notifications: enable/disable Push Notifications. Use_Alert: enable/disable Alerts. Use_E_Mail: enable/disable Email n
ON Trade VSA
Abdullah Alrai
"ON Trade VSA"를 소개합니다 - 볼륨 및 분포 분석을 위한 궁극적인 도구! 우리의 고급 인디케이터 "ON Trade VSA"를 사용하여 볼륨 스프레드 분석(VSA)의 힘을 발휘해 보세요. VSA는 시장 강도를 평가하고 추세를 식별하며 정보에 근거한 결정을 내리는 트레이더에 의해 사용되는 강력한 방법론입니다. "ON Trade VSA"가 여러분의 트레이딩 아카이브에서 빠질 수 없는 도구가 되는 주요 기능을 살펴보겠습니다: 다색 볼륨 캔들 : 평균 움직임을 기반으로 서로 다른 색상을 볼륨 캔들에 할당하는 독특한 기능을 통해 시장 역학을 파악할 수 있습니다. 이 직관적인 시각화는 시장 감정 변화를 빠르게 파악하는 데 도움을 줍니다. 강력한 트렌드 감지 : 저희의 인디케이터는 기본적인 것을 넘어서 있습니다. 그래프 상에서 가장 강력한 트렌드를 정확하게 식별하고 표시하여 주류 시장 방향을 명확히 볼 수 있게 해줍니다. 볼륨-레인지 곱셈기 : 범위에 볼륨을 곱하는 능력을 사용하여 숨
This product is a part of  ON Trade Waves Patterns Harmonic Elliot Wolfe you can test free version on EURJPY from this link  Wolf Waves Indicator 울프 웨이브(Wolf Waves) 발견하기 - 귀하의 궁극적인 거래 도구! 어떤 시간 프레임에서든 울프 웨이브를 쉽게 찾을 수 있는 강력한 도구를 찾고 계신가요? 더 이상 찾을 필요가 없습니다! 저희의 울프 웨이브 인디케이터는 이 작업을 쉽게 해내며, 여기서 왜 귀하에게 완벽한지 설명하겠습니다: 주요 기능: 자동 감지: 우리의 울프 웨이브 인디케이터는 복잡한 알고리즘을 사용하여 키 포인트를 자동으로 찾아 차트에 해당 선을 그립니다. 수동으로 패턴을 찾아 다니는 번거로움을 이제 더 이상 느낄 필요가 없습니다. 사용자 친화성: 이 인디케이터는 사용하기 간단하게 설계되어 있어 경험이 풍부한 트레이더든 울프 웨이브에 처음 접하는
This program serves as an effective tool for sending messages through a Telegram bot using the MetaTrader platform. It enables you to send your trading recommendations related to the orders you open on the trading platform directly to your Telegram channel or group. These messages may include details about open trades and can be accompanied by illustrative images of the orders. Alternatively, they can be configured to be without images based on your preferences. This means that if you are the ow
우리의 새로운 지표를 소개합니다: [ON Trade Breakout Zone] 모든 트레이더를 위한 간단하면서도 강력한 시장 분석 도구! 프로와 초보 트레이더 모두에게 적합 당신의 거래 전략을 강화할 준비가 되셨나요? 우리의 최신 지표는 시장 분석을 간소화하고 모든 수준의 트레이더에게 자유로운 수익을 얻을 수 있는 열쇠입니다. 당신이 경험이 풍부한 전문가이든 막 시작한 초보자이든, [ON Trade Breakout Zone]은 시장의 잠재적인 이익을 해제할 수 있는 키입니다. [ON Trade Breakout Zone] 사용 방법: 이 지능형 도구는 매일 고급 알고리즘을 사용하여 차트에 손쉽게 영역을 그립니다. 여기에서 최대한 활용하는 방법입니다: 영역 식별: [ON Trade Breakout Zone]은 차트에서 핵심 영역을 정확하게 식별하여 잠재적인 거래 기회를 쉽게 발견할 수 있도록 도와줍니다. 거래 실행: 가격이 그려진 영역의 한 쪽으로 이동할 때까지 기
User Manual Download link: https://ontrd.com/our-books/ For all who are asking about indicator  ON Trade Numerology Station It obtain about 16 numerology strategies it make together completed unit control your trading . Basic strategies to work with it are 3 strategies statistics about them are the following : 1. RBA levels success rate more then 95%. 2. FF more then 96%  3.RBA SUN 98% We will not say 100 % as they are .. Ratio rates as following :  1.Rba levels more then 1/3 to 1/6 . 2.FF MORE
이 제품을 사용하면 다양한 기능으로 주문과 계정을 관리할 수 있습니다. 1- 계정 크기/SL 크기/1 로트 크기의 페어 포인트 값에 따라 올바른 로트 크기를 계산합니다. 2- 라인 위치(타겟 sl tp)에 따라 현재 주문 상황을 알려줍니다. 3- 버튼을 1번 누르면 모든 주문 target/sl이 이동합니다. 4- 귀하의 계정에 대한 정보와 주문을 개시하는 데 필요한 증거금이 제공됩니다. 5- 모든 주문(기호 또는 전체)을 청산하는 기능이 있습니다. 6- 손익분기점 및 이익 보호 기능이 있습니다. 7- 모든 쌍에서 사용하기 쉽습니다. 리뷰를 추가하는 것을 잊지 마세요. 이 제품을 사용하면 다양한 기능으로 주문과 계정을 관리할 수 있습니다. 1- 계정 크기/SL 크기/1 로트 크기의 페어 포인트 값에 따라 올바른 로트 크기를 계산합니다. 2- 라인 위치(타겟 sl tp)에 따라 현재 주문 상황을 알려줍니다. 3- 버튼을 1번 누르면 모든 주문 target/sl이 이
필터:
리뷰 없음
리뷰 답변