RSI Multi Length Indicator MT4
RSI Multi Length Indicator for MT4
The RSI Multi Length Indicator for MT4 computes Relative Strength Index (RSI) values over several time periods at once. This multi-period analysis allows it to adapt to varying market conditions and offer more refined entry and exit cues.
It features two horizontal levels—colored red and green—drawn based on internal logic.
Depending on where the RSI line sits in relation to these levels, the indicator reveals zones of potential overbought or oversold market behavior.
«Indicator Installation & User Guide»
MT4 Indicator Installation | RSI Multi Length Indicator MT5 | ALL Products By TradingFinderLab | Best MT4 Indicator: Refined Order Block Indicator for MT4 | Best MT4 Utility: Trade Assistant Expert TF MT4 | TP & SL Tool: Risk Reward Ratio Calculator RRR MT4 | Prop Firm Protector: Prop Draw Down Protector Expert Advisor MT4 | Money Management: Easy Trade Manager MT4
Specifications Table for the RSI Multi Length Indicator
Here are the technical attributes of the RSI Multi Length Indicator:
| Category | Oscillator – Overbought/Oversold – Signal Generator |
| Platform | MetaTrader 4 |
| Skill Level | Intermediate |
| Indicator Type | Trend Reversal – Trend Continuation |
| Timeframe | Supports Multiple Timeframes |
| Trading Style | Scalping – Intraday – Swing Trading |
| Market | Universal – Works Across All Markets |
RSI Multi Length Indicator Overview
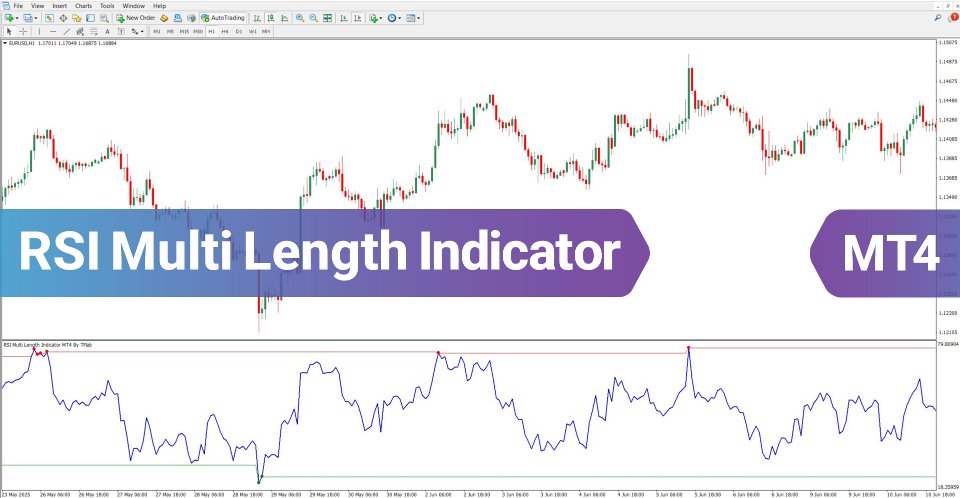
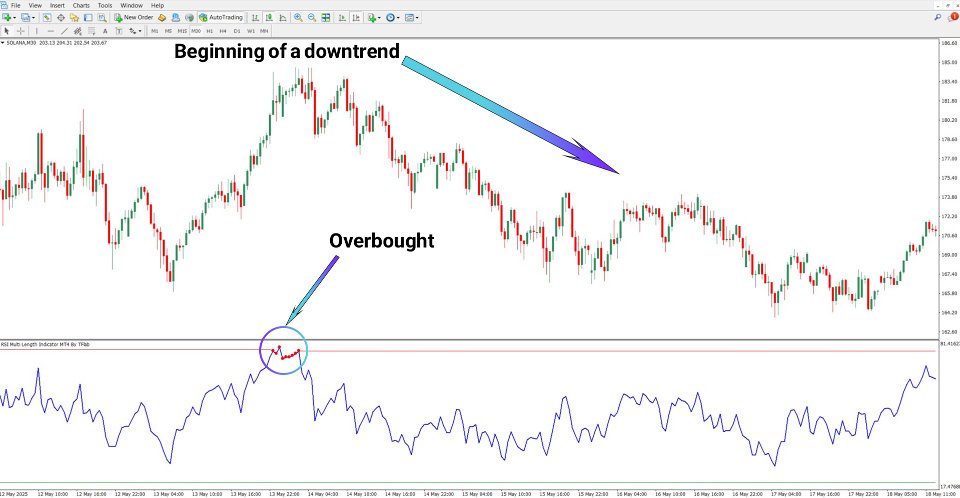
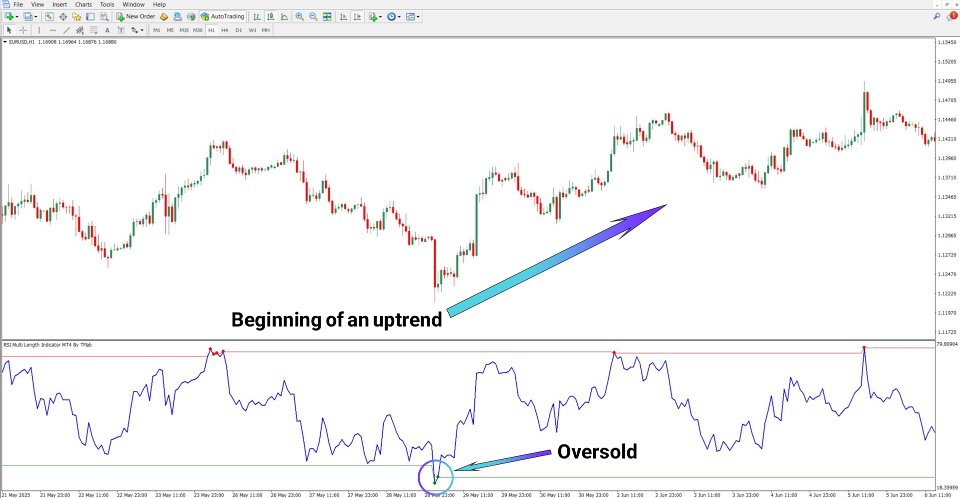
The indicator triggers signals whenever the RSI line breaks above or below the predefined red or green thresholds. A move above the red level signals an overbought condition and is shown using red dots. A drop below the green line indicates oversold territory, represented by green dots.
Buy Signal
On the EUR/USD 1-hour chart, the RSI curve falls beneath the green zone. The indicator highlights this oversold condition by plotting green dots. These dots are interpreted as a cue to consider long trades, as demonstrated in the chart example.
Sell Signal
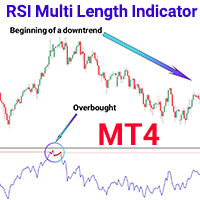
Looking at the Solana chart on the 30-minute timeframe, the RSI moves above the red boundary. This action designates an overbought zone, marked with red dots, which can be taken as a prompt to initiate short trades.
RSI Multi Length Indicator Settings
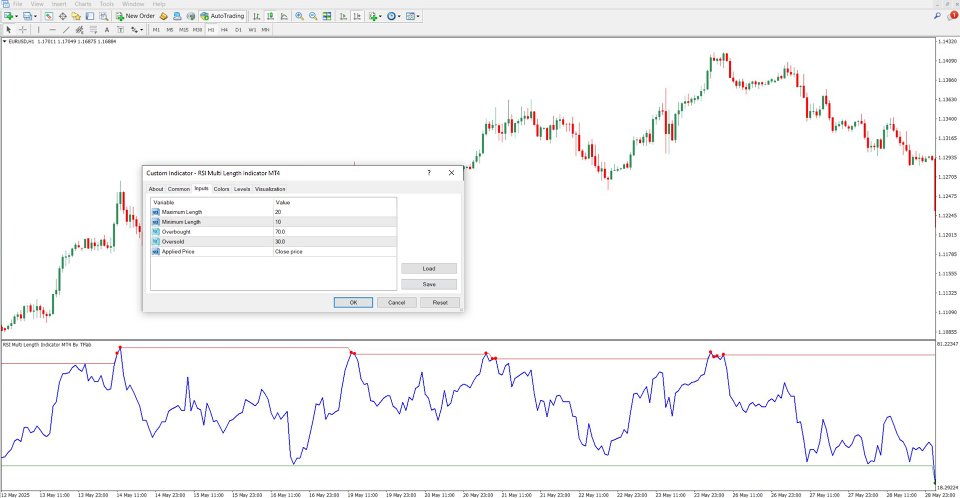
Configuration options available in this oscillator include:
- Maximum Length – Uses a higher RSI period; results in smoother signals with less noise
- Minimum Length – Uses a shorter RSI period; produces faster, more responsive signals
- Overbought – Threshold marking the beginning of overbought territory
- Oversold – Threshold marking the start of oversold territory
- Applied Price – Selects the type of price data (close, open, etc.) used in RSI computation
Conclusion
The RSI Multi Length Indicator for MT4 measures RSI values across a range of timeframes in parallel, offering improved accuracy over the standard RSI tool. With its visual display of overbought and oversold regions and real-time signal markings, this tool helps traders better time their entries and exits in volatile markets.
