FMCBR Predator MTF
- インディケータ
-
Ricky Andreas
 🚀 ARFX TOOLS – The Smart Solution for Modern Traders!
A powerful 3-in-1 toolset to optimize your trading strategy:
🔍 1. MULTI TREND SCANNER
Automatically monitor trend directions across multiple time frames. Instantly detect trend strength and potential reversals at a glance! - バージョン: 1.1
- アップデート済み: 17 8月 2025
- アクティベーション: 5
ALL IN ONE INDICATOR :
Auto Multi Trend : Alligator_MTF ( Trend Is Your Friend )
Auto Fibo CBR : Breakout Confirmation
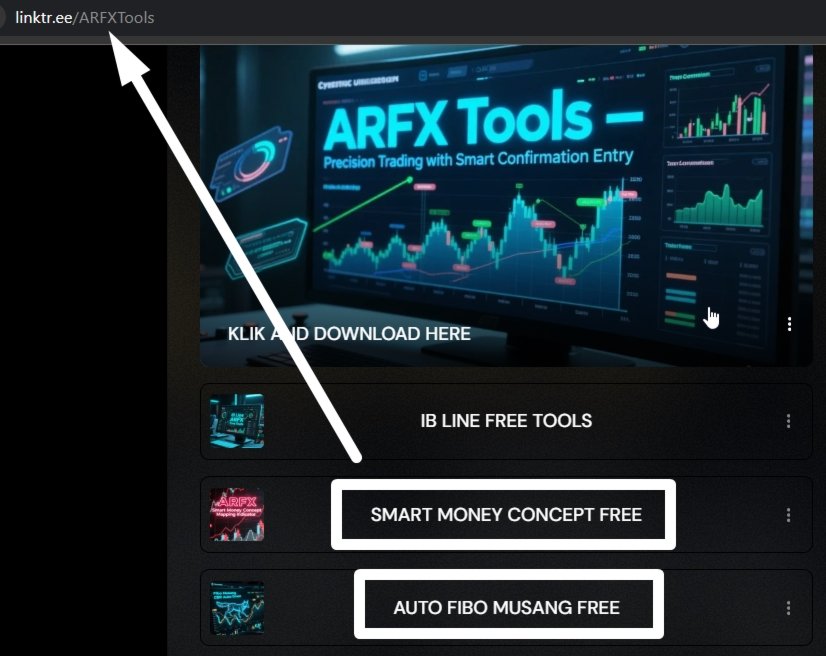
Auto Smart Money Area : Download Here https://linktr.ee/ARFXTools
🚀 Alligator Fibo Musang CBR Alert Trend Scanner 🔍 A Smart Indicator Powered by 3 Proven Trading Systems in One!
This all-in-one indicator is designed for traders who want to analyze market direction quickly, accurately, and with ease.
It combines 3 time-tested strategies to give you a trading edge:
✅ Alligator – Your main tool for trend direction & market mapping
✅ Fibo Musang CBR – Triggers automatic alerts when breakout zones are hit
✅ Multi Trend Scanner – Confirms trend direction using Alligator-based signals for higher accuracy
🟢 How to Enter a BUY Trade — Simple & Effective!
-
🔔 Wait for a Fibo BUY alert (blue color)
-
📊 Confirm with 2–3 BUY signals from the Trend Scanner
-
🎯 Use Fibonacci levels to set your TP & SL (Risk:Reward)
-
💡 Best entry moment: Right when the Fibo signal appears
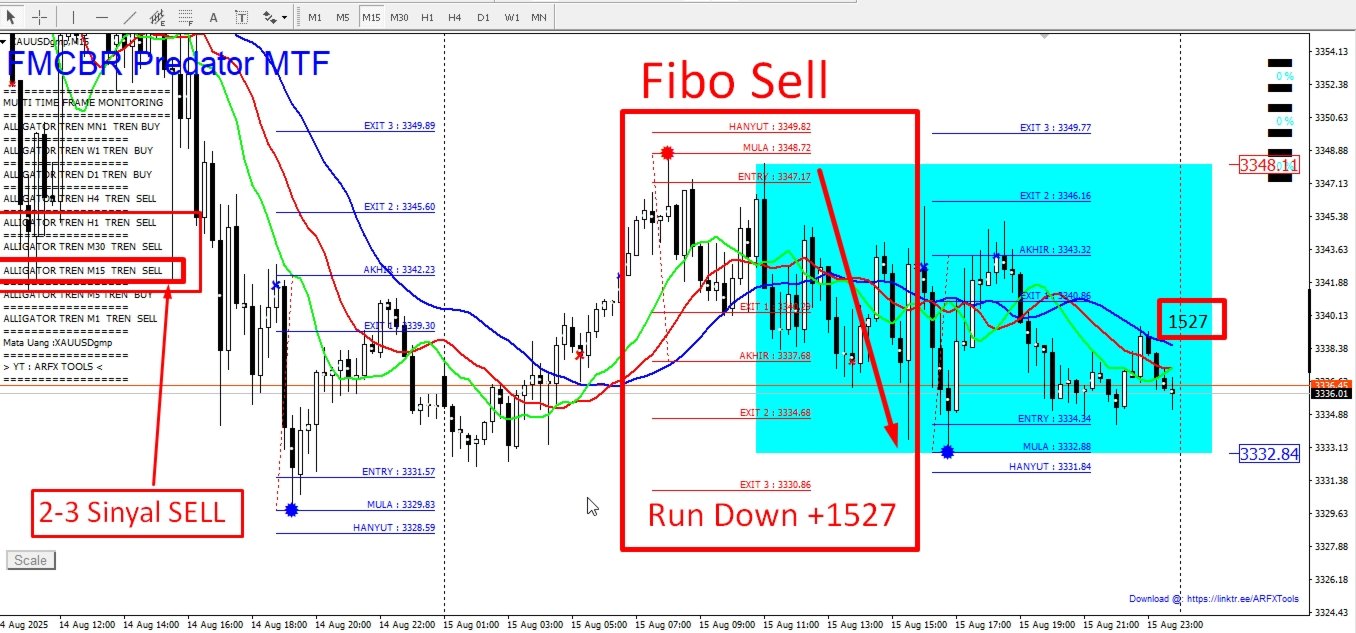
🔴 How to Enter a SELL Trade — Fast & Reliable!
-
🔔 Wait for a Fibo SELL alert (blue color)
-
📉 Confirm with 2–3 SELL signals from the Trend Scanner
-
🎯 Use Fibonacci levels as your guide for Risk:Reward
-
💡 Higher accuracy when price touches a Fibo area before entering
💼 Perfect For:
-
Beginners who need clear visual guidance
-
Experienced traders seeking faster decision-making
-
Breakout, trend-following, and smart-entry strategy users
🎁 Bonus: Works on multiple pairs and timeframes.
✨ With this indicator, you’re not just looking at the charts — you’re READING the opportunities!
🚀 Alligator Fibo Musang CBR Alert Trend Scanner
🔍 Gabungan 3 Sistem Trading Andal dalam Satu Indikator Cerdas!
Indikator ini dirancang khusus untuk trader yang ingin membaca arah pasar dengan cepat, akurat, dan tanpa ribet.
Menggabungkan 3 strategi populer yang telah terbukti efektif:
✅ Alligator – Sebagai kompas utama untuk membaca trend & market mapping
✅ Fibo Musang CBR – Memberi alert otomatis saat terjadi breakout penting
✅ Multi Trend Scanner – Memberi konfirmasi sinyal berbasis Alligator untuk meningkatkan akurasi
🟢 Cara Entry BUY — Mudah & Efektif!
-
🔔 Tunggu munculnya alert Fibo BUY (warna biru)
-
📊 Pastikan ada 2–3 sinyal BUY dari Trend Scanner
-
🎯 Gunakan level Fibonacci sebagai panduan menentukan TP & SL
-
💡 Waktu entry terbaik: saat sinyal Fibo pertama kali muncul
🔴 Cara Entry SELL — Simpel & Teruji!
-
🔔 Tunggu munculnya alert Fibo SELL (warna biru)
-
📉 Konfirmasi dengan 2–3 sinyal SELL dari Trend Scanner
-
🎯 Gunakan level Fibonacci untuk menentukan Risk:Reward
-
💡 Entry lebih akurat jika harga menyentuh area Fibo sebelum entry
💼 Cocok untuk:
-
Trader pemula yang butuh panduan visual
-
Trader profesional yang ingin efisiensi analisa
-
Pengguna strategi breakout, trend-following, dan smart entry
🎁 Bonus: Dapat digunakan di berbagai pair dan timeframe.