Abiroid MA Stack Scanner
- インディケータ
- バージョン: 1.8
- アップデート済み: 29 12月 2024
- アクティベーション: 20

Moving Average Stack:
MA Stack single timeframe, multi-timeframe and multi-currency versions for MT4 (Metatrader 4)
Very useful for finding current and higher timeframe trends. Best suited for long term trend based trading.
For quick scalping use fewer moving averages. And not suitable during low volatility. Only use during high volatility and steady trending markets.
Use this to enhance your existing Trend based strategies to find best trends. Instead of using as a standalone indicator.
You can get any of these variations depending on your needs:
- MA Stack for Individual Charts
- MA Stack Multimeter
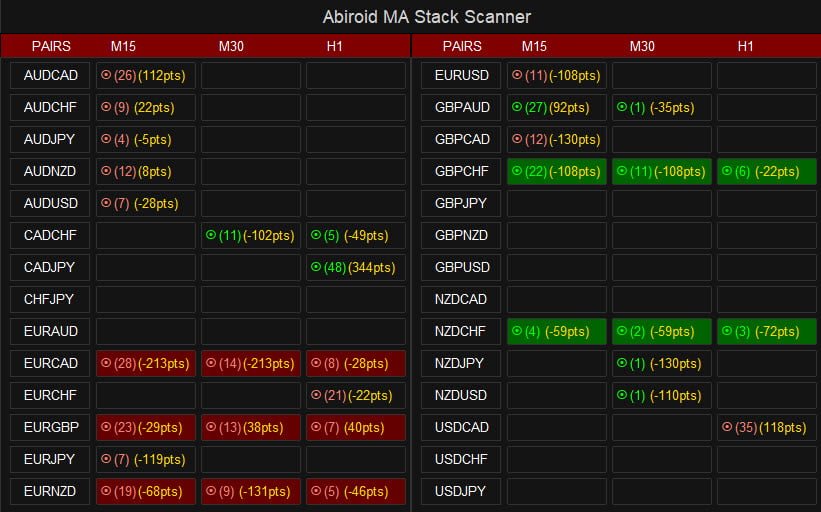
- MA Stack Scanner
Detailed blogpost explaining all 3 variations:
https://www.mql5.com/en/blogs/post/760429
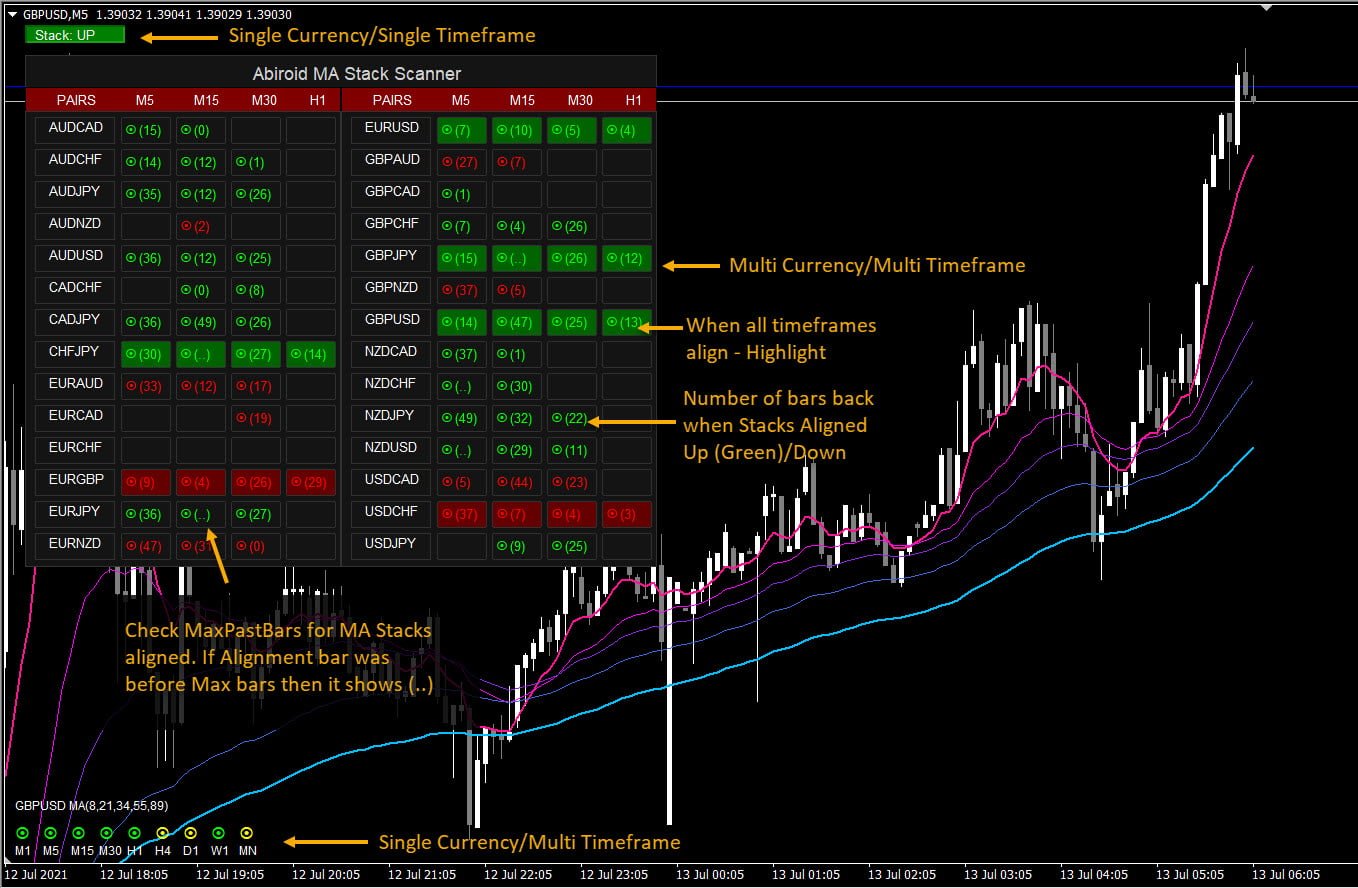
Basic MA Stack Indicator:
This is a single timeframe & single currency indicator. It looks at MAs and show 3 possible states on chart:
- When all MA Align Upwards: Stack Up
- When all MA Align Downwards: Stack Down
- If MAs not aligned: Stack None
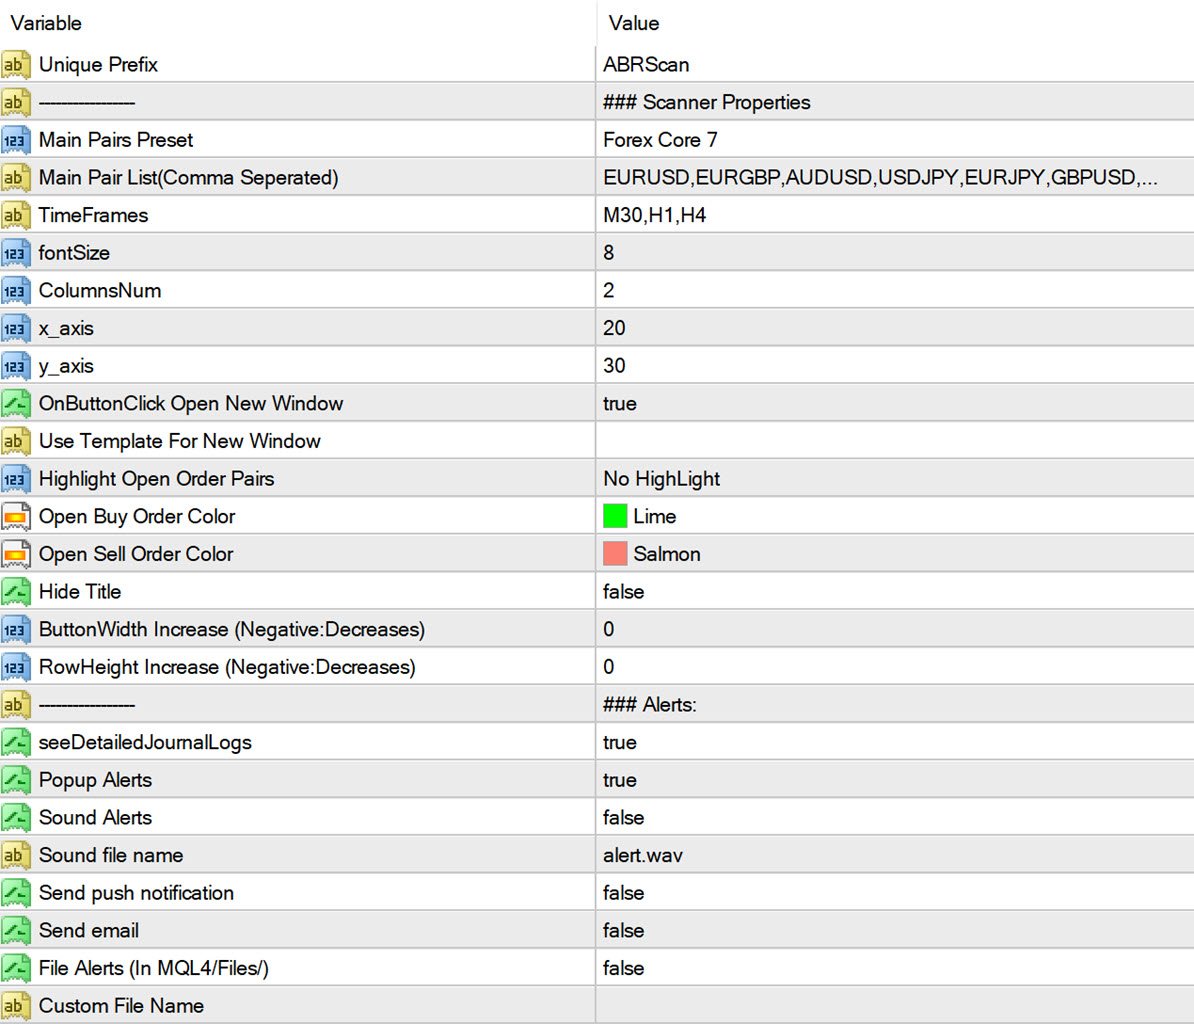
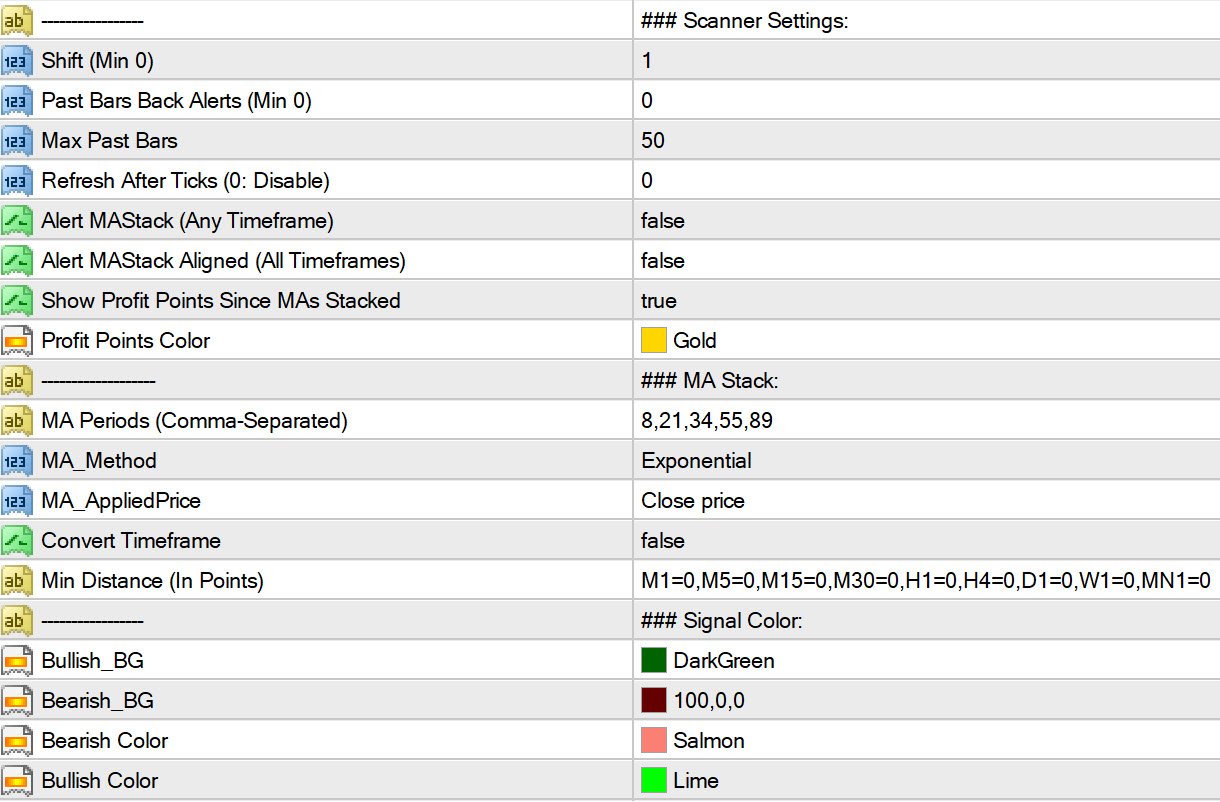
Use this guide to see Common Scanner Settings: