History Data Export Recorder

5
リアルタイムティック&1分データエクスポートレコーダー

残念ながら、ブローカーからの過去の価格データは正確ではありません。つまり、欠落データ (ギャップ) があり、価格が正しくなく、これが不正確なバックテスト結果につながります。

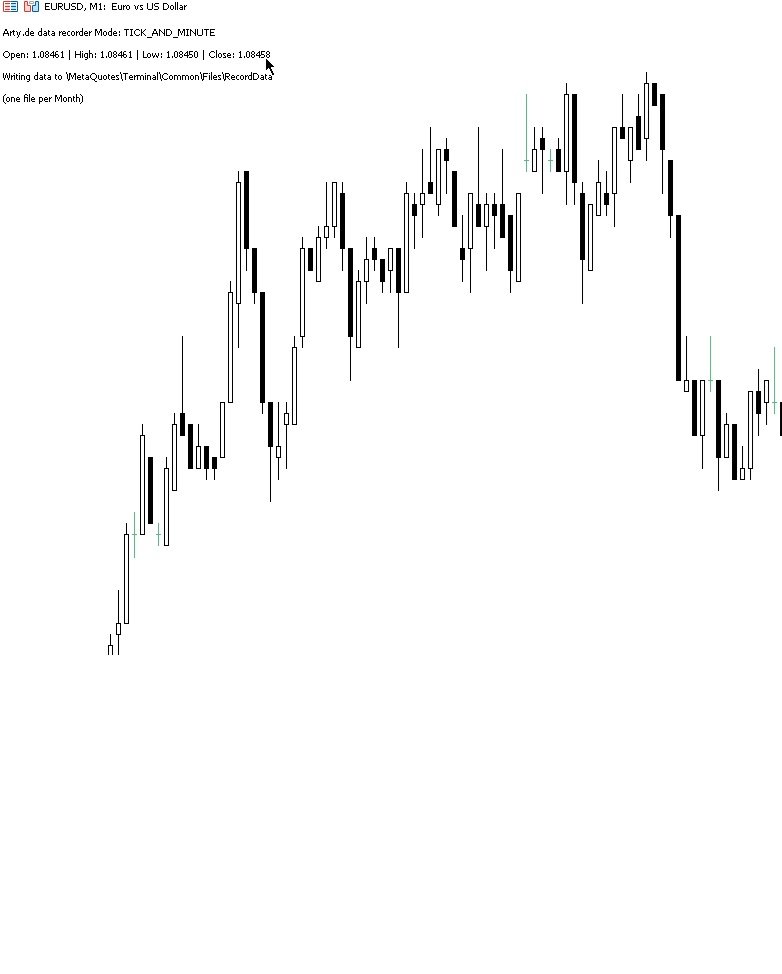
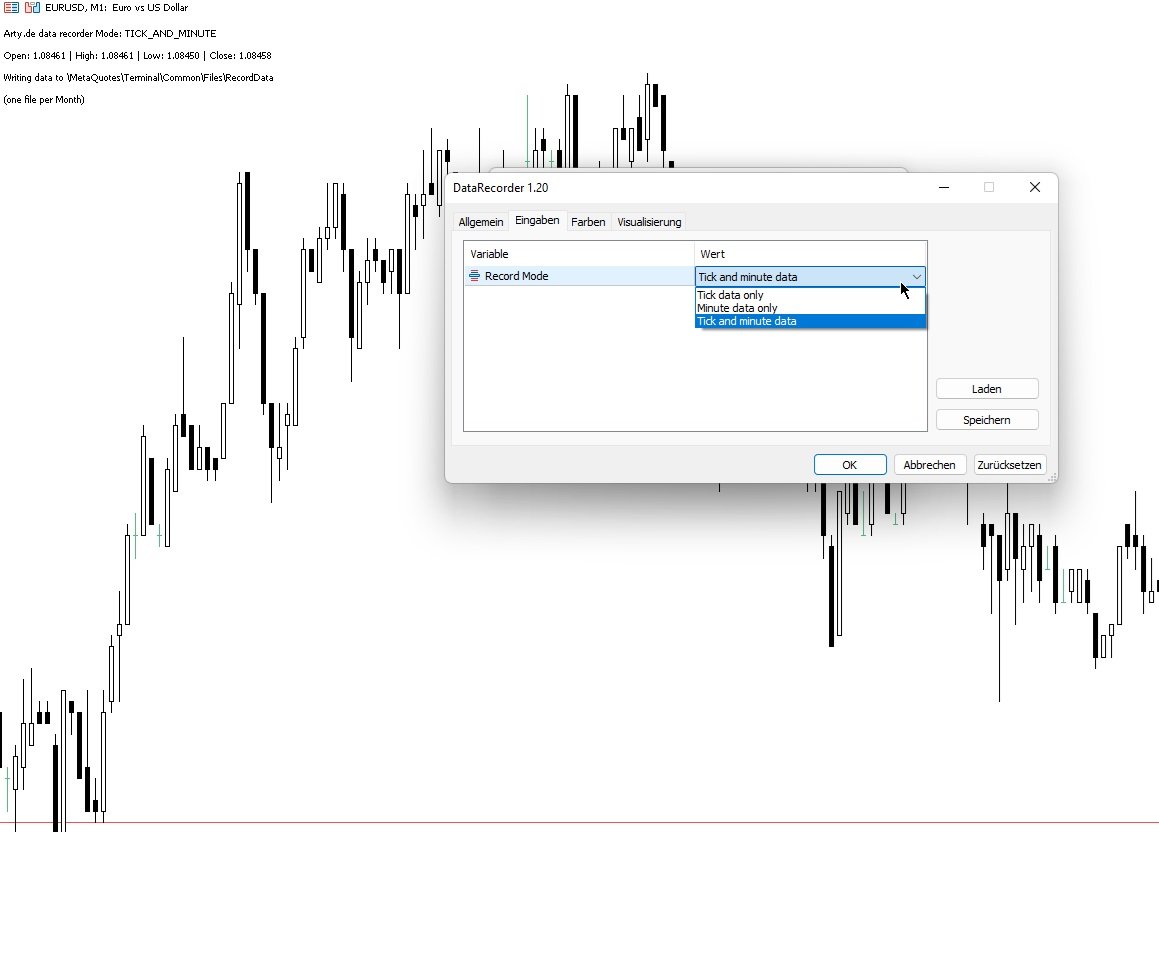
データレコーダーは、オプションのティック/1 分データ、またはその両方をリアルタイムで個別に CSV ファイルに保存します。毎月 1 ファイル。

すべて MT5 形式なので、このデータを簡単にインポートして、バックテスティング用にブローカーから正確なデータと実際のスプレッドを含むカスタムシンボルを作成できます。

記録したい1分チャートにインジケーターを追加し、記録モードを選択するだけで記録が開始されます。

他にご質問やご要望がございましたら、いつでも喜んでお手伝いさせていただきます。
レビュー 1
illeo
150
illeo 2024.05.27 10:53 
 

Ein Top-Produkt für alle, die selbst Daten für den Strategietester aufzeichnen möchten. Der Support ist sehr gut und es wurde sogar ein Verbesserungsvorschlag umgesetzt. Vielen Dank dafür. Klare Kaufempfehlung :) A top product for anyone who wants to record data for the strategy tester themselves. The support is very good and a suggestion for improvement was even implemented. Thank you for that. Clear purchase recommendation :)

おすすめのプロダクト
Volume Weighted Average Price or VWAP is an indicator wich shows different average prices on chart. This is very useful to find strong negotiation price areas and as trend following. Configurations: Day, Week and Month - Show different VWAPs according to the period. You can change each line style on "colors" tab. Any doubt or suggestion please contact us. Enjoy! This is a free indicator, but it took hours to develop. If you want to pay me a coffee, I appreciate a lot   <3 PayPal, Skrill, Nete
FREE
Swiss VWAPsimple
Terence Gronowski
4.8 (5)
Swiss VWAPsimple Motivation Did not find free VWAP that works, the one that I found craseh. So I created a VWAP which calculates values only for the actual day. So computer resouces are not over stressed. What is VWAP, how is it used?  VWAP stands for Volume Weighed Average Price, it calculates the running sum of tick volume and the runnung sum of price times tickvolume. The division of these sums result in a weighed price (Sum P*V/Sum V). The calculation starts normally at midnight. The values
FREE
White Weis Volume This indicator shows the sum of the volume in each wave, bulish or bearish, as idealized by David Weis , but it brings an important addition , which is the marking of the bar with the highest volume of the wave (White Bar)! In coding the indicator, it was sought to optimize the code to require minimal processing during use and not to overload mt5. The indicator can be used for pre-trading analysis and study, where the trader analyzes possible points of support and resistance
VWAP Indicator
LUC JACOBUS A VERHEECKE
4.2 (25)
Volume Weighted Average Price (VWAP) The volume weighted average price (VWAP) is a  trading   benchmark  used by traders that gives the average price a security has traded at throughout the day, based on both volume and price. It is important because it provides traders with insight into both the trend and value of a security. This indicator VWAP V2 is free and is the manual version of the extended Easy VWAP indicator (30 Euro), where the date and time properties are automatically entered. With
FREE
VWAP and MVWAP
Flavio Javier Jarabeck
4.29 (7)
Volume Weighted Average Price (VWAP) is a trading benchmark commonly used by Big Players that gives the average price a Symbol has traded throughout the day. It is based on both Volume and price. Additionally we put in this indicator the MVWAP (Moving Volume Weighted Average Price). For those who do not know the usage and the importance od this indicator I recommend a great article about this subject at Investopedia ( https://www.investopedia.com/articles/trading/11/trading-with-vwap-mvwap.asp )
FREE
Time and Sales Tick
Pablo Filipe Soares De Almeida
Time & Sales Tick Indicator は、MetaTrader 5チャート上でリアルタイムのティック情報を表示するインジケーターです。 価格、ティック出来高、時刻を視覚的に確認でき、市場の動きを細かく分析することが可能です。 機能 価格、出来高、時間を含むティックデータをチャート上の専用パネルにリアルタイム表示します。 ティックをユーザーが設定した間隔でグループ化し、上昇ティックは緑色、下降ティックは赤色で色分け表示します。 パネルはチャートの4隅の任意の位置に配置でき、サイズや透明度の調整も可能です。 MetaTrader 5のすべてのシンボルおよびタイムフレームで使用可能で、軽量かつ安定した動作を実現しています。 このインジケーターは、スキャルピングや短期分析に特に適しています。
Tick Database — export of tick database from MT5 terminal to MT4. The utility provides access to the tick database in real time. This is necessary to generate synthetic charts in the MT4 terminal, which initially does not provide for loading a tick database. For example, you can organize permanent access to the tick database for the Seconds Chart utility. If the opening time of the last candle in the terminals is different, then you need to specify the time offset in hours. Example We open M1 ch
FREE
Simple Vwap with the daily, weekly and monthly VWAP is the abbreviation for   volume-weighted average price , which is a technical analysis tool that shows the ratio of an asset's price to its total trade volume. It provides traders and investors with a measure of the average price at which a stock is traded over a given period of time. How it's used Identify entry and exit points:   Traders can use VWAP to determine when to buy or sell an asset.   Understand price trends :  Traders can use V
FREE
Weis Wave Double Side
Eduardo Da Costa Custodio Santos
The Weis Wave Bouble Side Indicator for MT5 is part of the toolkit (Wyckoff Academy Wave Market) The Weis Wave Bouble side Indicator for MT5 was created based on the already established Weis Wave created by David Weis. The Weis Wave Double Side indicator reads the market in waves as it was done by R. Wyckoff in 1900. It helps in the identification of effort x result, cause and effect, and Supply and demand Its differential is that it can be used below the zero axis, further improving plus operat
MIDAS Super VWAP
Flavio Javier Jarabeck
4.4 (10)
Imagine VWAP, MVWAP and MIDAS in one place... Well, you found it! Now you can track the movement of Big Players in various ways, as they in general pursue the benchmarks related to this measuring, gauging if they had good execution or poor execution on their orders. Traders and analysts use the VWAP to eliminate the noise that occurs throughout the day, so they can measure what prices buyers and sellers are really trading. VWAP gives traders insight into how a stock trades for that day and deter
FREE
概要 このインジケーターは、クラシックな ドンチャンチャネル を強化したバージョンで、実践的なトレード機能を追加しています。 標準の3本線(上限、下限、中央線)に加え、 ブレイクアウト を検出し、チャート上に矢印で視覚的に表示します。また、チャートを見やすくするために、 現在のトレンド方向と逆側のラインのみを表示 します。 インジケーターの機能: 視覚的シグナル :ブレイクアウト時にカラフルな矢印を表示 自動通知 :ポップアップ、プッシュ通知、Eメール RSIフィルター :市場の相対的な強弱に基づいてシグナルを検証 カスタマイズ可能 :色、ラインの太さ、矢印コード、RSI閾値など 動作原理 ドンチャンチャネルは次のように計算します: 上限線 :直近N本のクローズ済みローソク足の最高値 下限線 :直近N本のクローズ済みローソク足の最安値 中央線 :最高値と最安値の平均値 上方ブレイクアウト は終値が上限線を超えたときに発生し、 下方ブレイクアウト は終値が下限線を下回ったときに発生します。 インジケーターは以下を行います: 3本のドンチャンラインを描画 方向転換後の最初のブレイクアウト
FREE
Midas is the acronym for Market Interpretation / Data Analysis System is a trade approach started in 1995 by technical analyst Paul Levine and later developed by Andrew Coles, PhD and David Hawkins. Learn more in the book MIDAS Technical Analysis: A VWAP Approach to Trading and Investing in Today's Markets , (I saw that it is possible buy via Amazon). The positive points in relation to the Midas-based indicators are the prediction of movement reversal points, the negative point is the subjectivi
Waves Sizer
Flavio Javier Jarabeck
3.86 (7)
Wyckoff fans, enjoy! Ideally to be used with the Weis Waves indicator, but it can be easily used alone, the Waves Sizer puts the range (in resulting Price movement) done by the Price on its market swings. You can control how accurate or loose will be the swings. This tool is very helpful for visually know how much the Price has traveled in your Timeframe. This way you can confront this level of effort with the resulting Volume, etc... Weis Waves indicator: https://www.mql5.com/en/market/produc
FREE
Crystal Profit Dashboard – Real-Time MT5 Account Performance Utility Overview Crystal Profit Dashboard is a lightweight MetaTrader 5 utility that provides real-time profit and loss monitoring directly on the chart. It offers a clean, modern dashboard interface that updates account performance without clutter, allowing traders to focus on execution while keeping essential metrics visible. Designed for scalpers, intraday traders, and swing traders, this tool provides accurate floating profit/los
FREE
Pairs Navigator   is a simple and easy-to-use tool that allows you to view all of your charts in a single window. This eliminates the need to open multiple charts from the Market Watch window, saving you time and effort. Pairs Navigator is also very lightweight, so it will not put a strain on your RAM or cause your MT4/5 platform to hang. To use Pairs Navigator, simply drag and drop the currency pairs you want to view into the Pairs Navigator window. You can then easily switch between charts by
FREE
Wave Box Market Frenquency
Jean Jacques Huve Ribeiro
4.75 (4)
Totally linked to the result of a movement and the duration he had. Its height records how many ticks the asset walked during a given movement, its width shows us the duration that movement had. Its configuration must be in line with the Weis Wave Indicator configuration to observe the movement force and can indicate a possible accumulation or distribution of the movement;
FREE
Stackable VWAP
Flavio Javier Jarabeck
3.5 (4)
Volume Weighted Average Price (VWAP) is a trading benchmark commonly used by Big Players that gives the average price a Symbol has traded throughout the day. It is based on both Volume and price. Additionally we put in this indicator the MVWAP (Moving Volume Weighted Average Price). For those who do not know the usage and the importance od this indicator I recommend a great article about this subject at Investopedia ( https://www.investopedia.com/articles/trading/11/trading-with-vwap-mvwap.asp
FREE
WAPV Box Effort x Result
Eduardo Da Costa Custodio Santos
MT5のWA_PV_BOX_EFFORTXRESULT WAPV Box Effort x Result Indicatorは、Package Indicatorsグループ(Wyckoff Academy Wave Market)の一部です。 MT5のWAPVボックスエフォートx結果インジケーターは、価格とボリュームを読み取るのに役立ちます。その読みは、努力×結果の特定を支援することで構成されています グラフによって作成された波で。 ボックスが緑色の場合のMT5のWAPVボックスの労力x結果インジケーターは、ボリュームが需要に有利であり、ボックスが赤色の場合を意味します ボリュームは供給に有利です。 ボックスが大きいほど、価格に対するボリュームの変位が大きくなります。価格の上昇波がボックスのサイズに比例しない場合、 努力×結果。 非常に視覚的な方法で、ボリュームと価格の間のこの相違を識別できます。 MT5のWAPVBoxEffort x Result Indicatorを使用すると、インジケーターをゼロ軸の下に配置することで、視覚化を向上させることもできます。 ティックボリュームとリア
Indicador Regressão Linear – Par de Ativos - INTRADAY Indicador é um oscilador que faz o plot do Resíduo resultado da regressão linear entre os dois ativos inseridos como input do indicador, representado pela fórmula: Y = aX + b + R Onde Y é o valor do ativo dependente, X é o valor do ativo independente, a é a inclinação da reta entre os dois ativos, b é a intersecção da reta e R é o resíduo. O resíduo representa a quantidade da variabilidade que Y que o modelo ajustado não consegue explicar. E
FREE
Value Chart Candlesticks
Flavio Javier Jarabeck
4.69 (13)
The idea of a Value Chart indicator was presented in the very good book I read back in 2020 , " Dynamic Trading Indicators: Winning with Value Charts and Price Action Profile ", from the authors Mark Helweg and David Stendahl. The idea is simple and the result is pure genius: Present candlestick Price analysis in a detrended way! HOW TO READ THIS INDICATOR Look for Overbought and Oversold levels. Of course, you will need to test the settings a lot to find the "correct" one for your approach. It
FREE
This is a FREE Trend Direction Indicator for MetaTrader 5. Features: Identifies market trend direction Uses EMA 50 and EMA 200 Non-repainting logic Clear visual display Suitable for manual trading Free version includes: - Single timeframe - Trend direction only - No alerts If you need: Alerts Multi-timeframe version EA automation Custom modifications My Name is Khalaf Hamza , You can contact me for freelance work --> khalaf.hamza.hi@gmail.com
FREE
Donchian Channel is an indicator created by Richard Donchian. It is formed by taking the highest high and the lowest low of the last specified period in candles. The area between high and low is the channel for the chosen period. Its configuration is simple. It is possible to have the average between the upper and lower lines, plus you have alerts when price hits one side. If you have any questions or find any bugs, please contact me. Enjoy!
FREE
This robot sends Telegram notifications based on the coloring rules of PLATINUM Candle indicator. Example message for selling assets: [SPX][M15] PLATINUM TO SELL 11:45. Example message for buying assets : [EURUSD][M15] PLATINUM TO BUY 11:45 AM. Before enable Telegram notifications  you need to create a Telegram bot, get the bot API Key and also get your personal Telegram chatId. It's not possible to send messages to groups or channels. You can only send messages to your user chatId. You should
FREE
## HiddenGapVolume Indicator Overview **HiddenGapVolume** is a sophisticated MetaTrader 5 technical indicator designed to detect hidden market gaps and volume anomalies through statistical analysis. It combines rolling volume averages with dynamic color-coded visualization to identify potential trading opportunities. ### Core Features - **Statistical Volume Analysis**: Calculates moving average and standard deviation bands around volume - **Dynamic Color Coding**: 6-color histogram signaling
FREE
Note from Developer: This is the lite version of the Double TMA with Bands Indicator. You can find the paid version that comes with alerts and on screen signal arrows built in here . I will also be selling an EA based on this trading system soon once all backtesting and optimization have been completed. Unlock your trading potential with the Double TMA Indicator with Reversal Detection! Designed for swing and reversal trading, this versatile tool integrates two Triangular Moving Averages (
FREE
Weis Waves
Flavio Javier Jarabeck
2.83 (18)
The original author is David Weis, an expert in the Wyckoff Method. The Weis Wave is a modern adaptation of the 1930's Wyckoff Method, another expert in Tape Reading techniques and Chart Analysis. Weis Waves takes market volume and stacks it into waves according to price conditions giving the trader valuable insights about the market conditions. If you want to learn more about this subject you can find tons of videos in YouTube. Just look for "The Wickoff Method", "Weis Wave" and "Volume Spread
FREE
The utility draws reversal levels using the formulas for each of the selected number of candles: Pivot = (high + close + low) / 3 R1 = ( 2 * Pivot) - low S1 = ( 2 * Pivot) - high R2 = Pivot + (R1 -S1) R3 = high + ( 2 * (Pivot - low)) S2 = Pivot - (R1 - S1) S3 = low - ( 2 * (high - Pivot)) H = high L = low U = if the candle is bullish, then close. Otherwise - open D = if the candle is bullish, then open. Otherwise - close On any timeframe. After a new candle closes on the calculated timeframe
FREE
Indicator Description 4 Hull MA Color + Envelopes is a powerful trend-following indicator for MetaTrader 5 that combines four Hull Moving Averages (HMA) with Moving Average Envelopes to clearly identify market direction, trend strength, and potential reversal or pullback zones. This indicator is designed to reduce noise, react quickly to price movement, and provide a clean visual structure for professional trading.   Key Features   4 Hull Moving Averages (20, 50, 100, 200) Automatic color change
FREE
Breakout Boxes with Volume Pressure This indicator automates the identification of key consolidation zones (Supply and Demand) based on Market Pivots and Volatility (ATR). Unlike standard support/resistance tools, this indicator provides a unique   Volume Pressure Analysis   inside every box, giving you insight into the battle between Buyers and Sellers before a breakout occurs. Key Features Automated Supply & Demand Zones:   Automatically detects significant Pivot Highs and Lows to draw dyna
Volume Waves
Paulo Henrique Faquineli Garcia
One of the best tools for analyzing volume, Weis Wave was devised by David Weis to facilitate reading the directional flow. For the disciples of the Wyckoff method, this means an evolution, facilitating a predictive reading of the market, always looking for Accumulation and Distribution zones for traded assets. For better understanding, in this indicator we try to cover every reading of EFFORT (traded volume) versus RESULT (price change). Thus, you can apply the indicator on the chart twice to
このプロダクトを購入した人は以下も購入しています
Trade Assistant MT5
Evgeniy Kravchenko
4.42 (207)
取引 ごとのリスクの 計算、新規注文 の 簡単 な 設置、部分的 な 決済機能 を 持 つ 注文管理、 7 種類 のトレーリングストップなど 、便利 な 機能 を 備 えています 。 追加の資料と説明書 インストール手順   -   アプリケーションの手順   -   デモアカウント用アプリケーションの試用版 ライン機能 チャート上にオープニングライン、ストップロス、テイクプロフィットを表示します。この機能により、新規注文を簡単に設定することができ、注文を出す前にその特徴を確認することができます。   リスク計算 リスク計算機能は、設定されたリスクとストップロス注文のサイズを考慮して、新規注文のボリュームを計算します。ストップロスの大きさを自由に設定できると同時に、設定したリスクを守ることができます。 Lot calc ボタン - リスク 計算 を 有効 / 無効 にします 。 Risk フィールドでは 、必要 なリスクの 値 を 0 から 100 までのパーセンテージまたは 預金通貨 で 設定 します 。 設定」 タブで 、 リスク 計算 の 種類 を 選択 します :「 $ 通
Trade Manager EAへようこそ。これは、取引をより直感的、正確、そして効率的にするために設計された究極の リスク管理ツール です。これは単なるオーダー実行ツールではなく、包括的な取引計画、ポジション管理、リスク管理のためのソリューションです。初心者から上級者、迅速な実行を必要とするスキャルパーまで、Trade Manager EAはあらゆるニーズに対応し、為替、指数、商品、暗号通貨などさまざまな市場で柔軟に対応します。 Trade Manager EAを使用すると、複雑な計算が過去のものになります。市場を分析し、エントリーポイント、ストップロス、テイクプロフィットのレベルをチャート上のラインでマークし、リスクを設定するだけで、Trade Managerが最適なポジションサイズを即座に計算し、SLとTPをピップ、ポイント、口座通貨でリアルタイムに表示します。すべての取引が簡単かつ効果的に管理されます。 主な機能: ポジションサイズ計算機 :定義されたリスクに基づいて取引サイズを瞬時に決定します。 簡単な取引計画 :エントリー、ストップロス、テイクプロフィットを設定するためのド
Local Trade Copier EA MT5
Juvenille Emperor Limited
4.96 (124)
Local Trade Copier EA MT5 による、驚くほど高速な取引コピーを体験してください。1分で簡単にセットアップできるこの取引コピー機は、同じWindowsコンピュータまたはWindows VPS上の複数のMetaTrader端末間で取引をコピーすることができ、0.5秒未満の高速コピースピードを実現します。 初心者であろうとプロのトレーダーであろうと、 Local Trade Copier EA MT5 には、あなたの特定のニーズに合わせてカスタマイズするための幅広いオプションが用意されています。これは、利益の可能性を高めたい人にとって究極のソリューションです。 今すぐ試してみて、これが市場で最も速くて簡単なトレードコピー機である理由を理解してください。 ヒント: デモアカウントで Local Trade Copier EA MT5 デモバージョンをダウンロードして試すことができます: ここ ダウンロードした無料のデモ ファイルを MT5 >> ファイル >> データ フォルダを開く >> MQL5 >> Experts フォルダに貼り付けて、ターミナルを再起動しま
TradePanel MT5
Alfiya Fazylova
4.86 (148)
Trade Panel は、多機能の取引アシスタントです。このアプリケーションには手動取引用の 50 を超える取引機能が含まれており、ほとんどの取引操作を自動化できます。 注意、アプリケーションはストラテジー テスターでは動作しません。購入する前に、デモアカウントでデモ版をテストできます。デモ版 ここ 。 完全な手順 こちら 。 取引。 ワンクリックで取引操作を実行できます: 自動リスク計算を使用して未決の注文とポジションをオープンします。 ワンクリックで複数の注文とポジションをオープンします。 注文グリッドを開きます。 未決の注文とポジションをグループごとにクローズします。 ポジション反転 (買いを閉じて売りを開く、または売りを閉じて買いを開く)。 ポジションをロックします(買いポジションと売りポジションの量を均等にする追加のポジションをオープンします)。 ワンクリックですべてのポジションを部分的にクローズします。 すべてのポジションのテイクプロフィットとストップロスを同じ価格レベルに設定します。 すべてのポジションのストップロスをポジションの損益分岐点レベルに設定します。 注文とポ
Tired of complex order placement and manual calculations? Trade Dashboard is your solution. With its user-friendly interface, placing orders becomes effortless, by a single click, you can open trades, set stop loss and take profit levels, manage trade lot size, and calculate risk to reward ratios, allowing you to only focus on your strategy. Say goodbye to manual calculations and streamline your trading experience with Trade Dashboard. Download  Demo Version  right now. You can find  Details of
ベータリリース Telegram to MT5 Signal Trader はまもなく正式なアルファ版をリリースします。いくつかの機能はまだ開発中で、小さな不具合に遭遇する可能性があります。問題が発生した場合はぜひご報告ください。皆さまのフィードバックがソフトウェア改善に役立ちます。 価格は20件の販売後に上がります。残り $90 のコピー: 2/20 。 Telegram to MT5 Signal Trader は、 Telegram のチャンネルやグループからの取引シグナルを自動的に MetaTrader 5 にコピーする強力なツールです。 パブリックおよびプライベートの両方のチャネルに対応し、複数のシグナル提供元を複数のMT5口座に接続可能です。ソフトウェアは高速で安定し、すべての取引を細かく制御できます。 インターフェースは直感的で、ダッシュボードとチャートは見やすく設計されており、リアルタイムで動作状況をモニターできます。 必要環境 MQL の制限により、EA は Telegram と通信するためのデスクトップアプリが必要です。 インストーラーは公式の インストールガイ
Trade copier MT5
Alfiya Fazylova
4.61 (36)
Trade Copierは、取引口座間の取引をコピーして同期するように設計された専門的なユーティリティです。 コピーは、同じコンピューターまたはvps にインストールされている、サプライヤーのアカウント/端末から受信者のアカウント/端末に行われます。 購入する前に、デモ アカウントでデモ バージョンをテストできます。 デモ版 こちら 。 詳細な説明は こちら 。 主な機能と利点: MT5ネッティングアカウントを含む、MT5> MT5、MT4> MT5、MT5> MT4のコピーをサポートします。 高いコピー速度(0.5秒未満)。 ベンダーモードと受信者モードは同じ製品内に実装されています。 チャートから直接リアルタイムでコピーを制御できる、簡単で直感的なインターフェイス。 接続が切断されたり、端末が再起動されたりしても、設定と位置が失われることはありません。 コピーするシンボルを選択できます。また、受信者のシンボルを置き換えることもできます(例:EURUSD> USDJPY)。 バックコピーをサポートします。 特定の注文のみのコピーを有効にする機能。 取引開始価格の最大差と最大遅延時間を
Copy Cat More Trade Copier MT5 (コピーキャット MT5) は、今日の取引課題に対応して設計されたローカルトレードコピーシステムと完全なリスク管理・実行フレームワークです。プロップファームのチャレンジから個人ポートフォリオ管理まで、堅牢な実行、資本保護、柔軟な設定、高度な取引処理の組み合わせで、あらゆる状況に適応します。 コピーシステムはマスター(送信側)とスレーブ(受信側)の両方のモードで動作し、成行注文と指値注文、取引修正、部分決済、両建て決済操作のリアルタイム同期を行います。デモ口座とライブ口座、取引ログインまたは投資家ログインの両方に対応し、EA、ターミナル、またはVPSが再起動してもパーシスタント取引メモリシステムを通じて復旧を保証します。複数のマスターとスレーブをユニークIDで同時に管理でき、ブローカー間の違いはプレフィックス/サフィックス調整またはカスタムシンボルマッピングを通じて自動的に処理されます。 マニュアル/設定  | Copy Cat More MT4 | チャンネル  特別機能: 設定が簡単 — わずか30秒で完了(ビデオをご覧
Exp COPYLOT CLIENT for MT5
Vladislav Andruschenko
3.82 (34)
MT5のトレードコピー機は、МetaТrader5プラットフォームのトレードコピー機です 。 それは間の 外国為替取引をコピーします   任意のは 、MT5 - MT5、MT4 - MT5   COPYLOT MT5版の アカウント (またはを MT4 - MT4   MT5 - MT4   COPYLOT MT4版用) 信頼できるコピー機! MT4のバージョン 完全な説明   +DEMO +PDF 購入する方法 インストールする方法     ログファイルの取得方法     テストと最適化の方法     Expforex のすべての製品 МТ4ターミナルでトレードをコピーすることもできます(   МТ4   -   МТ4、МТ5   -   МТ4   ):   MT4のCOPYLOT CLIENT このバージョンには、端末間 МТ5   -   МТ5、МТ4   -   МТ5が含まれ ます。 ディールコピー機は、2/3/10端末間でディール/ポジションをコピーするために作成されます。 デモ口座と投資口座からのコピーがサポートされています。 プログラムは、複数の端末バインデ
The product will copy all telegram signal to MT5 ( which you are member) , also it can work as remote copier.  Easy to set up, copy order instant, can work with almost signal formats, image signal,  s upport to translate other language to English Work with all type of channel or group, even channel have "Restrict Saving Content", work with  multi channel, multi MT5 Work as remote copier: with signal have ticket number, it will copy exactly via ticket number. Support to backtest signal. How to s
Trade Manager は、リスクを自動的に計算しながら、取引を迅速に開始および終了するのに役立ちます。 過剰取引、復讐取引、感情的な取引を防止する機能が含まれています。 取引は自動的に管理され、アカウントのパフォーマンス指標はグラフで視覚化できます。 これらの機能により、このパネルはすべてのマニュアル トレーダーにとって理想的なものとなり、MetaTrader 5 プラットフォームの強化に役立ちます。多言語サポート。 MT4バージョン  |  ユーザーガイド + デモ Trade Manager はストラテジー テスターでは機能しません。 デモについてはユーザーガイドをご覧ください。 危機管理 % または $ に基づくリスクの自動調整 固定ロットサイズを使用するか、ボリュームとピップに基づいた自動ロットサイズ計算を使用するオプション RR、Pips、または価格を使用した損益分岐点ストップロス設定トレーリングストップロス設定 目標に達したときにすべての取引を自動的に終了するための 1 日あたりの最大損失 (%)。 過度のドローダウンからアカウントを保護し、オーバートレードを防ぎます
Ultimate Extractor - Professional Trading Analytics for MT5 *****this is the local HTML version of Ultimate Extractor. Check out Ultimate Extractor Cloud on mql5 for the Cloud version****** Ultimate Extractor transforms your MetaTrader 5 trading history into actionable insights with comprehensive analytics, interactive charts, and real-time performance tracking. What It Does Automatically analyzes your MT5 trading history across all Expert Advisors and generates detailed HTML reports with inte
Farmed Hedge Yield Farming - Professional Pair Trading Dashboard (Manual - Hybrid - Semi/Automated EA) Launch Price xxx $ | Regular Price 899$ VERSION 3 - WILD HARVEST UPDATE Trading Approach: - Manual Trading: Primary focus - Auto Pilot: Optional supplementary feature - Full Automation: Not the main purpose Recommended Timeframe: H1-H4 DEMO VERSION Download the free demo to test functionality. Use Strategy Tester with Visual Mode to see how it works. VERIFIED TRADING RESULTS - Farmed Hedge Y
HINN MAGIC ENTRY – the ultimate tool for entry and position management! Place orders by selecting a level directly on the chart! full description   ::  demo-version Key features: - Market, limit, and pending orders - Automatic lot size calculation - Automatic spread and commission accounting - Unlimited partitial take-profits  - Breakeven and trailing stop-loss and take-profit  functions - Invalidation leves - Intuitive, adaptive, and customizable interface - Works with any assets and account t
MT5 to Telegram Signal Provider は、Telegramのチャット、チャンネル、またはグループに 指定された シグナルを送信することができる、完全にカスタマイズ可能な簡単なユーティリティです。これにより、あなたのアカウントは シグナルプロバイダー になります。 競合する製品とは異なり、DLLのインポートは使用していません。 [ デモ ] [ マニュアル ] [ MT4版 ] [ Discord版 ] [ Telegramチャンネル ]  New: [ Telegram To MT5 ] セットアップ ステップバイステップの ユーザーガイド が利用可能です。 Telegram APIの知識は必要ありません。必要な全ては開発者から提供されます。 主な特長 購読者に送信する注文の詳細をカスタマイズする機能 例えば、Bronze、Silver、Goldといった階層型のサブスクリプションモデルを作成できます。Goldサブスクリプションでは、すべてのシグナルが提供されます。 id、シンボル、またはコメントによって注文をフィルターできます 注文が実行されたチャート
Seconds Chart — MetaTrader 5で秒足チャートを作成するユニークなツールです。 Seconds Chart を使用すると、秒単位のタイムフレームでチャートを構築でき、標準的な分足や時間足チャートでは得られない柔軟性と分析精度を実現します。例えば、 S15 は15秒足を表します。カスタムシンボルをサポートしているインジケーターやEAをすべて使用できます。標準的なチャートと同様に便利に操作できます。 標準的なツールとは異なり、 Seconds Chart は超短期のタイムフレームでも高い精度と遅延なく作業できるように設計されています。 Seconds Chartの利点 1秒から900秒 までのタイムフレームをサポート。 組み込みのティックデータベースにより、ヒストリカルデータを 瞬時にロード 。 リアルタイムでデータが更新され、 遅延やラグなし 。 複数の秒足チャートを同時に作成可能。 Seconds Chartが最適な用途 スキャルピング や高頻度取引。 正確なエントリーとエグジット。 短期タイムフレームでの取引戦略のテスト。 タイムフレームの設定 デフォルトの設
Smart Stop Manager – プロレベルの精度でストップロスを自動実行 概要 Smart Stop Manager は Smart Stop ラインナップの「実行レイヤー」であり、複数ポジションを持つトレーダーのために構築された、構造化された信頼性の高い完全自動ストップロス管理システムです。すべての保有中ポジションを継続的に監視し、Smart Stop のマーケットストラクチャー・ロジックを用いて最適なストップレベルを計算し、明確で透明性のあるルールに従ってストップを自動更新します。 単一の銘柄から複数銘柄のポートフォリオ全体まで、Smart Stop Manager は各トレードに規律、安定性、そして完全なリスク可視化をもたらします。感情的判断を排除し、手作業を大幅に削減し、すべてのストップが常に市場構造に基づいた論理的なプロセスに従うことを保証します。 ハイライト マーケットストラクチャーに基づく自動ストップ配置 • Smart Stop ロジックに基づき、各オープンポジションへ最適なストップロスを自動適用します。 ポートフォリオ全体を一目で把握 • 銘柄、方向
あなたがメンバーである任意のチャネルから(プライベートおよび制限されたものを含む)シグナルを直接あなたのMT5にコピーします。  このツールは、トレードを管理し監視するために必要な多くの機能を提供しながら、ユーザーを考慮して設計されています。 この製品は使いやすく、視覚的に魅力的なグラフィカルインターフェースで提供されています。設定をカスタマイズして、数分で製品を使用を開始できます! ユーザーガイド + デモ  | MT4版 | Discord版 デモを試してみたい場合は、ユーザーガイドにアクセスしてください。 Telegram To MT5 受信機は、ストラテジーテスターで動作しません! Telegram To MT5の特徴 複数のチャネルから一度にシグナルをコピー プライベートおよび制限されたチャネルからシグナルをコピー BotトークンまたはChat IDは必要ありません   (必要に応じて使用することができます) リスク%または固定ロットを使用して取引 特定のシンボルを除外 すべてのシグナルをコピーするか、コピーするシグナルをカスタマイズするかを選択 すべてのシグナルを認
Trade on crypto exchanges in MT5! GRat_Crypto is a tool for manual and automated trading , including ANY available EA, ANY  cryptocurrency  on most popular crypto exchanges in the familiar MT5 environment 24/7. Features 1. ALL instruments of the 9 most popular crypto exchanges are available: Binance, BingX, Bybit, Coinbase, CoinEx, Kraken,   KuCoin, MEXC and OKX . 2. The ability to place ANY type of order available in MT5, both market and pending, to modify orders and positions, to delete order
TelegramからMT5へ: 究極のシグナルコピーソリューション Telegram to MT5 を使えば、取引がシンプルになります。DLL を必要とせず、Telegram のチャンネルやチャットから MetaTrader 5 プラットフォームに取引シグナルを直接コピーできる最新ツールです。この強力なソリューションは、正確なシグナル実行、豊富なカスタマイズオプション、時間の節約、そして効率性の向上を実現します。 [ Instructions and DEMO ] 主な特徴 直接的なTelegram API統合 電話番号とセキュアコードで認証します。 ユーザーフレンドリーな EXE ブリッジを通じてチャット ID を簡単に管理できます。 複数のチャネル/チャットを追加、削除、更新して、同時に信号をコピーします。 高度なフィルターによる信号解析 例外的な単語 (例: 「レポート」、「結果」) を含む不要な信号をスキップします。 柔軟な SL および TP 形式 (価格、ピップ、ポイント) をサポートします。 価格ではなくポイントを指定するシグナルのエントリ ポイントを自動的に計算します。
Smart Stop Scanner – マルチアセット対応の市場構造型ストップロス分析システム 概要 Smart Stop Scanner は、複数の市場にわたるストップロス構造をプロフェッショナル品質で監視するために設計されたツールです。 実際の市場構造、重要なブレイクアウト、価格アクションロジックに基づいて最も意味のあるストップゾーンを自動的に検出し、 高精細(DPI対応)で見やすい統一パネルに表示します。 Forex、ゴールド、インデックス、メタル、暗号資産など幅広い市場に対応しています。 ストップレベルの算出方法 従来型のインジケーターや任意の計算式は使用していません。 代わりに、 ブレイクアウト、より高い高値、より低い安値 といった実際の市場構造イベントを検出します。 ストップレベルはこれらの構造ポイントから直接生成されるため、より自然で信頼性が高く、 実際の市場動向に即したストップ設定が可能になります。 主なハイライト • 高精度のマルチアセット対応 Forex、メタル、ゴールド、インデックス、暗号資産など、幅広い銘柄をサポートし、桁数やティックサイズを自動処
Professional Footprint Chart EA - Complete Order Flow Trading Suite DEMO USERS - PLEASE SELECT EVERY TICK WHEN TESTING  See What Market Makers See! The most comprehensive order flow analysis tool for MetaTrader 5. Get institutional-grade volume analysis, real-time DOM, Time & Sales, and intelligent trade signals - all in one powerful EA. 6 Professional Panels - Complete order flow analysis suite Real-Time Tick Data - Live bid/ask volume at every price level Automatic Imbalance Detection - Spot
Grid Manual MT5
Alfiya Fazylova
4.9 (20)
「Grid Manual」は、注文のグリッドを操作するための取引パネルです。 ユーティリティはユニバーサルで、柔軟な設定と直感的なインターフェイスを備えています。 それは、損失を平均化する方向だけでなく、利益を増やす方向でも注文のグリッドで機能します。 トレーダーは注文のグリッドを作成して維持する必要はありません。 すべてが「Grid Manual」によって行われます。 注文を開くだけで十分であり、「Grid Manual」は注文のグリッドを自動的に作成し、非常に閉じるまでそれに付随します。 完全な説明とデモバージョン ここ。 ユーティリティの主な機能と機能 ユーティリティは、モバイル端末から開かれた注文を含め、あらゆる方法で開かれた注文を処理します。 「制限」と「停止」の2種類のグリッドで機能します。 グリッド間隔の計算には、固定と動的(ATRインジケーターに基づく)の2つの方法で機能します。 オープンオーダーグリッドの設定を変更できます。 チャート上の各注文グリッドの損益分岐点を表示します。 各注文グリッドの利益率を表示します。 ワンクリックでグリッドから収益性の高い注文を閉じるこ
ワンクリックで取引できるトレーディングパネル。ポジションと注文の操作!チャートまたはキーボードから取引。 当社の取引パネルを使用すると、チャートから直接シングルクリックで取引を実行でき、標準の MetaTrader コントロールよりも 30 倍高速に取引操作を実行できます。 パラメータと関数の自動計算により、トレーダーにとって取引がより速く、より便利になります。 グラフィックのヒント、情報ラベル、取引取引に関する完全な情報はチャート MetaTrader にあります。 MT4のバージョン 完全な説明   +DEMO +PDF 購入する方法 インストールする方法     ログファイルの取得方法     テストと最適化の方法     Expforex のすべての製品 手動取引用の取引パネル。チャート(チャートウィンドウ)またはキーボードから取引できます。  開閉、リバース、ロックポジションと注文を処理する МetaТrader5 のメインオーダーのトレーディングコントロールパネル:売買、売却、売却、売却、売却、閉じる、削除、修正、トレーリングストップ、ストップロス、takeproft
Trade Assistant 38 in 1
Makarii Gubaydullin
4.91 (23)
多機能ツール:ロット計算、グリッド注文、R/R比率、トレードマネージャー、サプライ&デマンドゾーン、プライスアクションなど デモ版   |   ユーザーマニュアル トレードアシスタント   はストラテジーテスターでは動作しません :   こちらからデモ版をダウンロード  して ユーティリティ をテストできます。 ご質問、改善のご提案、バグ発見の場合は ご連絡ください MT4版が必要な場合は こちら から入手できます トレード   プロセス を簡素化、高速化、自動化。   ダッシュボード で標準端末の機能を拡張。 トレードパネルは  あらゆる取引商品で動作:外国為替、株式、インデックス、暗号通貨など。 1. 新規トレードの実行 :ロット / リスク / R/R計算 :手動トレードのためのリスク管理 ロット計算機(リスクサイズに基づく取引量計算) リスク計算機(ロットサイズに基づくリスク額) リスクリワード   比率 グリッド注文:  + 動的間隔オプション、スプリットロットオプション 注文のアクティベーショントリガー、+ バイストップリミット / セルストップリミット 仮想SL、仮想
Cerberus Equity Watcher
Samuel Bandi Roccatello
5 (3)
Cerberus the Equity Watcher はリスク管理ツールであり、アカウントの資産を常に監視し、不完全な EA や裁量的なトレーダーの場合は感情的な行動によって引き起こされる大きなドローダウンを回避します。これは、バグを含む可能性のある EA や、予想外の市況でうまく機能しない可能性のある EA に依存するシステマティック トレーダーにとって非常に役立ちます。 Cerberus では、最小エクイティ値と (オプションで) 最大値を設定できます。これらのいずれかに達すると、すべてのポジションがフラットになり、すべての未決注文がクローズされ、すべての EA が「強制終了」されます。すべての位置を平坦化すると、ユーザーの携帯電話に通知が送信され、画面に明確なメッセージが表示されます。 「平坦化」の後、Cerberus は株式価値を監視し続け、再初期化されるまでそれ以上の取引の試みを停止し続けます。 Cerberus によって実行されるすべての操作は、画面に明確に表示され、Expert advisor タブに報告され、通知がユーザーに送信されます。ユーザーのミスを避けるために、
YuClusters
Yury Kulikov
4.93 (43)
Attention: You can view the program operation in the free version  YuClusters DEMO .  YuClusters is a professional market analysis system. The trader has unique opportunities to analyze the flow of orders, trade volumes, price movements using various charts, profiles, indicators, and graphical objects. YuClusters operates on data based on Time&Sales or ticks information, depending on what is available in the quotes of a financial instrument. YuClusters allows you to build graphs by combining da
MT5のエキスパートアドバイザーリスクマネージャーは非常に重要であり、私の意見ではすべてのトレーダーにとって必要なプログラムです。 このエキスパートアドバイザーを使用すると、取引口座のリスクを管理することができます。リスクと利益の管理は、金銭的およびパーセンテージの両方で実行できます。 エキスパートアドバイザーが機能するには、それを通貨ペアチャートに添付し、許容可能なリスク値を預金通貨または現在の残高の%で設定するだけです。 [Instruction for Risk Manager parameters] アドバイザ機能 このリスクマネージャーは、リスクの管理を支援します。 -取引のために -1日あたり - 1週間 - ひと月ほど 制御することもできます 1)取引時の最大許容ロット 2)1日あたりの最大注文数 3)1日あたりの最大利益 4)エクイティを引き受ける利益を設定する それだけではありません。設定で自動設定を指定した場合、アドバイザーはデフォルトのSLとTPを設定することもできます。 アドバイザーは各イベントにアラートを添えて、注文を削除する理由を説明し
Easy Trade – シンプルかつ強力なスマートトレード管理 Easy Trade は、リスクを適切にコントロールし、スムーズな取引執行を実現したい MetaTrader ユーザーのためのオールインワン・トレードマネジメントソリューションです。 トレーダーの声をもとにゼロから設計された Easy Trade は、複数シンボルの取引を簡単に実行・監視・管理できるようにし、作業フローを複雑にしません。 手動スキャルピングでも、少数のセットアップを管理するポートフォリオでも、Easy Trade は賢明な判断と安定した成果に集中できるようサポートします。 ⸻ なぜ Easy Trade を使うべきか? 精密なリスク管理:固定ロットサイズまたはパーセンテージによるリスク設定が可能。リアルタイムでリスクとリワード情報を確認。 バスケット型トレーリング:複数の取引の利益を監視。目標到達で部分利益を自動確保。 取引の自動記録:各取引をスクリーンショットで記録。ジャーナル記録やパフォーマンス分析に最適。 時限クローズ機能:指定日時での自動クローズ設定が可能。週末前や取引終了時に便利。 カス
Trade Manager DashPlus
Henry Lyubomir Wallace
5 (13)
DashPlus は、MetaTrader 5プラットフォーム上での取引効率と効果を向上させるために設計された高度なトレード管理ツールです。リスク計算、注文管理、高度なグリッドシステム、チャートベースのツール、パフォーマンス分析など、包括的な機能を提供します。 主な機能 1. リカバリーグリッド 逆境の市場環境下で取引を管理するための平均化および柔軟なグリッドシステムを実装します。 取引回復のための戦略的なエントリーおよびエグジットポイントを可能にします。 2. スタックグリッド 強い市場の動きの中でポジションを追加することで、有利な取引での潜在的なリターンを最大化するように設計されています。 トレンド市場で利益を得られるよう、勝ち取引を拡大します。 3. 損益(P&L)ライン チャート上に直接、潜在的な利益と損失のシナリオを視覚的に表示します。 設定を調整し、P&Lラインをドラッグして、実行前にさまざまな取引結果を評価します。 4. バスケットモード 同じシンボルでの複数ポジションの管理を簡素化し、それらを単一の集約ポジションにまとめます。 平均価格に基づいて、ストップロスやテイクプ
作者のその他のプロダクト
MomoPointsは、チャート上にロングとショートのエントリー/追加ポイントを表示するインジケーターです。 MomoPoints は、勢いとトレンドの強さに基づいて、リスク対報酬の比率が良好なエントリー/追加を表示します。 設定 ---------------------------------- デザイン: 信号の色、サイズ、ウィングディング (グラフィック シンボル) を調整できます。 シグナル設定: 移動平均期間、トレンドの強さ、移動平均から価格までの距離、RSI期間を設定できます。 信号値をコメントとして表示して、資産に正しい値を設定できます。また、インジケーターはあらゆる取引ペアまたは資産に適合します。 適切なエントリを表示するには、すべてのアセットに独自の設定が必要です。特定のペアの設定が必要で、自分でそれを見つけることができない場合は、私がお手伝いします。 アラーム:プッシュ通知とサウンド音声アラートを有効にすることができます。 シグナルはリアルタイムで発生し、再描画は必要ありません ご質問や追加情報や機能のご要望がございましたら、いつでもお問い合
FREE
この小さなツールは、チャート上で線をドラッグするだけでリスク管理を定義するのに役立ちます。アカウント%または固定金額に基づいて計算された実際のロットサイズがラインで直接表示されます。 キーボードの「t」キーを押してラインをアクティブにし、ラインをストップロスポイントまでドラッグするだけです。それでおしまい。 設定では、線とテキストの色と幅、行と右側のテキストのスペースを定義でき、リスクを口座または固定金額のパーセントで設定できます。 ご質問やご希望がございましたら、お気軽にお問い合わせください。 この小さなツールは、チャート上で線をドラッグするだけでリスク管理を定義するのに役立ちます。アカウント%または固定金額に基づいて計算された実際のロットサイズがラインで直接表示されます。 キーボードの「t」キーを押してラインをアクティブにし、ラインをストップロスポイントまでドラッグするだけです。それでおしまい。 設定では、線とテキストの色と幅、行と右側のテキストのスペースを定義でき、リスクを口座または固定金額のパーセントで設定できます。 ご質問やご希望がございましたら、お気軽にお問
FREE
ワンバーブレイクアウトEAシステムは、高い利益率により多くの可能性を秘めたブレイクアウト戦略です。 その日の最も強いトレンドに従い、革新的なトレーリング方法を通じて利益を最大化するように設計されています。 これにより、たとえ勝率が低くても、短期間で大きな利益を得ることができます。正しく設定すれば、数か月間利益を上げて運用できます。 これは、ES (US500)、NQ (NAS100) などの大規模市場、または金、銀などの商品に最適です。 機能や設定・バックテストについてご不明な点がございましたら、お気軽にお問い合わせください。ご購入前にメッセージをお送りいただくことも可能です。 あなたは、多くの設定および最適化オプションを備えた非常に柔軟なブレークアウト システムを購入しようとしています。 まず、NAS100 (NQ) と Gold の現時点での最適な設定を示します。また、バックテストの成功に関するヒントと、バックテストに最適なデータも提供されます。
フィルタ:
illeo
150
illeo 2024.05.27 10:53 
 

Ein Top-Produkt für alle, die selbst Daten für den Strategietester aufzeichnen möchten. Der Support ist sehr gut und es wurde sogar ein Verbesserungsvorschlag umgesetzt. Vielen Dank dafür. Klare Kaufempfehlung :) A top product for anyone who wants to record data for the strategy tester themselves. The support is very good and a suggestion for improvement was even implemented. Thank you for that. Clear purchase recommendation :)

レビューに返信