BS Trend MA Color

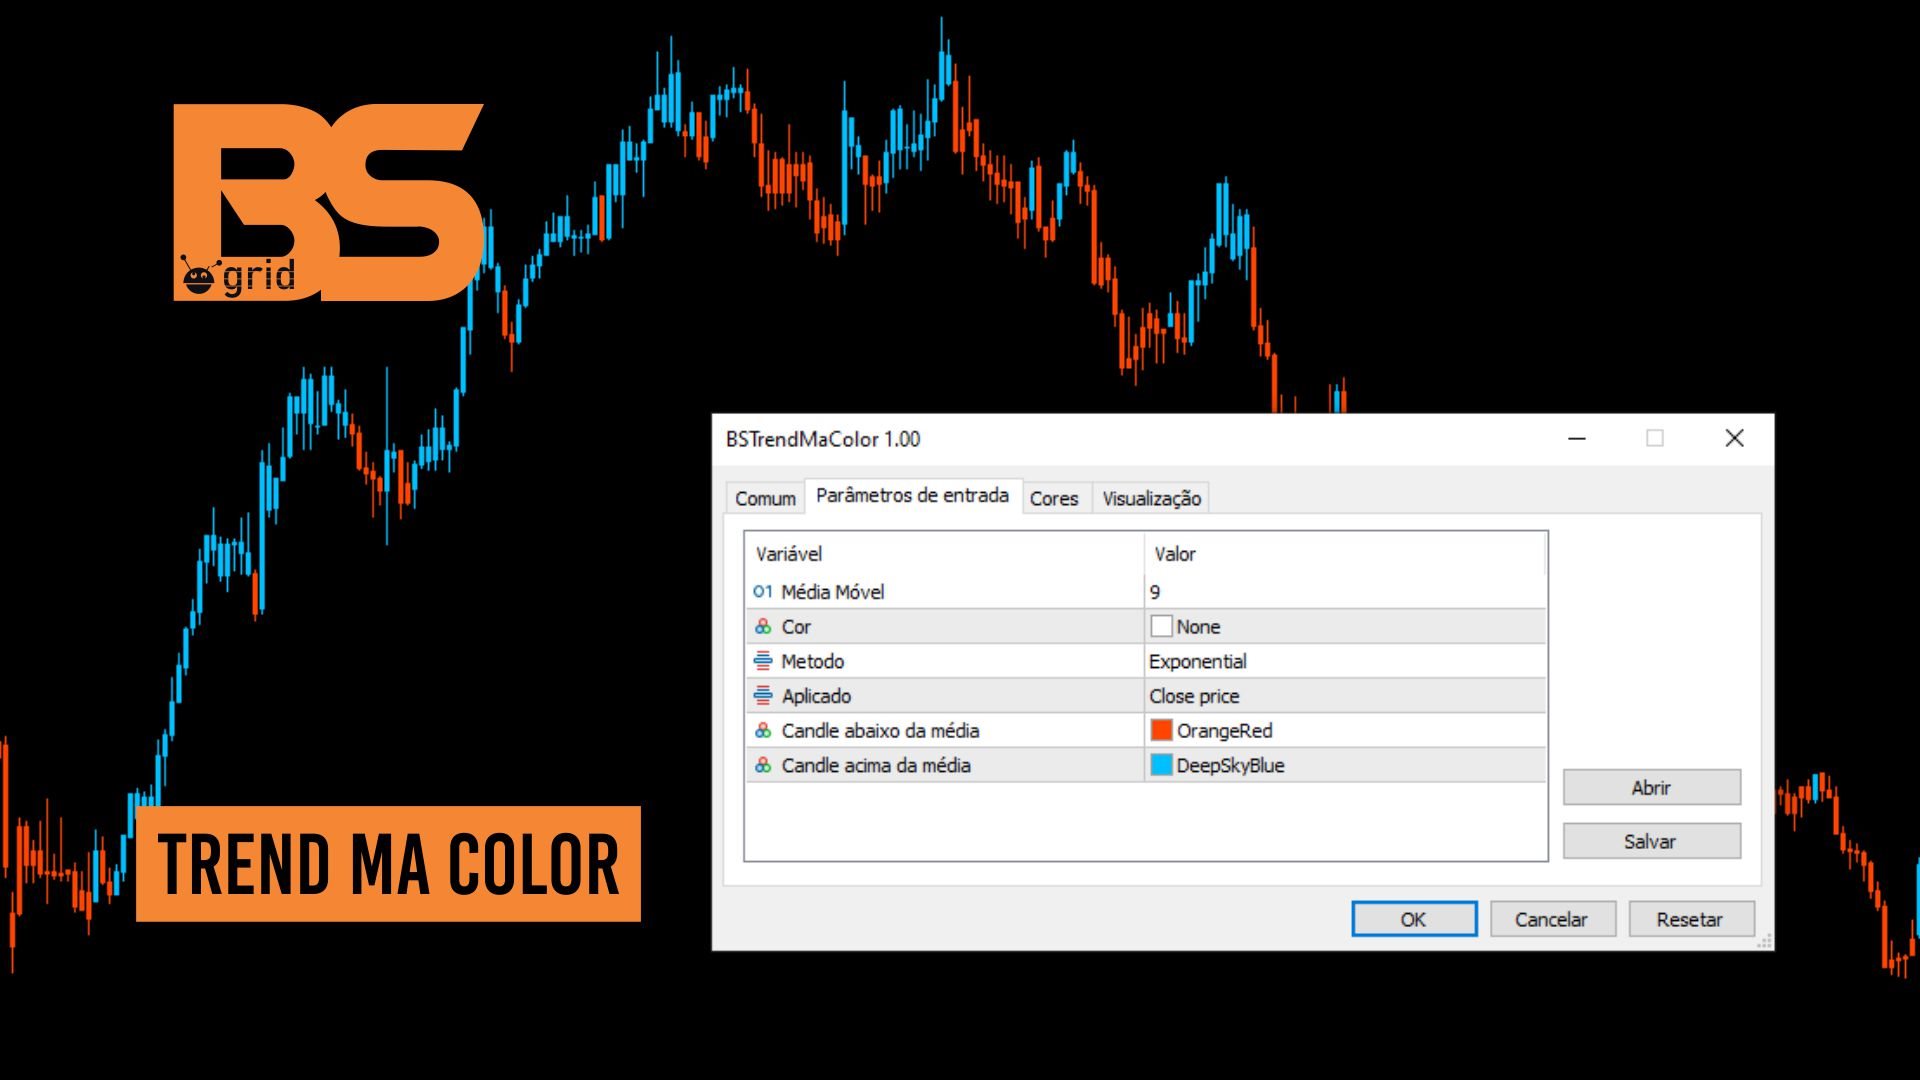
Transform your financial chart analysis with our innovative Candle Coloring Indicator. This powerful tool allows you to instantly visualize market trends based on closing prices relative to a customized average.

Customized Coloring: Choose colors that best suit your analysis style. Highlight candles above the average in a vibrant color of your choice and candles below the average in another distinctive color.

Adjustable Average: Tailor the indicator to your trading strategies by setting the average according to your preferences. Experiment with different values to find the configuration that best aligns with your investment style.

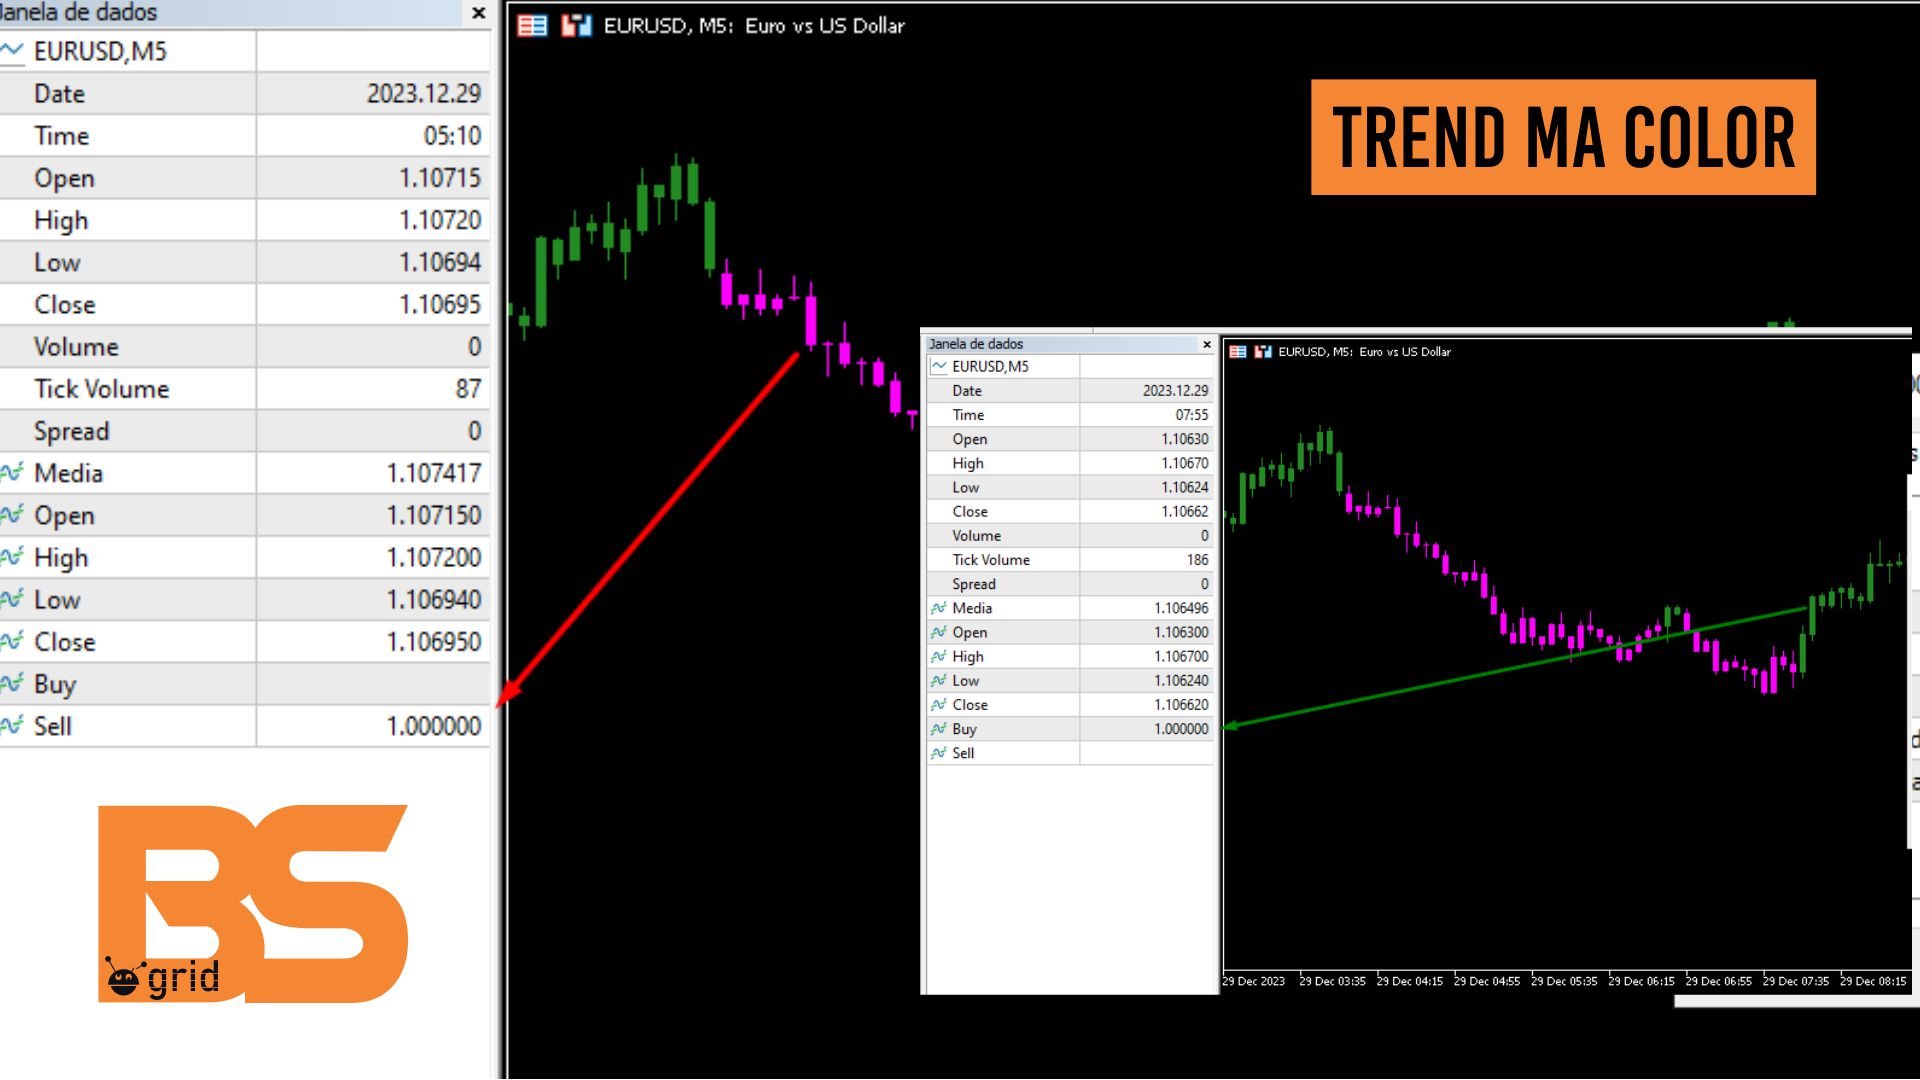
Quick and Efficient Analysis: With a single glance at the chart, you can identify areas of interest, providing a clear view of market conditions.

Feel free to make any further adjustments based on your preferences or target audience.

Buffer Buy: Configure your Expert Advisor (EA) to automatically place a buy order when the closing price is above the average. This enables your EA to promptly respond to favorable buying opportunities.Buffer Sell: Set a price below the average as Buffer Sell, allowing the EA to automatically execute sell operations when conditions are met. This provides an automated approach to capitalize on market downturns.

おすすめのプロダクト
BullBea Display
Everton Fernando Da Silva Messias
1. 基本情報 インジケーター名:   BullBear Display バージョン:   1.00 開発者:   [あなたの名前] 会社:   MT5TOOLSLAB 種類:   チャートインジケーター 市場:   外国為替、株式、先物、暗号通貨 2. 説明 BullBear Display   は以下をリアルタイムで表示する視覚的インジケーターです: ブル(買い手)の強さ ベア(売り手)の強さ 市場支配権(価格をコントロールしている側) このインジケーターはチャートの左上隅に情報を表示し、市場センチメントの迅速な分析を可能にします。 3. インストール BullBear_Display.mq5   を保存:   \MQL5\Indicators\ MetaTrader 5を再起動 「ナビゲータ」ウィンドウで「カスタムインジケーター」を探す 目的のチャートにドラッグ&ドロップ 4. 入力パラメータ PeriodBuySell   (デフォルト: 13): EMA参照計算の期間。低い値はより敏感なシグナルを、高い値はより滑らかなシグナルを生成します。 5. シグナル解釈 支配: ブル
Do you, like me, like to trade with the trend? Then this indicator will help you! Rainbow Trend is a trend indicator, which uses several Moving Averages on the chart. It measures different trend strenght zones for different periods: very long term, long term, mid term, short term and very short term. Each zone has its color, and it is possible to have sound alert when the prices leaves a zone and enters another. Its configuration is very simple. If you find any bug or have any suggestions, conta
The idea of the system is to indentify the reversal patterns using the calculation of the composite candle. The reversal patterns is similar to the "Hammer" and "Hanging Man" patterns in Japanese candlestick analysis. But it uses the composite candle instead the single candle and doesn't need the small body of the composite candle to confirm the reversal. Input parameters: Range - maximal number of bars, used in the calculation of the composite candle. Minimum - minimal size of the composite can
FREE
Swing BOS Structure is a market structure indicator for MetaTrader 5. The indicator automatically detects: • Swing High (SH) • Swing Low (SL) • Break of Structure (BOS) • Change of Character (CHoCH) Swings are confirmed only after a defined number of candles, ensuring no repainting. BOS signals indicate trend continuation. CHoCH signals indicate a potential change in market structure and may appear less frequently depending on market conditions and timeframe. The indicator is lightweight, fa
FREE
The Zigzag Price Arrow indicator is an enhanced version of the classic Zigzag indicator, combining the traditional zigzag pattern with advanced visual features. It not only identifies major market turning points but also provides clear trading signals through: • Directional arrows: Displays colored arrows (green for buy, magenta for sell) indicating potential trend directions. • Price labels: Shows the exact price values at each pivot point directly on the chart. • Improved visual clarity: Make
FREE
ROMAN5 Time Breakout Indicator automatically draws the boxes for daily support and resistance breakouts. It helps the user identifying whether to buy or sell. It comes with an alert that will sound whenever a new signal appears. It also features an email facility. Your email address and SMTP Server settings should be specified in the settings window of the "Mailbox" tab in your MetaTrader 5. Blue arrow up = Buy. Red arrow down = Sell. You can use one of my Trailing Stop products that automatical
FREE
1. Overview The Scalping PullBack Signal indicator is a powerful technical analysis tool designed to help traders identify scalping opportunities based on potential pullback and reversal signals. This tool is particularly useful on lower timeframes (below 15 minutes) but can also be applied on higher timeframes for longer-term trades. This indicator integrates several key analytical components, providing a comprehensive view of trends and potential entry/exit points, helping you make quick and e
FREE
Previous Candle Levels MT5
Wachinou Lionnel Pyrrhus Sovi Guidi
Previous Candle Levels MT5 shows the previous candle levels, it shows the previous candle Open High Low Close levels (OHLC Levels) in different time frame. It's designed to help the trader to analyse the market and pay attention to the previous candle levels in different time frame.  We all know that the OHLC Levels in Monthly, Weekly and Daily are really strong and must of the time, the price strongly reacts at those levels. In the technical analysis, the user can use them as a support and res
FREE
Inside Bar Radar
Flavio Javier Jarabeck
4.67 (6)
The Inside Bar pattern is a very well known candlestick formation used widely by traders all over the world and in any marketplace. This approach is very simple and adds a little confirmation candle, so it adds a third past candlestick to the count to confirm the direction of the move (upward or downward). Obviously, there is no power on this candlestick formation if the trader has no context on what it is happening on the market he/she is operating, so this is not magic, this "radar" is only a
FREE
VFI Quantum
Nikita Berdnikov
5 (1)
Introducing VFI (Volume Flow Indicator) – a trading indicator that analyzes the relationship between volume and price movement to identify key trading opportunities. The indicator displays the strength and direction of volume flow, providing clear signals about potential entry and exit points. Signals are formed based on zero line crossovers, crossovers between the VFI line and its exponential moving average (EMA), and when the indicator exits overbought and oversold zones. Attention! This stra
FREE
概要 このインジケーターは、クラシックな ドンチャンチャネル を強化したバージョンで、実践的なトレード機能を追加しています。 標準の3本線(上限、下限、中央線)に加え、 ブレイクアウト を検出し、チャート上に矢印で視覚的に表示します。また、チャートを見やすくするために、 現在のトレンド方向と逆側のラインのみを表示 します。 インジケーターの機能: 視覚的シグナル :ブレイクアウト時にカラフルな矢印を表示 自動通知 :ポップアップ、プッシュ通知、Eメール RSIフィルター :市場の相対的な強弱に基づいてシグナルを検証 カスタマイズ可能 :色、ラインの太さ、矢印コード、RSI閾値など 動作原理 ドンチャンチャネルは次のように計算します: 上限線 :直近N本のクローズ済みローソク足の最高値 下限線 :直近N本のクローズ済みローソク足の最安値 中央線 :最高値と最安値の平均値 上方ブレイクアウト は終値が上限線を超えたときに発生し、 下方ブレイクアウト は終値が下限線を下回ったときに発生します。 インジケーターは以下を行います: 3本のドンチャンラインを描画 方向転換後の最初のブレイクアウト
FREE
Introducing   Order Blocks Breaker , a brand-new way to identify and leverage order blocks in your trading strategy. After developing multiple order block tools with unique concepts, I’m proud to present this tool that takes things to the next level. Unlike previous tools,   Order Blocks Breaker   not only identifies order blocks but also highlights   Breaker Order Blocks —key areas where the price is likely to retest after a breakout. MT4 -  https://www.mql5.com/en/market/product/124101/ This t
RSI abcd
Francisco Gomes Da Silva
3 (1)
RSI ABCDパターンファインダー:テクニカル戦略 1. インジケーターの仕組み 古典的RSI と ABCD調和パターン の自動検出を組み合わせたものです。 主要コンポーネント 標準RSI (調整可能な期間) 高値・安値マーカー (矢印) ABCDパターン (緑/赤の線) 過買(70)・過売(30)フィルター 2. MT5設定 period = 14 ; // RSI期間 size = 4 ; // 最大パターンサイズ OverBought = 70 ; // 過買水準 OverSold = 30 ; // 過売水準 Filter = USE_FILTER_ YES ; // 確認フィルター 3. 取引戦略 3.1. 買いエントリー(強気ABCD) 条件: RSIが以下を形成: 谷( A )→ 山( B )→ より高い谷( C ) D が過売域(30)より上だが C より下 確認:A-B-C-Dを結ぶ緑色の線 目標: TP1: B-Cの61.8% TP2: B-Cの100% ストップロス: D より下 3.2. 売りエントリー(弱気ABCD) 条件: RSIが以下を形成: 山( A
FREE
I'm sure after a lot of research on the internet, you haven't found any indicator that can help you with forex or binary trading in the latest probability strategy created by famous trader Ronald Cutrim. The strategy is based on a simple count of green and red candles, checking for a numerical imbalance between them over a certain period of time on an investment market chart. If this imbalance is confirmed and is equal to or greater than 16%, according to trader Ronald Cutrim, creator of the pro
FREE
️ Trade Manager oneclick  ( Reverse Trade,  Partial Close,  Breakeven, Close All Running Trade )   control – Smart Manual Trade Control for MT5 Trade Manager oneclick control is a powerful yet lightweight trade management utility built for manual traders who want precise control over their open positions — directly from the MT5 chart. This EA does not open or close trades automatically based on any strategy. It simply provides one-click management tools to handle your running trades efficient
FREE
Candle Counter is a simple indicator that list the amout of candles in the day according to the current chart timeframe. It is specially useful for those teaching others how to trade, as it can draw attention to a specific candle of the day. Configuration: Reverse mode - if on, the actual candle is the first one. Position - Above or below the candles. Vertical distance - Vertical distance from the candles in pipets/points. Size - Font size. If you need help please don't hesitate to contact me.
FREE
Awesome Oscillator by Bill Williams with the ability to fine-tune and replace the averaging algorithms of the indicator, which significantly expands the possibilities of using this oscillator in algorithmic trading and brings it closer in its properties to such an indicator as the MACD. To reduce price noise, the final indicator is processed with an additional Smooth averaging. The indicator has the ability to give alerts, send mail messages and push signals when the direction of movement of th
The Supertrend indicator is a trend-following technical analysis tool designed to help traders identify the direction of market trends and potential entry/exit points. It operates based on price data and Average True Range (ATR) to create a dynamic signal line that changes color depending on the current trend. Green color: Indicates an uptrend. Red color: Indicates a downtrend. Supertrend is a useful indicator for both short-term and long-term trading, helping to filter out market noise and focu
FREE
Auto Fib Retracements
Ross Adam Langlands Nelson
4.2 (5)
Automatic Fibonacci Retracement Line Indicator. This indicator takes the current trend and if possible draws Fibonacci retracement lines from the swing until the current price. The Fibonacci levels used are: 0%, 23.6%, 38.2%, 50%, 61.8%, 76.4%, 100%. This indicator works for all charts over all timeframes. The Fibonacci levels are also recorded in buffers for use by other trading bots. Any comments, concerns or additional feature requirements are welcome and will be addressed promptly. 
FREE
Time Dashboard MT5 is a powerful and user-friendly MetaTrader 5 indicator designed to provide real-time time zone and clock information directly on your trading chart. Ideal for forex traders and global market participants, this tool displays server time, local time, and the time difference between them, enhancing your ability to manage trades across different time zones. Key Features : Real-Time Time Display : Shows current server time, local time, and their respective time zones with precise o
FREE
Free automatic Fibonacci is an indicator that automatically plots a Fibonacci retracement based on the number of bars you select on the BarsToScan setting in the indicator. The Fibonacci is automatically updated in real time as new highest and lowest values appears amongst the selected bars. You can select which level values to be displayed in the indicator settings. You can also select the color of the levels thus enabling the trader to be able to attach the indicator several times with differe
FREE
The RSI with Moving Averages indicator combines the classic Relative Strength Index with customizable moving averages, offering deeper insights into market momentum and trend direction. By smoothing the RSI curve with short- and long-term averages, traders can better distinguish true reversals from noise. This tool highlights overbought and oversold levels, reveals divergences between price and momentum, and confirms entry or exit points with enhanced accuracy. Its adjustable parameters allow tr
FREE
Ideal for scalpers, day traders and swing trades. Automatically identifies key support and resistance levels based on historical price data. It displays real-time trading zones and a precise countdown timer for each candle, helping traders make faster and more confident decisions. Fully customizable for multiple timeframes and instruments. The indicator analyzes historical price data to draw horizontal levels that represent key trading areas. It also displays, in real time, the current zone whe
FREE
MACD Enhanced
Nikita Berdnikov
5 (2)
Introducing the MACD  Enhanced – an advanced MACD (Moving Average Convergence Divergence) indicator that provides traders with extended capabilities for trend and momentum analysis in financial markets. The indicator uses the difference between the fast and slow exponential moving averages to determine momentum, direction, and strength of the trend, creating clear visual signals for potential entry and exit points. Attention! To achieve the best results, it is recommended to adapt the indicator
FREE
Gold Flowcon
Mr Numsin Ketchaisri
MT5 Auto Trading  of  Gold :  Market Struture(Key Level) and Liquidity Breakout Strategy Real Time Signal  Flowcon :   https://www.mql5.com/en/signals/2308343 Key features include: Breakout Trading - Smart Money Concept: Automatically identifies demand and supply zones at swing highs and lows, targeting the most critical market levels.    Risk & Order Management: Progressive and flexible lot sizing with consistent take profit and stop loss ensures a balanced approach to growth and recovery
FREE
Easy Buy Sell is a market indicator for opening and closing positions. It becomes easy to track market entries with alerts. It indicates trend reversal points when a price reaches extreme values ​​and the most favorable time to enter the market. it is as effective as a Fibonacci to find a level but it uses different tools such as an algorithm based on ATR indicators and Stochastic Oscillator. You can modify these two parameters as you wish to adapt the settings to the desired period. It cannot
FREE
JAC Trend Color Candle
Eduardo Da Costa Custodio Santos
The indicator "JAC Trend Color Candle" for Meta Trader 5, was created to visually facilitate the trend for the trader. It is based on three parameters, which identifies the uptrend, downtrend and non-trending market. The colors are trader-configurable, and the average trader-configurable as well. trend parameters cannot be configured as they are the indicator's differential.
数列の一つに「森林火災数列」があります。これは、最も美しい新しいシーケンスの 1 つとして認識されています。その主な特徴は、このシーケンスが線形トレンドを回避することです。最短のものであってもです。この指標の基礎を形成したのはこのプロパティです。 財務時系列を分析する場合、この指標は可能なすべての傾向オプションを拒否しようとします。そして失敗した場合にのみ、トレンドの存在を認識し、適切なシグナルを発します。このアプローチにより、新しいトレンドの始まりの瞬間を正しく判断できます。ただし、偽陽性の可能性もあります。それらの数を減らすために、このインジケーターに追加のフィルターが追加されました。新しいバーが開くとシグナルが生成されます。いずれの場合も再描画は発生しません。 指標パラメータ: Applied Price   - 適用価格定数; Period Main   - インディケータのメイン期間、その有効な値は 5 ~ 60 です。 Period Additional   - 追加の期間。このパラメーターの有効な値は 5 ~ 40 です。 Signal Filter   - 追加の信号
Relative Volume RVOL
Alberto Gauer Borrego
4.67 (3)
Relative Volume or RVOL   is an indicator that averages the volume of X amount of days, making it easy to compare sessions volumes. The histogram only has 3 colors: Green - Above average volume Yellow - Average volume Red - Below average volume The default setting is 20 days, which corresponds more or less to a month of trading. In this version is possible to choose between tick and real volumes (if you are using a broker which offers future contracts) With the data obtained from this in
FREE
Follow The Line MT5
Oliver Gideon Amofa Appiah
4.59 (34)
This indicator obeys the popular maxim that: "THE TREND IS YOUR FRIEND" It paints a GREEN line for BUY and also paints a RED line for SELL. (you can change the colors). It gives alarms and alerts of all kinds. IT DOES NOT REPAINT and can be used for all currency pairs and timeframes. Yes, as easy and simple as that. Even a newbie can use it to make great and reliable trades. NB: For best results, get my other premium indicators for more powerful and reliable signals. Get them here: https://www.m
FREE
このプロダクトを購入した人は以下も購入しています
このインジケーターを購入すると、プロ仕様のトレードマネージャーを無料で差し上げます。 まず第一に、このトレーディングシステムがノンリペイント、ノンリドロー、ノンラグのインジケーターであることを強調する価値がある。これにより、手動取引とロボット取引の両方に理想的なものになっています。 オンラインコース、マニュアル、プリセットのダウンロード。 「スマートトレンドトレーディングシステム MT5」は、新規および経験豊富なトレーダー向けにカスタマイズされた包括的なトレーディングソリューションです。10以上のプレミアムインジケーターを組み合わせ、7つ以上の堅実なトレーディング戦略を備えており、多様な市場状況に対応する多目的な選択肢となっています。 トレンドフォロー戦略:トレンドを効果的に乗り越えるための正確なエントリーとストップロス管理を提供します。 リバーサル戦略:潜在的なトレンドの反転を特定し、トレーダーがレンジ相場を活用できるようにします。 スキャルピング戦略:高速で正確なデイトレードおよび短期取引のために設計されています。 安定性:すべてのインジケーターはノンリペイント、ノンリドロー、ノ
Power Candles – あらゆる市場に対応した強度ベースのエントリーシグナル Power Candles は、Stein Investments が長年培ってきた強度分析を価格チャート上に直接反映します。価格だけに反応するのではなく、各ローソク足は実際の市場の強さに基づいて色分けされ、モメンタムの蓄積、強度の加速、明確なトレンド転換を瞬時に把握できます。 すべての市場に共通する単一ロジック Power Candles は すべての取引シンボル で自動的に動作します。現在のシンボルが Forex か非 Forex 市場かを自動判別し、内部で適切な強度モデルを適用します。 Forex および Gold :FX Power のデルタ値を使用(絶対値レンジ最大 100) 指数、暗号資産、CFD :IX Power の強度値を使用(絶対値レンジ最大 50) 必要な強度計算は Power Candles に直接組み込まれています。ローソク足のカラーリングやシグナルロジックに、追加のインジケーターは不要です。 価格ノイズではなく「強度状態」 各ローソク足は、以下の 9 つの明確に定義された強
Gold Sniper Scalper Pro - MetaTrader 5 用 ゴールド (XAU/USD) トレーディングシステム 真剣なトレーダーのために: 複数の市場分析要因を組み合わせた、構造化され、データ駆動型の方法論でゴールド取引に取り組みます。このツールは、あなたのゴールド取引分析をサポートするために構築されています。 限定価格の機会 これは、価格が上昇する前に Gold Sniper Scalper Pro を所有するチャンスです。 その後の購入 10 件ごとに $50 ずつ上昇します。 最終価格: $498 あなたの分析的優位性を定義する機能 Gold Sniper Scalper Pro は、深い洞察と明確な統計的優位性を提供するために設計された包括的なツールキットです: システム、入力のカスタマイズ、およびインジケーター使用時の注意事項を含む詳細なインジケーター使用ガイドは、以下の MQL 記事に記載されています。ドキュメントを参照してください。 Gold Sniper Scalper Pro - Gold (XAU/USD) Trading System o
このインジケーターを購入された方には、以下の特典を 無料 で提供しています: 各トレードを自動で管理し、ストップロスとテイクプロフィットを設定し、戦略ルールに基づいてポジションを決済する補助ツール 「Bomber Utility」 様々な銘柄に合わせたインジケーターの設定ファイル(セットファイル) 「最小リスク」、「バランスリスク」、「待機戦略」 の3つのモードで使用できる Bomber Utility 用の設定ファイル このトレーディング戦略をすぐに導入・設定・開始できる ステップバイステップのビデオマニュアル ご注意: 上記の特典を受け取るには、MQL5のプライベートメッセージシステムを通じて販売者にご連絡ください。 オリジナルのカスタムインジケーター 「Divergence Bomber(ダイバージェンス・ボンバー)」 をご紹介します。これは、MACDのダイバージェンス(乖離)戦略に基づいた 「オールインワン」型のトレーディングシステム です。 このテクニカルインジケーターの主な目的は、価格とMACDインジケーターの間に発生するダイバージェンスを検出 し、将来の価格の動きを示す
発売プロモーション Azimuth Proは先着 100 名様限定で 299 ドルでご提供します。 最終価格は 499 ドルとなります。 リテールとインスティテューショナルのエントリーの違いはインジケーターではなく、ロケーションにあります。 多くのトレーダーは、モメンタムを追いかけたり、遅行シグナルに反応して、任意の価格レベルでエントリーします。機関投資家は、需給が実際にシフトする構造的なレベルに価格が到達するのを待ちます。 Azimuth Proはこれらのレベルを自動的にマッピングします:スイングアンカーVWAP、マルチタイムフレーム構造ライン、高確率ロケーションにのみ出現するABCパターン。 Azimuth Proは、構造分析とインテリジェントな自動化の両方を求めるプロフェッショナルトレーダー向けに構築されています。 Azimuthが外科的精度で市場構造をマッピングする一方、Azimuth Proはインテリジェンスレイヤーを追加します:トレーディングスタイルの自動検出、スマート設定された移動平均線、20年のデータでバックテストされた最適化パラメータ。その結果、お使いの
Entry In The Zone and SMC Multi Timeframe は、Smart Money Concepts(SMC)に基づいて開発された リアルタイム市場分析ツール です。 本システムは、トレーダーがマーケットストラクチャーを体系的に分析し、市場全体の方向性をより明確に把握できるよう設計されています。 システムは複数の時間軸にわたり、 反転ポイント(Reversal Points)・主要ゾーン(Key Zones)・マーケットストラクチャー を自動的に解析します。さらに、 POI(Point of Interest)・ノーリペイントシグナル・Auto Fibonacci Levels を表示し、プルバックや反転ポイントを高精度で検出します。 リアルタイムシグナルとアラートにより、価格が主要ゾーンに到達したときや、ゾーン内で反転シグナルが発生した際に、重要な機会を逃すことはありません。 また、本システムは インジケーター と シグナルシステム の両方の機能を兼ね備えた 2-in-1ツール であり、ゾーン分析とリアルタイムエントリーシグナルを一体化しています。 さらに
ARIPoint
Temirlan Kdyrkhan
1 (1)
ARIPoint is a powerful trading companion designed to generate high-probability entry signals with dynamic TP/SL/DP levels based on volatility. Built-in performance tracking shows win/loss stats, PP1/PP2 hits, and success rates all updated live. Key Features: Buy/Sell signals with adaptive volatility bands Real-time TP/SL/DP levels based on ATR Built-in MA Filter with optional ATR/StdDev volatility Performance stats panel (Success, Profit/Loss, PP1/PP2) Alerts via popup, sound, push, or email Cu
Game Changerは、あらゆる金融商品で使用できる革新的なトレンドインジケーターです。メタトレーダーを強力なトレンドアナライザーへと変貌させます。このインジケーターは再描画や遅延がありません。あらゆる時間枠で動作し、トレンドの特定、反転の可能性のシグナル、トレーリングストップ機能、そして迅速な市場反応のためのリアルタイムアラートを提供します。経験豊富なプロ、あるいは優位性を求める初心者の方でも、このツールは自信と規律を持ち、トレンドの根底にあるダイナミクスを明確に理解した上で取引を行うための力となります。 購入後すぐにご連絡いただくと、個人ボーナスを進呈いたします!強力なサポートとトレンドスキャナーインジケーターの無料コピーもご用意しておりますので、お気軽にプライベートメッセージでご連絡くださ. 私のEAやスペシャルセットはTelegramでは販売しておりません。Mql5のみで販売しており、セットファイルはこちらのブログでのみ公開し ております 。詐欺師にはご注意ください。他の方からセットを購入しないでください。 設定 トレンド変化時のアラートを有効にする - True/Fals
トレンド スクリーナー インジケーターでトレンド取引の力を解き放ちます。ファジー ロジックと複数通貨システムを活用した究極のトレンド取引ソリューションです。 ファジー ロジックを活用した革新的なトレンド インジケーターである Trend Screener を使用して、トレンド取引を向上させます。 これは、13 を超えるプレミアム ツールと機能、および 3 つの取引戦略を組み合わせた強力なトレンド追跡インジケーターであり、Metatrader をトレンド アナライザーにする多用途の選択肢となります。 期間限定オファー : トレンド スクリーナー インジケーターは、わずか 100 ドルで生涯ご利用いただけます。 (元の価格 50$ ) (オファー延長) Trend Screener の 100% 非再描画精度の揺るぎない精度を体験して、取引の決定が過去の価格変動の影響を受けないようにしてください。 マルチタイムフレームおよびマルチ通貨機能の多用途性を解放し、比類のない自信を持って外国為替、商品、暗号通貨、インデックスの世界を取引できるようにします。 Trend Screener の包括的な
FX Power: 通貨の強弱を分析して、より賢い取引を実現 概要 FX Power は主要通貨と金の実際の強弱をあらゆる市場状況で理解するための必須ツールです。強い通貨を買い、弱い通貨を売ることで、 FX Power は取引の意思決定を簡素化し、高い確率の取引機会を見出します。トレンドを追従する場合でも、極端なデルタ値を使用して反転を予測する場合でも、このツールはあなたの取引スタイルに完全に適応します。ただ取引するだけではなく、 FX Power で賢く取引をしましょう。 1. なぜ FX Power がトレーダーにとって非常に有益なのか 通貨と金のリアルタイム強弱分析 • FX Power は主要通貨と金の相対的な強弱を計算し、マーケットダイナミクスに関する明確な洞察を提供します。 • どの資産がリードしているか、または後れを取っているかを監視して、取引するペアを賢く選びましょう。 マルチタイムフレームの包括的なビュー • 短期、中期、長期のタイムフレームで通貨と金の強弱を追跡し、マーケットトレンドに基づいて取引戦略を調整できます。 • スキャルピングからスイングトレード
優れたテクニカルインジケーター「Grabber」をご紹介します。これは、すぐに使える「オールインワン」トレーディング戦略として機能します。 ひとつのコードに、市場のテクニカル分析ツール、取引シグナル(矢印)、アラート機能、プッシュ通知が強力に統合されています。 このインジケーターを購入された方には、以下の特典を無料で提供します: Grabberユーティリティ:オープンポジションを自動で管理するツール ステップバイステップのビデオマニュアル:インジケーターのインストール、設定、取引方法を解説 カスタムセットファイル:インジケーターをすばやく自動設定し、最大限の成果を出すための設定ファイル 他の戦略はもう忘れてください!Grabberだけが、あなたを新たなトレードの高みへと導いてくれるのです。 Grabber戦略の主な特徴: 推奨タイムフレーム:M5〜H4 対応通貨ペア・資産:どれでも使用可能ですが、私が実際に検証した以下を推奨します(GBPUSD、GBPCAD、GBPCHF、AUDCAD、AUDUSD、AUDSGD、AUDCHF、NZDUSD、NZDCAD、EURCAD、EURUSD、E
まず第一に、この取引インジケーターは再描画されず、再描画されず、遅延しないことを強調する価値があります。これにより、手動取引とロボット取引の両方に理想的なものになります。 ユーザーマニュアル:設定、入力、戦略。 アトミックアナリストは、価格の強さとモメンタムを利用して市場でより良いエッジを見つけるためのPA価格アクションインジケーターです。ノイズや誤ったシグナルを除去し、取引ポテンシャルを高めるための高度なフィルターを備えています。複雑なインジケーターの複数のレイヤーを使用して、アトミックアナリストはチャートをスキャンし、複雑な数学的計算をシンプルなシグナルと色に変換します。これにより、どのような初心者トレーダーでも理解して使用し、一貫した取引の決定を行うことができます。 「アトミックアナリスト」は、新規および経験豊富なトレーダー向けにカスタマイズされた包括的な取引ソリューションです。プレミアムインジケーターとトップノッチの機能を1つの取引戦略に組み合わせ、すべてのタイプのトレーダーにとって汎用性のある選択肢にします。 デイリートレーディングとスキャルピング戦略:高速で正確なデイ
Smart Stop Indicator – チャート上で実現するインテリジェントなストップロス精度 概要 Smart Stop Indicator は、ストップロスを勘や感情ではなく、明確で体系的に設定したいトレーダーのために設計されています。本ツールは、クラシックなプライスアクション(高値更新・安値切り下げ)と最新のブレイクアウト認識ロジックを組み合わせ、次に来るべき論理的なストップレベルを正確に特定します。トレンド相場、レンジ、急速なブレイクアウト局面のいずれであっても、最適な SL ゾーンとその状態(“new”、“broken”、“valid”)をチャート上に直接表示します。さらに今回、SL 距離の %ADR 表示も新たに追加されています。 主な特徴 マーケット構造に基づく自動ストップ配置 • 市場構造とリアルタイムの値動きに基づき、意味のあるストップロスレベルを自動検出します。 スマートなブレイクアウト感知 • 急激な方向転換やブレイクアウトにも柔軟に対応し、早すぎるストップ調整を避けます。 SL %ADR の表示 • ストップロスまでの距離を ADR(Averag
Quantum TrendPulse を ご紹介します。これは、   SuperTrend   、   RSI   、および Stochastic のパワーを 1 つの包括的なインジケーターに組み合わせて、取引の可能性を最大限に引き出す究極の取引ツールです。精度と効率を求めるトレーダー向けに設計されたこのインジケーターは、市場のトレンド、勢いの変化、最適なエントリー ポイントとエグジット ポイントを自信を持って特定するのに役立ちます。 主な特徴: SuperTrend 統合: 現在の市場動向に簡単に追従し、収益性の波に乗ることができます。 RSI精度: 買われすぎと売られすぎのレベルを検出し、市場の反転のタイミングに最適で、SuperTrendのフィルターとして使用されます。 確率的精度: 確率的振動を活用して、変動の激しい市場で隠れたチャンスを見つけます。SuperTrend のフィルターとして使用されます。 マルチタイムフレーム分析:   M5 から H1 または H4 まで、さまざまなタイムフレームで市場を常に把握します。 カスタマイズ可能なアラート: カスタム取引条件が満たされ
- Real price is 80$ - 45% Discount (It is 45$ now) Contact me for extra bonus   indicator, instruction or any questions! - Lifetime update free - Non-repaint - Related product: Gann Gold EA - I just sell my products in Elif Kaya Profile, any other websites are stolen old versions, So no any new updates or support. Advantages of  M1 Scalper Pro  Profitability: M1 Scalper Pro is highly profitable with a strict exit strategy. Frequent Opportunities: M1 Scalper Pro  takes advantage of numerous smal
これまでに、 素晴らしいバックテスト結果、 驚くべき数値を持つ ライブ口座のパフォーマンス証明 、そして あらゆる場所での統計情報 がある取引インジケーターを購入し、しかし使用後に 口座を破綻させてしまった ことは何度ありますか? シグナル単独を信用すべきではありません。そもそもなぜそれが表示されたのかを知る必要があります。そして、それこそがRelicusRoad Proの得意とすることです! ユーザーマニュアル + 戦略 + トレーニングビデオ + VIPアクセス付きプライベートグループ + モバイル版利用可能 市場の見方を変える新しい方法 RelicusRoadは、FX、先物、仮想通貨、株式、指数に対応する、 世界で最も強力で最高の取引インジケーター であり、トレーダーが口座を 成長させる ために必要なすべての情報とツールを提供します。 初心者 から 上級者 まで、 すべてのトレーダー が成功できるよう、 テクニカル分析 と 取引計画 を提供します。 これは、将来の市場を 予測する のに十分な情報を提供する 主要な取引インジケーター です。私たちは、チャート上で意味をなさない複
Trend Ai indicatorは、トレンドの識別と実用的なエントリポイントと反転アラートを組み合わせることで、トレーダーの市場分析を強化する優れたツールです。 この指標は、ユーザーが自信と正確さで外国為替市場の複雑さをナビゲートすることを可能にします トレンドAiインジケーターは、主要なシグナル以外にも、プルバックやリトレースメント中に発生するセカンダリエントリポイントを識別し、トレーダーが確立されたトレンド内の価格修正を活用できるようにします。 重要な利点: *MT4およびMT5の仕事 *明確な買いまたは売りシグナル *再描画しません ·すべての資産で動作します 私はeaやセットをtelegram it詐欺で販売しないように注意してください。 すべての設定はここでブログで無料です。  重要! 指示とボーナスを得るために購入後すぐに私に連絡してください! 私の他のプロダクトと同様、実質操作の監視はここに見つけることができます: https://www.mql5.com/en/users/mechanic/seller&nbsp ; 設定および入力: すべての
IX Power MT5
Daniel Stein
4.92 (12)
IX Power: 指数、商品、暗号資産、外国為替市場の洞察を発見 概要 IX Power は、指数、商品、暗号資産、外国為替市場の強弱を分析するための多用途ツールです。 FX Power が全ての利用可能な通貨ペアデータを活用して外為ペアで最高の精度を提供する一方、 IX Power は基礎資産の市場データにのみ焦点を当てています。この特性により、 IX Power は非外為市場に最適であり、単純な外為分析にも信頼性の高いツールです。どのチャートでもスムーズに機能し、取引判断を向上させるための明確で実行可能な洞察を提供します。 1. IX Power がトレーダーにとって価値がある理由 複数市場での強弱分析 • IX Power は指数、商品、暗号資産、外為シンボルの強弱を計算し、それぞれの市場に合わせた洞察を提供します。 • US30、WTI、ゴールド、ビットコイン、または通貨ペアなどの資産を監視して取引機会を発見できます。 幅広い市場に適応 • 外為取引では、 FX Power が関連する全ての通貨ペアを分析することで比類のない精度を提供します。 • IX Power
まず第一に、この取引ツールはノンリペイント、ノンリドロー、ノンラグの指標であり、プロの取引に理想的ですことを強調する価値があります。 オンラインコース、ユーザーマニュアル、デモ。 スマートプライスアクションコンセプトインジケーターは、新米から経験豊富なトレーダーまで、非常 に強力なツールです。Inner Circle Trader AnalysisやSmart Money Concepts Trading Strategiesなど、20以上の有用な指標を1つに組み合わせています。このインジケーターはスマートマネーコンセプトに焦点を当て、大手機関の取引方法を提供し、彼らの動きを予測するのに役立ちます。 特に、流動性分析に優れており、機関がどのように取引しているかを理解しやすくしています。市場のトレンドを予測し、価格の動きを慎重に分析するのに優れています。機関の戦略とトレードを合わせることで、市場の動向についてより正確な予測ができます。このインジケーターは多目的であり、市場構造を分析し、重要な注文ブロックを特定し、さまざまなパターンを認識するのに優れています。 このインジケーター
Gold Entry Sniper – ゴールドスキャルピング&スイングトレード用プロフェッショナル多時間足ATRダッシュボード Gold Entry Sniper は、XAUUSDや他の銘柄向けに正確な 売買シグナル を提供する、MetaTrader 5用の高度なインジケーターです。 ATRトレーリングストップロジック と 多時間足分析ダッシュボード を搭載し、スキャルピングからスイングトレードまで対応します。 主な特徴と利点 多時間足シグナル分析 – M1、M5、M15 のトレンドを同時表示。 ATRベースのトレーリングストップ – ボラティリティに応じて動的に調整。 プロ仕様のチャートダッシュボード – シグナル状況、ATRレベル、回帰線、売買方向を表示。 明確な売買マーカー – 自動矢印とテキストラベル。 エグジットアラートとトレード管理 – 利益確定のための自動検出。 完全カスタマイズ可能 – パネル位置、色、フォント、ATR/回帰設定を調整可能。 ゴールド(XAUUSD)に最適化 – M1〜M15のスキャルピングに最適、FXや指数、暗号資産にも対応。 Gold Entry
Prices move for many reasons and these can vary from one operator to another: software, private and institutional traders simultaneously contribute to the formation of the price, making predictive art very difficult. However, there are measurable factors that bind the price to an underlying trend in line with the physical reality that the financial asset represents: these are the macroeconomic indicators. Large investors use this information wisely to set their strategies. Understanding these m
Matreshka
Dimitr Trifonov
5 (2)
Matreshka self-testing and self-optimizing indicator: 1. Is an interpretation of the Elliott Wave Analysis Theory. 2. Based on the principle of the indicator type ZigZag, and the waves are based on the principle of interpretation of the theory of DeMark. 3. Filters waves in length and height. 4. Draws up to six levels of ZigZag at the same time, tracking waves of different orders. 5. Marks Pulsed and Recoil Waves. 6. Draws arrows to open positions 7. Draws three channels. 8. Notes support and re
Ace Trend
Mikhail Sergeev
5 (2)
私たちはあなたにトレンド取引の世界でゲームのルールを変える革命的な指標を提示します。 指標は、パフォーマンスを再考し、前例のない高さにあなたの取引経験を高めるように設計されています。 私たちの指標は、競合他社とは一線を画す高度な機能のユニークな組み合わせを誇っています。 "実質の価格設定要因"の先端技術は最も困難で、揮発市況の最高の安定性を保障する。 不安定なパターン、壊れた指標に別れを告げ、意識的で制御された取引を歓迎します。 指標は単なる美しい絵ではありません! 指標は、トレーダーの側にオッズをシフトし、それによって利益を得る必要があります。 インジケータ信号(完全自動モード)に基づいて取引結果に慣れる: https://www.mql5.com/ja/signals/2339244 AceTrendは、rbtiバージョンによるトレンド指標のランキングで第一位にランクされています。 インターネット上の"AceTrend trend indicatorのテスト"に関する情報を検索することで、詳細を調べることができます。 AceTrend-取引における最大の収益性と制御。 私たちの指標
サポートとレジスタンススクリーナーは、1つのインジケーター内に複数のツールを提供するMetaTraderの1つのレベルインジケーターにあります。 利用可能なツールは次のとおりです。 1.市場構造スクリーナー。 2.強気のプルバックゾーン。 3.弱気プルバックゾーン。 4.デイリーピボットポイント 5.毎週のピボットポイント 6.毎月のピボットポイント 7.ハーモニックパターンとボリュームに基づく強力なサポートとレジスタンス。 8.銀行レベルのゾーン。 期間限定オファー:HVサポートおよびレジスタンスインジケーターは、50ドルと生涯でのみご利用いただけます。 (元の価格125 $) MQL5ブログにアクセスすると、分析例を含むすべてのプレミアム指標を見つけることができます。 ここをクリックしてください。 主な機能 ハーモニックおよびボリュームアルゴリズムに基づく強力なサポートおよびレジスタンスゾーン。 ハーモニックおよびボリュームアルゴリズムに基づく強気および弱気のプルバックゾーン。  市場構造スクリーナー 毎日、毎週、毎月のピボットポイント。 ドキュメント すべてのサポートおよび
現在33%オフ 初心者にもエキスパートトレーダーにも最適なソリューション このインジケーターは独自の機能と新しい公式を多数内蔵しており、ユニークで高品質かつ手頃な取引ツールです。このアップデートでは、2つの時間枠ゾーンを表示できるようになります。より長いTFだけでなく、チャートTFとより長いTF(ネストゾーンを表示)の両方を表示できます。すべてのSupply Demandトレーダーの皆さんのお気に召すはずです。:) 重要情報の公開 Advanced Supply Demandの可能性を最大化するには、 https://www.mql5.com/ja/blogs/post/720245 にアクセスしてください。   エントリーまたはターゲットの正確なトリガーポイントを正確に特定できれば取引がどのように改善されるか想像してみてください。新しい基盤となるアルゴリズムに基づいて構築されているため、買い手と売り手の間の潜在的な不均衡をさらに簡単に特定できます。これは、最も強い需要と供給のゾーンと、過去のパフォーマンス(古いゾーンを表示)がグラフィカルに表現されるためです。これらの機能は、最適な
Easy Buy Sell is a market indicator for opening and closing positions. It becomes easy to track market entries with alerts. It indicates trend reversal points when a price reaches extreme values ​​and the most favorable time to enter the market. it is as effective as a Fibonacci to find a level but it uses different tools such as an algorithm based on ATR indicators and Stochastic Oscillator. You can modify these two parameters as you wish to adapt the settings to the desired period. It cannot
TPSproTrend PRO は、市場が実際に方向転換する瞬間を識別し、動きの開始時にエントリー ポイントを形成します。 価格が動き始めた直後に市場に参入し、すでに動き出した後に参入してはいけません。 インジケーター   シグナルを再描画せず、エントリーポイント、ストップロス、テイクプロフィットを自動的に表示するため、取引が明確かつ視覚的かつ構造化されます。 説明書 RUS   -   MT4 バージョン 主な利点 再描画のない信号。 すべての信号は固定です。 矢印が表示された場合 -     もう変化したり消えたりすることはありません。 誤ったシグナルのリスクなしに、安定したデータに基づいて取引の決定を下すことができます。 既製の買い/売りエントリーポイント このインジケーターは、取引を開始するのに最適なタイミングを自動的に決定し、チャート上に矢印で表示します。 推測や主観的な分析は不要。明確なシグナルだけです。 自動ストップロスとテイクプロフィットゾーン 信号の直後に次のものが表示されます: エントリーポイント リスク制限ゾーン(ストップロス) 利益確定ゾーン これにより、
Market Structure Order Block Dashboard MT5 Market Structure Order Block Dashboard MT5 は、MetaTrader 5 用のインジケーターで、 マーケットストラクチャー(市場構造) と ICT / Smart Money コンセプトの分析を自動化するツールです。 このインジケーターは ポジションの発注や管理は一切行いません 。 いわゆる 自動売買ロボットではなく、視覚的な分析ツール です。 インジケーターが表示する内容 本インジケーターはチャートをスキャンし、次のような重要情報をハイライト表示します。 マーケットストラクチャー:主要なスイング、高値・安値(HH, HL, LH, LL) 構造のブレイク:Break of Structure (BOS) と Change of Character (ChoCH) 買い側(demand)・売り側(supply)の Order Block(オーダーブロック)、強さの目安付き 有効性が残っている Fair Value Gaps (FVG) 流動性ゾーン(equa
Quantum Trend Sniper
Bogdan Ion Puscasu
4.74 (53)
ご紹介   クォンタム トレンド スナイパー インジケーターは 、トレンド反転を特定して取引する方法を変革する画期的な MQL5 インジケーターです。 13年以上の取引経験を持つ経験豊富なトレーダーのチームによって開発されました。     クォンタムトレンドスナイパーインジケーター   は、非常に高い精度でトレンドの反転を識別する革新的な方法で、あなたのトレーディングの旅を新たな高みに押し上げるように設計されています。 ***Quantum Trend Sniper Indicatorを購入すると、Quantum Breakout Indicatorを無料で入手できます!*** クォンタム ブレイクアウト インジケーターは、トレンドの反転を特定するとアラートを発し、矢印を示し、3 つのテイクプロフィットレベルを提案します。 初心者トレーダーにもプロのトレーダーにも適しています。 量子EAチャネル:       ここをクリック MT4のバージョン:       ここをクリック 推奨事項: 期間:すべての時間枠。最良の結果を得るには、M15、M30、H1 のタイムフ
TrendLine PRO MT5
Evgenii Aksenov
4.67 (33)
The Trend Line PRO indicator is an independent trading strategy. It shows the trend change, the entry point to the transaction, as well as automatically calculates three levels of Take Profit and Stop Loss protection. Trend Line PRO is perfect for all Meta Trader symbols: currencies, metals, cryptocurrencies, stocks and indices. The indicator is used in trading on real accounts, which confirms the reliability of the strategy. Robots using   Trend Line PRO   and real Signals can be found here: 
作者のその他のプロダクト
BS Painel Trade
Bruno Gomes Falcao Seixas
5 (2)
BS Trade Panel: Revolutionize Your Trading Approach Introducing the BS Trade Panel , the ultimate solution for traders seeking efficiency, speed, and accuracy in their market operations. Crafted with cutting-edge technology, our panel is designed to simplify your trading, making it more intuitive, swift, and effective. Innovative Features: Quick Orders with Shortcut Keys: Execute market orders or pending orders swiftly using configurable shortcut keys. Perfect for traders who need speed when ent
FREE
BS MA Color
Bruno Gomes Falcao Seixas
Este indicador de Média Móvel Personalizada permite aos traders visualizar a tendência do mercado utilizando diferentes métodos de cálculo e aplicação a várias séries de preços. O indicador é flexível e pode ser configurado para se adaptar a várias estratégias de trading, oferecendo suporte aos métodos de média móvel mais populares, incluindo Média Móvel Simples (SMA), Média Móvel Exponencial (EMA), Média Móvel Ponderada Linearmente (LWMA) e Média Móvel Suavizada (SMMA). Funcionalidades: Seleção
FREE
BS Vwap 5 Bands
Bruno Gomes Falcao Seixas
The BS Vwap 5 Bands indicator is an advanced tool that integrates price and volume data, providing a comprehensive view of market dynamics. Designed with a focus on performance and tested under real trading conditions, this indicator aims to deliver valuable insights to traders. Its innovative approach combines VWAP with five distinct bands, revealing whether the price is aligned with the "fair price" and indicating overbought or oversold conditions. Additionally, the indicator offers visual cus
フィルタ:
レビューなし
レビューに返信