ImportantZoneResSup
- インディケータ
- バージョン: 1.21
- アップデート済み: 21 11月 2021
- アクティベーション: 5

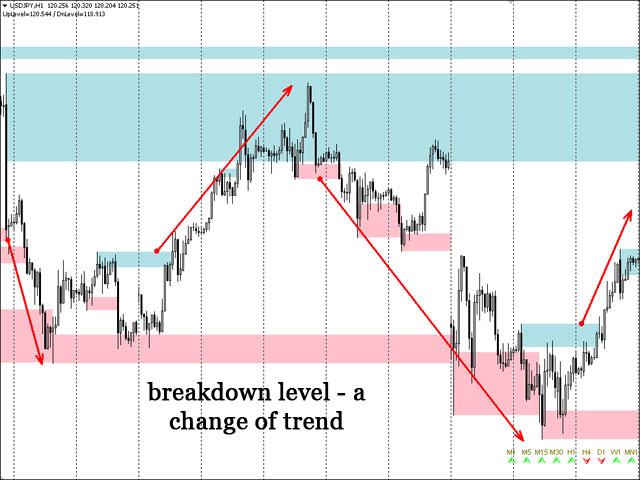
The main rule of the profitable trading is opening trades in the direction of a trend. You can define the current trend using fractal analysis.
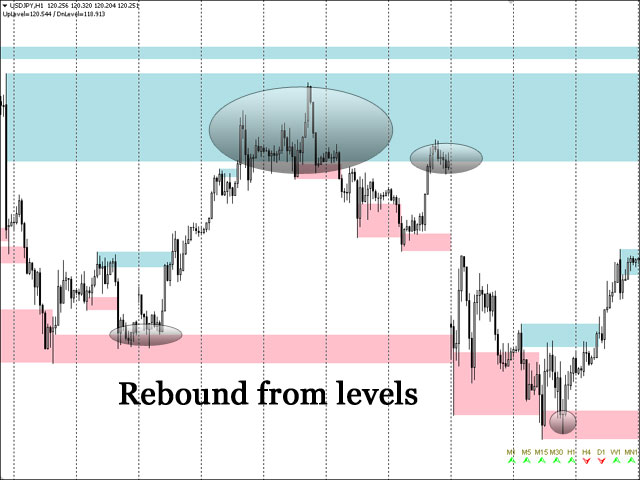
The Important Zone ResSup indicator displays important price support and resistance levels on the chart. The breakthrough or bounce from those levels shows further price direction.
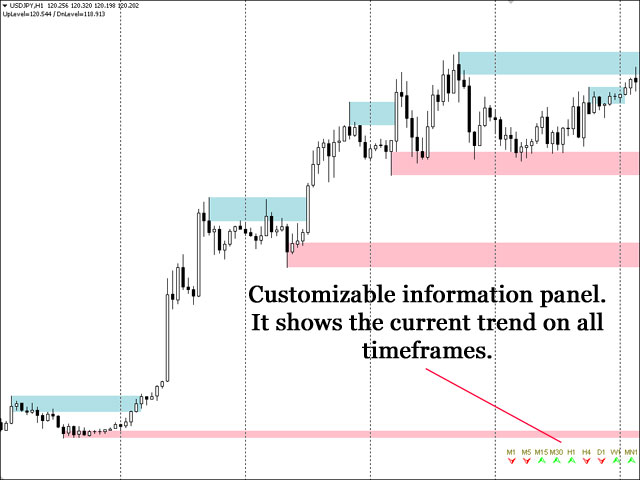
The data panel allows you to track the current trends on all timeframes. The current timeframe's important level values are shown in the comments.
The indicator can be useful for traders working by levels. It can also be a part of any trading system.
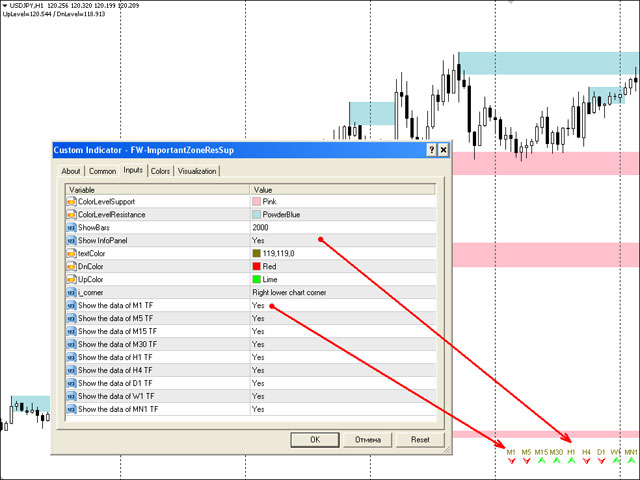
Parameters:
- ColorLevelSupport - support level color;
- ColorLevelResistance - resistance level color;
- ShowBars - depth of the indicator history in bars;
- ShowInfoPanel - (YES) - display informational panel;
- textColor, DnColor, UpColor - informational panel colors;
- i_corner - corner of informational panel position;
- use_M1 - use_MN1 - (YES) - display timeframe information.