TrendFinder RSI
- インディケータ
-
Jose Ramon Miranda Ramos
 CEO and Chief Trader at Mandamus Investments
Forex Mandamus Services Inc DBA Mandamus Investments は、ニューヨーク市の中心部にある民間貿易会社および金融出版社です。
私たちは、23 か国の大規模かつ多様な会員に金融教育と分析サービスを提供しています。
経験:
外国為替市場で10年以上働いています
株式および先物市場での 5 年以上の経験。
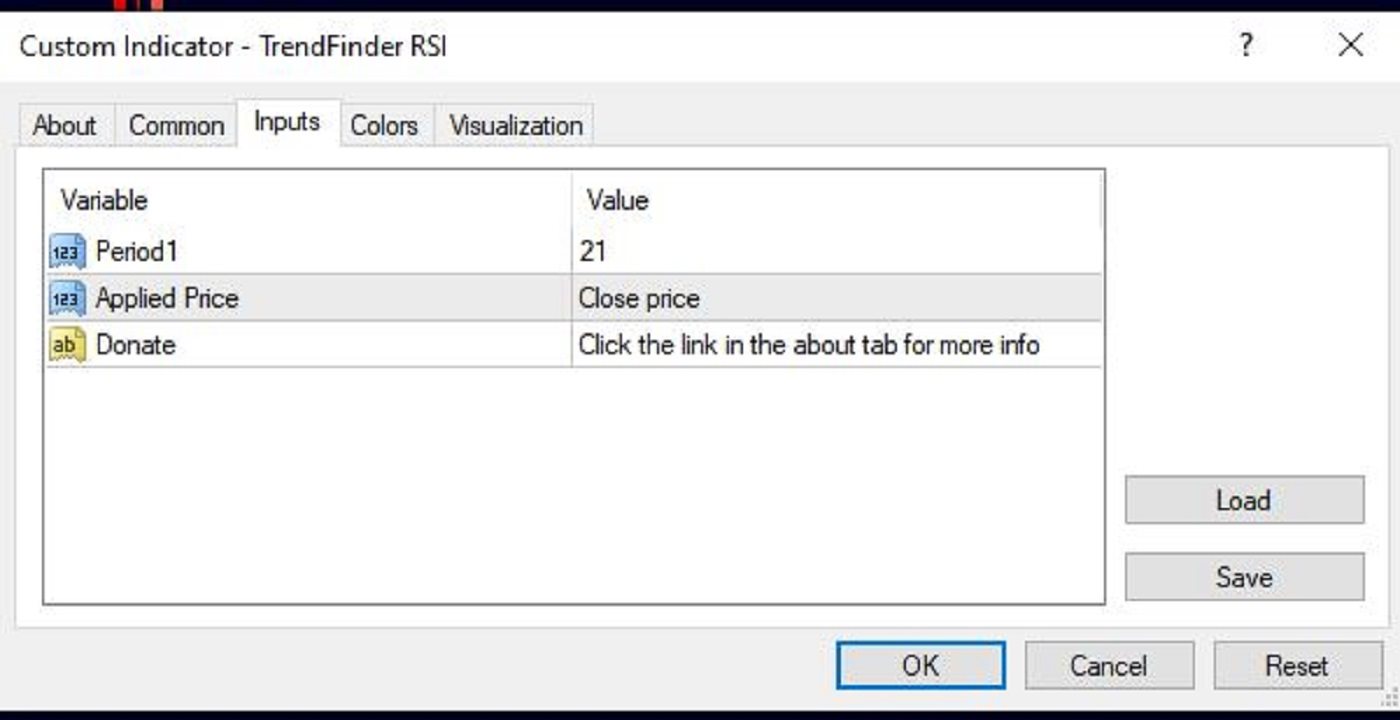
暗号通貨市場での 3 年以上の経験 - バージョン: 1.0
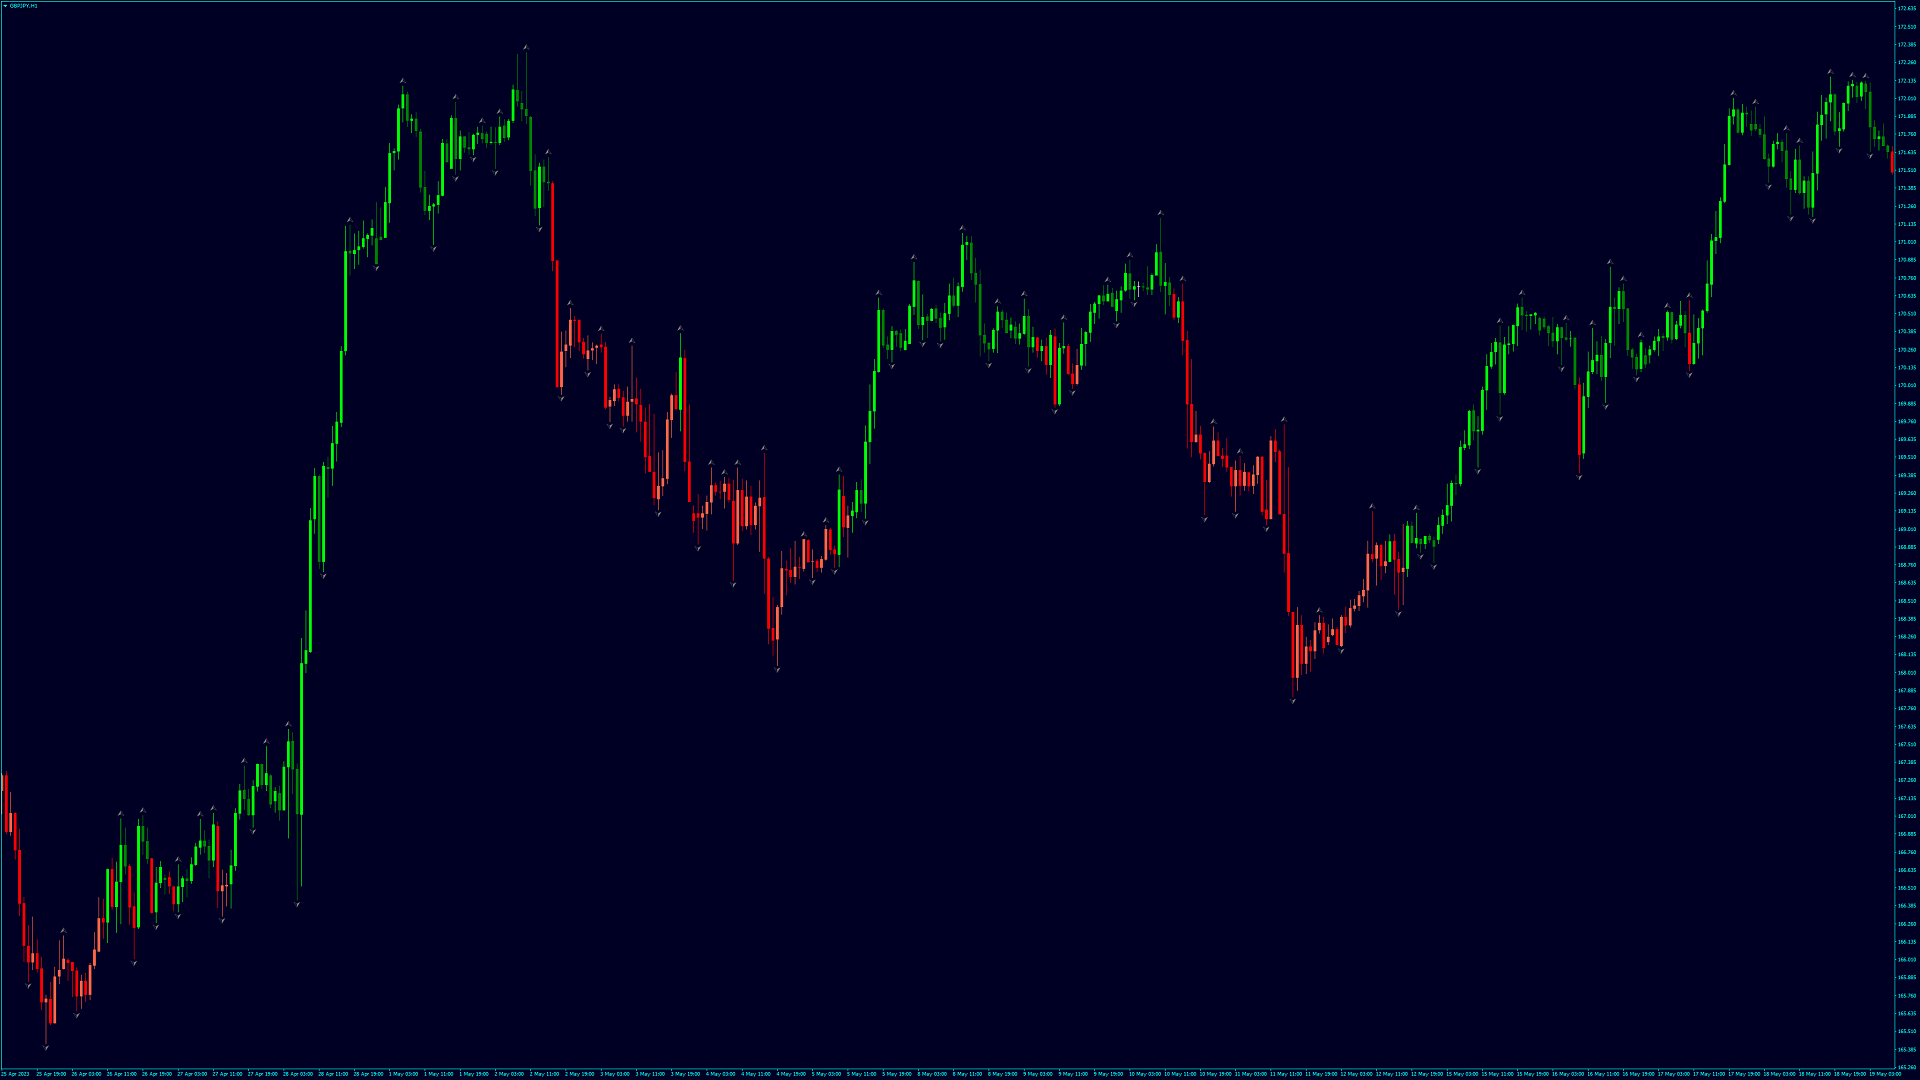
TrendFinder RSI are Colored candlesticks showing the trend based on The Relative Strength Index (RSI)
- This indicator will give you the color change on the next bar on the confirmation candle and will never repaint
- TrendFinder RSI is optimize to trade on any market and to be used trending and None trending markets.
- For best results use this indicator as an extra tools after you have completed your regular analysis and use it for alerts based on such analysis.