YouTubeにあるマーケットチュートリアルビデオをご覧ください
ロボットや指標を購入する
仮想ホスティングで
EAを実行
EAを実行
ロボットや指標を購入前にテストする
マーケットで収入を得る
販売のためにプロダクトをプレゼンテーションする方法
MetaTrader 5のためのテクニカル指標 - 60

The indicator shows the upper, middle and lower price limits for a certain period of time. Also, two Moving Averages (MAs) are displayed.
Parameters
CTType : corridor basis. _Hour : hours, _Day : days, _Bars : bars CTPrice : price type, by bars. OpenClose : Open/Close prices, HighLow : High/Low prices CTShift : corridor shift CTNum : how much to consider for building a corridor, min 2 CTPeriodFast : Fast period, min 2 CTShiftFast : Fast MA shift CTMethodFast : Fast averaging method CTPeriodSlow

This indicator is designed to help traders find the market entry and exit points. The indicator generates signals in the form of arrows, which is a simple and intuitive for use in trading. In spite of apparent simplicity of the indicator, it has complicated analytic algorithms which determine entry and exit points. Its operation is based on moving averages, RSI, candlestick patterns, as well as certain original developments. Open a Buy position when an upward arrow appears, and a Sell position w
The AirShip indicator can help you to confirm the trend. The red dots mean uptrend, and the green dots mean downtrend. The AirShip indicator provides open and close positions signals when reaching overbought or oversold levels. It has a smart algorithm that detects the trend changes. If the trend reached the end of phase, the yellow dots will send you the notification. The AirShip indicator not only draw the red trend lines and the yellow trend lines using a multicriteria strength engine, but al

Do you need to check support and resistance lines? Do you need to find them really fast and automatically? Do you want to set your own settings how to find them? Then this indicator is your right choice! Indicator Lines is developed for finding support and resistance lines on chart. It does its job quickly and fully automatically. Main principle of algorithm is to get all extremes on chart (according to "Density" parameter). Then indicator tries to find minimally 3 points (according to "Minimal

I want to present to you my solution in the implementation of automatic drawing of Fibo levels on the whole trend and the last trend leg. The logic of the indicator is based on the principle of swings, and when indicator gets a signal for a trend direction change, the previous key point before reversing is considered the start point of the indicator's drawing. When you test the indicator, note that changing the direction of the whole trend leg of Fibonacci often leads to a reversal of the trend.

マルチオシレーター は、マルチ通貨およびマルチタイムフレーム取引のための究極のスイスアーミーナイフです。単一のチャートに多くの通貨ペアおよび/またはタイムフレームの目的のオシレーターをプロットします。市場のスクリーニングツールとして、または洗練されたマルチタイムフレームインジケーターとして、統計的裁定取引に使用できます。 [ インストールガイド | 更新ガイド | トラブルシューティング | よくある質問 | すべての製品 ] 簡単な解釈と構成 16個の既知のインジケータをサポート チャートには最大12通貨ペアを表示できます また、単一の機器の複数のタイムフレームを表示できます 入力でシンボルと時間枠をカスタマイズ可能 カスタマイズ可能なオシレーターインジケーター設定 カスタマイズ可能な色とサイズ 幅広い市場の見通しを提供するために、異なるオシレーターを使用して、干渉なしで同じチャートにインジケーターを何度もロードできます。このインジケーターは、次のオシレーターをサポートしています。 RSI CCI ADX ATR MACD オスマ デマーカー 確率的 勢い 強制インデックス マネー

LevelPAttern MT5 is a technical indicator based on the daily levels and Price Action patterns. The indicator is based on the standard ZigZag indicator + reversal candlestick pattens, such as Star, Hammer (also knows as Pin bar), Engulfing and others. The indicator generates audio and text notifications when a pattern is formed and a level is touched. It also supports sending email and push notifications.
Indicator operation features It is suitable for working with any CFD and FOREX trading inst
The indicator is designed to calculate the correlation between major pairs and display cross-pair of overbought or oversold labels on the price chart.
The idea is that strong divergences of major pairs lead to an exit from the "equilibrium" of the corresponding cross pairs. With sufficiently large divergences, which are displayed by the indicator, the cross-pair is usually corrected by entering the "equilibrium". For example: when working on EURAUD pair, the difference for the period specified
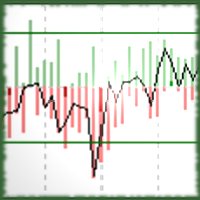
The Signal Noise Indicator is a non-parameterized oscillator generated by high, low and close noises.
Input Period: Reference period of the Low Pass Filter, used for the signal detection.
Values High Noise: maximum high noise; Power High Noise: high signal strength, showed when the smallest noise occurs in the same signal direction; Low Noise: maximum low noise; Power Low Noise: low signal strength, showed when the smallest noise occurs in the same signal direction; Close Noise: noise value at
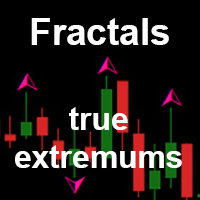
Fractals true extremums is a modification of the Fractals indicator. The indicator sorts out weak fractals leaving only the ones that are significant for searching the chart extreme points. The sorting is performed during fractals construction. The old data does not change. Only the last value can change (just like in the standard Fractals indicator). The indicator can show lines indicating Fractals from higher timeframes.
The product can be used by EAs for comparing price extreme points on char

Gannスクエアインジケーターは、W.D. Gannによって執筆された「市場予測のための数学的な式」の記事に基づく強力な市場分析ツールです。このツールは、解析に数学的な概念を応用し、Gann理論に基づいています。それは、144、90、52のスクエアや9のスクエアなど、Gannの関連テクニックの要素を取り入れています。さらに、の方法を組み込んでおり、9のスクエアとその関連性についてのチャネルやスターパターンに焦点を当てています。 ユーザーマニュアルと使用方法: このインジケーターを使用する前に、ユーザーマニュアルを読んで疑問点を解決するためにお問い合わせいただくことをお勧めします。ユーザーマニュアルの完全版は、当社のウェブサイトで入手できます。 MT5の完全版は購入できますし、MT4の無料版も試すことができます。両方のバージョンへのリンクを提供していますので、ご利用ください。 主な機能と機能: Gannスクエアインジケーターは、市場分析のための完全なツールセットを提供し、幾何学的な概念とGann理論に基づいて的確な判断を行う手助けをします。以下に主な機能を示します。 9のスクエアの分析:
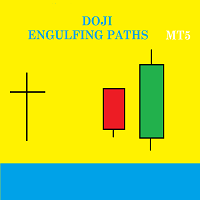
Doji Engulfing Paths enables to get signals and data about the doji and the engulfing patterns on charts. It makes it possible to get opportunities from trends, and to follow the directional moves to get some profits on the forex and stocks markets. It is a good advantage to take all the appearing opportunities with reversal signals and direct signals in order to obtain some profits on the forex market.
System features With fast execution, it allows to register directly the information about th
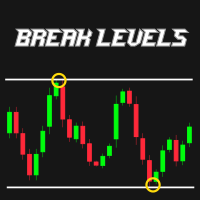
R747 BreakLevels is smart indicator that automatically detects Support and Resistance levels on actual market trend. Strength of levels can be easily adjusted by changing parameter LevelsStrength in range of 2 (weak levels) and 50 (strong levels). This indicator is accessible in EA via iCustom functions and is fully customizable by user. There is possibility to send Push notifications and Alerts of newly found levels.
Follow this link to get all detailed information: >> LINK <<
Features Adjust

What was IFM created for Our goal in creating IFM was to provide the tool to manage your Fibonacci Retrecements and other Fibo tools in MetaTrader 5. This indicator allows you to edit all of the settings without getting into it by right click on the tool. That is faster and easiest way to manage objects on your chart.
Inputs Font size - change font size of texts on the IFM panel. This is necessary, because some of users change font size in Windows settings Description of the Fibo levels (variab

Открытый интерес (количество открытых позиций) – это количество активных контрактов по фьючерсу. Обычно анализируют не сам открытый интерес, а его изменение. Часто используется трейдерами в дополнение к объему для более полного понимания рыночной ситуации. MetaTrader транслирует открытый интерес со срочного рынка, но не сохраняет его в истории. Поэтому пока единственный вариант, на котором строится большинство подобных индикаторов – это сохранение истории в файл с его последующим воспроизведение

Order Book, known also as Market Book, market depth, Level 2, - is a dynamically updated table with current volumes of orders to buy and to sell specific financial instument at price levels near Bid and Ask. MetaTrader 5 provides the means for receiving market book from your broker, but in real time only, without access to its history. The indicator OrderBook Cumulative Indicator accumulates market book data online and visualizes them on the chart. In addition, the indicator can show the market
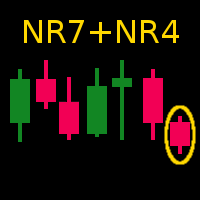
This indicator shows the narrowest bar within the past seven bars, which is known as NR7 in the literature. It will also show the NR4 bar.
The range is variable; thus, you can show any two ranges, e.g. NR7/NR4, NR11/NR6, etc. For the description of this indicator, I will continue to use the default of seven (7) and four (4). If an NR7 bar also happens to be an Inside Bar, it gives a stronger signal. Thus NR7IB are denoted in another color. Sometimes this is known as NR7ID (for Inside Day). I kep
This indicator scanning thorough the history and drawing horizontal rays on all bars untested lows and highs. Fresh supply/demand zones and support/resistance levels will be marked down. It allows to be sure that certain levels is fresh and has not been tested yet. Usually after strong departure price is not retesting base immediately and leaving unfilled orders. There is no inputs, so indicator is ready to go.
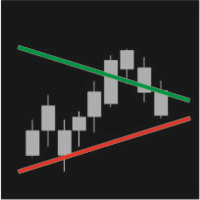
IntradayTrack displays on the price chart daily support and resistance lines based on average volatility instruments for a certain period. In the indicator, it is possible to tilt the line to a certain angle both at the beginning of the trading day and at the end of the trading period.
Parameters Track period - the period of drawing lines (day, week, month) Avg price range - number of days the average volatility is considered for Start value (Avg%) - distance between the lines at the beginning

Time And Sales Layout indicator shows traded buy and sell volumes right on the chart. It provides a graphical representation of most important events in the time and sales table. The indicator downloads and processes a history of real trade ticks. Depending from selected depth of history, the process may take quite some time. During history processing the indicator displays a comment with progress percentage. When the history is processed, the indicator starts analyzing ticks in real time. The l
Advanced MA Crossover Alert System The FX AlgoTrader Advanced Moving Average Crossover Alert System is a highly configurable MT5 indicator which incorporates a fully automated alert system for monitoring two trader defined moving averages. The indicator is designed to alert traders when two moving averages crossover. The trader has a wide range of control over how the MA Crossover alerts are generated which is detailed below. Key Features Automatic display of trader defined fast and slow movin

Панель предназначена для быстрого визуального нахождения и отображения пин-баров по всем периодам и на любых выбранных валютных парах одновременно. Цвет сигнальных кнопок, указывает на направление пин-бара. По клику на сигнальную кнопку, осуществляется открытие графика с данным паттерном. Отключить не используемые периоды, можно кликом по его заголовку. Имеется поиск в истории (по предыдущим барам). Прокрутка (scrolling) панели, осуществляется клавишами "UP" "DOWN" на клавиатуре. Имеется Push-ув
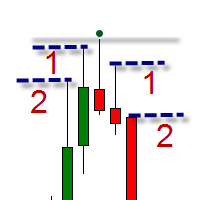
The indicator is intended for swing trading. The indicator is able to determine the trend and important trend peaks (swing), which will be important support / resistance levels. Features Simple visual displaying of 3 types of swings: Minor swings - do not affect the trend, but only on the movement within the trend Normal swings - can change the direction of the trend Strong swings - have a double confirmation of the importance of the level Visual displaying of the trend reversal Minimum of se

If there is only one MT5 indicator you ever buy for trading forex – this has to be it.
Your success as a forex trader depends on being able to identify when a currency or currency pair is oversold or overbought. If it is strong or weak. It is this concept which lies at the heart of forex trading. Without the Quantum Currency Strength indicator, it is almost impossible. There are simply too many currencies and too many pairs to do this quickly and easily yourself. You need help!
The Quantum Cur

Have you ever wondered why so many Forex traders get trapped in weak positions on the wrong side of the market? One of the easiest ways the market makers do this, is by using volatility. A currency pair moves suddenly, often on a news release or economic data. Traders jump in, expecting some quick and easy profits, but the move suddenly moves in the opposite direction. This happens in all timeframes, and in all currency pairs. The candle or bar closes, with a wide spread, but then reverses sharp

If you've been trading for any time, you will almost certainly have come across the concept of support and resistance. This powerful and simple concept lies at the heart of technical analysis. It forms the cornerstone of price action trading. Strange to consider therefore, that such a key component of the traders chart has largely been ignored. Most Forex traders still draw their lines manually, leading to a crude interpretation of these key levels. Even those companies who have developed a trad

One of the oldest maxims in trading is ‘let the trend be your friend’. You must have come across it! This is easier said than done! First, you have to identify one, then you have to stay in – not easy. Staying in a trend to maximise your profits is extremely difficult. In addition, how do you know when a trend has started? It’s very easy to look back and identify the trend. Not so easy at the live edge of the market. The Quantum Trends indicator is the ‘sister’ indicator to the Quantum Trend Mon

Of all the four principle capital markets, the world of foreign exchange trading is the most complex and most difficult to master, unless of course you have the right tools! The reason for this complexity is not hard to understand. First currencies are traded in pairs. Each position is a judgment of the forces driving two independent markets. If the GBP/USD for example is bullish, is this being driven by strength in the pound, or weakness in the US dollar. Imagine if we had to do the same thing

We don’t want to become boring, but the US dollar is the most important currency for all traders, and not just in Forex. Trading without a clear view of the US dollar is like driving in fog. Sooner or later you are going to crash – it’s just a question of when. That’s why at Quantum we have developed two US dollar indices. The first is the Quantum DXY, and the second is the Quantum USDX. So what’s the difference? Well, the reason we created the Quantum USDX is that many Forex traders believe tha

For aspiring price action traders, reading a candle chart at speed can be learnt, but is a skill which takes years to perfect. For lesser mortals, help is required, and this is where the Quantum Dynamic Price Pivots indicator steps in to help. As a leading indicator based purely on price action, the indicator delivers simple clear signals in abundance, highlighting potential reversals with clinical efficiency. Just like volume and price, pivots are another ‘predictive’ indicator, and a leading i

Many Forex traders assume there is no volume in the foreign exchange market. And they would be correct. There is no central exchange, not yet anyway. And even if there were, what would it report? What there is however is activity, and this is captured as tick volume. After all, volume is simply displaying activity, the buyers and sellers in the market. So for volume read activity, and for activity read volume – simple. The MT5 platform delivers tick data which the Quantum Tick Volumes indicator

Currency pairs never go up or down in a straight line. They rise and fall constantly, creating pullbacks and reversals. And with each rise and fall, so your emotions rise and fall. Hope, then fear, then hope. This is when the market will try to frighten you out of a strong position. It is when you are most vulnerable. But not if you have the Quantum Trend Monitor. And here, you even get two indicators for the price of one! The Quantum Trend Monitor has been designed to absorb these temporary pau

Trading the currency markets is a complex business, not least since we are dealing with pairs of currencies, and by inference, pairs of economies. All economies around the world are interlinked, and reflected in the constant ebb and flow of currency strength and weakness. The problem for us as traders is monitoring so many pairs simultaneously, since every pair does not move independently, but reflects the interrelated nature of this market.
The Quantum Currency Heatmap delivers the information

The words powerful, unique and game changing are ones that are often over used when applied to trading indicators, but for the MT5 Quantum Camarilla levels indicator, they truly describe this new and exciting indicator completely.
Why? Because the indicator has something to offer every trader, from the systematic to the discretionary and from swing trading to breakout trading. And it’s not an indicator which is simply used for entries. The Camarilla indicator delivers in all areas, from getting

Renko is a well-known Japanese charting technique that removes time from the chart. Instead of drawing bars in constant intervals (time) as a normal chart would, a Renko chart does so only when price moves beyond a predefined amount.
In a Renko chart, a bar is created when price exceeds the previous bar’s high or low by a predefined amount or what we call the Box Size. The result is a chart with equally sized bars running up or down in 45 degree angles. Such a chart offers the following advant
Probability Indicator displays volatility bands on the price chart and calculates probabilities of price exceeding specified levels for the next bar, taking trend into account. It does that by performing a statistical analysis of the completed bars in the chart's history, which may include years of data. The volatility bands differ from Bollinger bands in the calculation of standard deviation from the simple moving average, resulting in bands that envelop the range of price swings in a channel t

The indicator measures and displays the difference in the number of "Bid" and "Ask" prices changes in the form of digital, analog and graphic indicators. Designed for market research and for determine the moments of position closing during scalping trade with H1 or less timeframe. Use with bigger timeframe is not prohibited, but it is not informative because of a large number of accumulated values. Theory
"Bid" and "Ask" prices do not change simultaneously for most symbols. Often you can see ho

The indicator identifies divergences between chart and RSI, with the possibility of confirmation by stochastics or MACD. A divergence line with an arrow appears on the chart when divergence is detected after the current candle has expired. There are various filter parameters that increase the accuracy of the signals. To identify a divergence, point A must be set in the RSI, then point B Value must be edited, which sets the difference between point A and point B. The indicator can be used for tim

The indicator Universal Main Window MT5 works according to your rules. It is sufficient to introduce a formula, along which the line of the indicator will be drawn.
This indicator is intended for use in the main chart window.
All indicators of the series Universal :
Main window Separate window Free MT4 Universal Main Window Free MT5 Universal Main Window Free MT5 MT4 Universal Separate Window Free MT5 Universal Separate Window Free MT5 Full MT4 Universal Main Window MT5 Universal Main Window M

The indicator Universal Separate Window MT5 works according to your rules. It is sufficient to introduce a formula, along which the line of the indicator will be drawn.
This indicator is intended for use in the separate chart window.
All indicators of the series Universal :
Main window Separate window Free MT4 Universal Main Window Free MT5 Universal Main Window Free MT5 MT4 Universal Separate Window Free MT5 Universal Separate Window Free MT5 Full MT4 Universal Main Window MT5 Universal Main
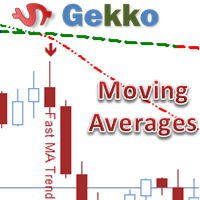
his is Gekko's Moving Averages indicator. It extends the use of the famous moving averages and calculates strong entry and exit signals using Price versus a Fast Moving Average versus a Slow Moving Average. You can set it up in many different ways, eg: price crossing, moving averages crossing, moving averages trend, among others.
Inputs Number of Bars to Plot Indicator: number of historical bars to plot the indicator, keep it low for better performance; FAST Moving Average Details: settings fo

—— 进入本指标前,请谨记:『 不易,变易 』。拔开数理统计的枝叶,变化是不变的定理才是本指标的由来和内涵思想。本指标只应指明变化到不变之间的契机。 本指标——阴阳线指标(YiiYnn)由一条粗蓝色实线和一条细烟绿色虚线构成,粗实线叫阳线(Ynn),作为主线,细虚线叫阴线(Yii),作为辅线。本指标不同DeMarks去搜索哪个周期的最高最低,也不同Stoch那样告诉你超买超卖超过后缩小再等超买超卖直至资金的尽头。本指标是分析价格减速动态均值线的(偏)相关性及自相关性,并采用标准差的方法进行滤波以求趋势示意更明朗。所以,本指标有以下特性: 指标依据波浪理论,有二阶线性插值模拟组合多条均线(开收高低)构建波浪动力并分析它们各自相关性,所以将对趋势有很好的 预测性 ——与MACD、ATR等相比。它并非只让我们看到趋势的尾巴,请参考最后一张示例图; 指标采用简单的方差进行差相过滤,在兼顾计算性能的同时让盘整阶段的指示更明朗; 阳线与阴线之间是偏相关差相,具有阴消阳长相互激励、抵消的特点,因此命名; 本指标中判定的趋势与常人所称『趋势』不同,本指标中的趋势包括: 上涨、下跌和横盘 。不要忽略横盘

Rush Point Histogram Continuity force indicator. Operation: After a breach of support or resistance of an asset, the trader can understand by reading the histogram if such a move tends to continue, thus filtering false breaks or short breaks without trend formation. Through a simple, level-based reading, the trader can make a decision based on the histogram, where: Below 21: No trend formation 21 to 34: Weak trend 34 to 55: Strong Trend 55 to 89: Strong tendency Suggested Reading: Observed disru

Rush Point System
It is a detector indicator of breakage of support and resistance with continuity force.
Operation:
The Rush Point System detects in real time when a buying or buying force exceeds the spread limits in order to consume large quantities of lots placed in the book, which made price barriers - also called support / resistance.
At the very moment of the break, the indicator will show in the current candle which force is acting, plotting in the green color to signal purchasing po

Tarzan この指標は、相対力指数の読み取りに基づいています。
速い線は、シニア期間からのインデックスの読み取り値です。たとえば、H4期間からのインジケーターの読み取り値が設定され、インジケーターがM15に設定されている場合、シニア期間の1つのバーに収まるバーの数だけ再描画されます。 、再描画はM15期間で16小節になります。
スローラインは、平滑化された移動平均インデックスです。
インディケータは、設定に応じて、さまざまなタイプのシグナルを使用して取引の決定を行います。 インジケーター設定の説明: TimeFrame-インジケーターが計算されるチャート期間。 RSI_period-インデックスを計算するための平均期間。 RSI_applied-中古価格。 MA_period-インデックス平滑化期間。 iMA_method-アンチエイリアシングメソッド アラート-カスタムデータを含むダイアログボックスを有効にします Text_BUY-買いシグナルのカスタムテキスト Text_SELL-売りシグナルのカスタムテキスト Send_Mail- [メール]タブの設定ウィンドウで指定された

WavesTrends このオシレーターは、価格が一定の範囲内で変動する場合に使用される市場指標の1つです。オシレーターには独自の境界(上限と下限)があり、近づくと、市場参加者は売られ過ぎまたは買われ過ぎの市場に関する情報を受け取ります。インディケータは、特定のボラティリティの範囲内で価格変動を登録します。 オシレーターシグナルが価格チャートで確認されると、取引の可能性が高まります。この方向は、オシレーターのいわゆる上部ゾーンと下部ゾーンに反映されます。楽器は買われ過ぎと売られ過ぎの状態に基づいています。これらのパラメータを決定するために、特別なレベルが設定されます。 発振器は本質的に二次的です。これは、主要なツールとしてではなく、分析のための補助的なツールと見なす必要があります。主なパラメータは常に実際の価格変動です。 インジケーター設定の説明: Waves_Period-インジケーターを計算するための主要な期間 Trends_Period-インジケーターを計算するための2次期間 Width_Period-線の間の幅を計算するための期間 ARROW_SHIFT-信号ポイントの垂直

Slick 指標は、取引決定を行うためのアラート信号を備えた二重アイロン相対力指数(RSI)です。インジケーターは価格に従い、その値は0〜100の範囲です。インジケーターの範囲は通常のRSIインジケーターの範囲と同じです。 インジケーター設定の説明: Period_1-インデックスを計算するための期間 Period_2-インジケーターの平滑化の主要な期間 Period_3-インジケータースムージングの2次期間 MAMethod-アンチエイリアシングメソッド AppliedPrice-価格定数 MAX_bound-上位信号ゾーンのレベル MIN_bound-下位信号ゾーンのレベル アラート-カスタムデータを含むダイアログボックスを有効にします Text_BUY-買いシグナルのカスタムテキスト Text_SELL-売りシグナルのカスタムテキスト Send_Mail- [メール]タブの設定ウィンドウで指定されたアドレスにメールを送信します 件名-メールヘッダー Send_Notification- [通知]タブの設定ウィンドウでMetaQuotesIDが指定されているモバイル端末に通知を

Delta EMA is a momentum indicator based on the changes of closing price from one bar to the next. It displays a histogram of the exponential moving average of those changes, showing magnitude and direction of trend. Positive delta values are displayed as green bars, and negative delta values are displayed as red bars. The transition from negative to positive delta, or from positive to negative delta, indicates trend reversal. Transition bars that exceed a user specified value are displayed in br

Панель предназначена для быстрого визуального нахождения и отображения внутренних баров по всем периодам и на любых выбранных валютных парах одновременно. Цвет сигнальных кнопок, указывает на направление паттерна. По клику на сигнальную кнопку, осуществляется открытие графика с данным паттерном. Отключить не используемые периоды, можно кликом по его заголовку. Имеется поиск в истории (по предыдущим барам). Прокрутка (scrolling) панели, осуществляется клавишами "UP" "DOWN" на клавиатуре. Имеется

Renko Graph 練行足グラフ 現在の価格の場所にあるメインチャートウィンドウの練行足インジケーター。 インディケータは、通常の相場チャートの背景に対して、長方形(「ブリック」)の形で価格変動を表示します。設定で指定されたポイント数による価格の上昇は、前の次の長方形の上に追加することによってマークされ、下向きの動きは前の長方形の下に追加されます。 インジケーターは、主なトレンドを視覚的に識別するように設計されています。根底にあるトレンドを平均化する際に、主要なサポートとレジスタンスのレベルを特定するために使用されます。このビューでは、小さな価格変動(「ノイズ」)は考慮されていないため、非常に重要な動きに集中できます。 価格変動が指定されたしきい値レベルを超えた場合にのみ、上または下の新しい指標値がプロットされます。サイズは設定で設定され、常に同じです。たとえば、基本サイズが10ポイントで、価格が20上昇した場合、2つのインジケーター値が作成されます。 インジケーターの利点は、どのレンガでもその形成時間の長さを示すことができることです。価格が範囲内で変動し、成長せず、しきい値の

BinaryPinMt5 is an indicator developed and adapted specifically for trading short-term binary options. The indicator's algorithm, before issuing the signal, analyzes many factors, such as market volatility, searches for the PinBar pattern, calculates the probability of success when making a deal. The indicator is set in the usual way. The indicator itself consists of an information window where the name of the trading instrument is displayed, the probability of making a successful transaction,

This is Gekko's customizable version of the famous Heiken Ashi indicator. It extends the use of the famous Heiken Ashi and calculates strong entry and exit signals. Inputs Number of Bars to Plot Indicator: number of historical bars to plot the indicator, keep it low for better performance; Produce Arrow Signals: determine if the indicator will plot arrow signal for long/short; Produces Signal Only When a Bar Closes: wait for a bar to close to produce a signal (more accurate, by delayed entry

Price action is among the most popular trading concepts. A trader who knows how to use price action the right way can often improve his performance and his way of looking at charts significantly. However, there are still a lot of misunderstandings and half-truths circulating that confuse traders and set them up for failure. Using PA Trend Reversal will be possible to identify high probability exhaustion moves of a trend. Features The indicator gives alerts in real-time when the conditions are me

MultiTimeframe (MTF) Support and Resistance Indicator is use to measure last 320 bar (user input) of support and resistance of the dedicated timeframe.
User can attached this indicator to any desire timeframe. Features: User input desire timeframe (default Period H4) User input numbers of last bars (default 320 bars) User input measurement of last HH and LL (default 10 bars) Line styling and colors. MT4 Version : https://www.mql5.com/en/market/product/31984

Description
The base of this indicator is an ZigZag algorithm based on ATR and Fibo retracement. The ZigZag can be drawn like a classic ZigZag or like Arrows or needn't be drawn at all. This indicator is not redrawing in sense that the ZigZag's last shoulder is formed right after the appropriate conditions occur on the market. The shoulder doesn't change its direction afterwards (can only continue). There are some other possibilities to show advanced information in this indicator: Auto Fibo on
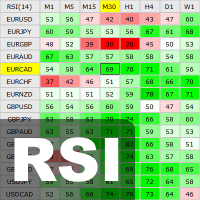
This indicator shows the current RSI values for multiple symbols and multiple timeframes and allows you to switch between timeframes and symbols with one click directly from the matrix. With this indicator, you can analyze large number of symbols across multiple timeframes and detect the strongest trends in just a few seconds.
Features Shows RSI values for multiple symbols and timeframes simultaneously. Colored cells with progressive color intensity depending on the RSI values. Ability to chang
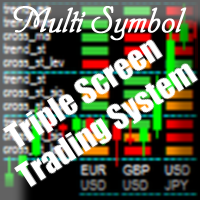
Purpose The indicator is intended for manual multi-currency trading based on the Triple Screen Strategy. It works with any symbols located in the Market Watch window of the MT5: currencies, metals, indexes, etc. The number of instruments can be limited by capacity of the МТ5's parameters. But if desired, you can create several windows with various set of instruments and parameters.
Operation Principle The indicator uses the modified Triple Screen Strategy for determining trend direction in the
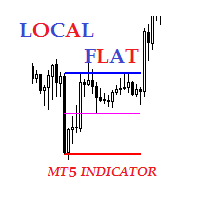
Description The indicator of local flat. The indicator allows to find local flats in the following options: Width of channels that is not more than certain number of points Width of channels that is not less than certain number of points Width of channels that is not more and not less than certain number of points The indicator displays the middle and boundaries of the channel. Attaching multiple instances of the indicator to the chart with different ranges leads to displaying a system of chann
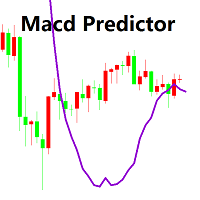
Macdのメインチャートインジケータ
1. MACDが買いから売りに変わる価格を決定することができます。逆も同様です。 これはオシレータの予測子のいとこです。 当時のポジションを知っていれば、正確な価格、現在および次の(将来の)列はMACDクロスオーバに到達する必要があります。 あなたは、現在のポジションが次のMACDクロスオーバーフォースによって助けられたりブロックされたりする前に、市場がどのくらい離れていなければならないかを見ることもできます。 プレディクタはリアルタイムで更新されるため、すべての時間枠でこれを行うことができます。
2. MACD予測変数の履歴を使って価格行動を明確に観察し、棒グラフに直接重ねることで、市場の「動圧」を決定できます。 ダイナミックな圧力とは、信号を売買する市場の反応を指します。 MACDで30分間販売していて、市場が平坦であれば、次の購入信号が簡単に大きな勝者になることがわかります! これは私がよく標準MACDで行うことですが、今は見やすいです! input: Fast EMA - period of the fast Moving Avera

Swing Points are those places on the chart where price changes direction. This is an MT5 version of my MT4 Swing Points Indicator. Found on the code base at https://www.mql5.com/en/code/15616 and in the market at https://www.mql5.com/en/market/product/22918
The beginning input parameters allow you to configure your alerts. Turn on screen alerts allows you to turn on and off screen alerts. True is on, false is off. Turn on push to phone alerts allows you to turn on and off push to phone aler

This indicator uses volume and volatility information to indicate the trend or to indicate the market reversion/correction. There are 2 indicators in one. The indicator works in two styles: values per candle and accumulated values. Using the volume and volatility information, when well adjusted, this indicator has a good probability to indicate the right direction, both in lower (M1, M2, M5) and higher (M15, M30) timeframes.
Strategy 1: Trend indicator Indicates the operation direction. To us

Технический индикатор Angry Alligator является расширенной авторский интерпретацией индикатора от B. Williams’а. Данный индикатор имеет такие же принципы работы, что и классический индикатор Alligator и основан на тех же параметрах. Ключевым отличием и преимуществом данного индикатора заключается в том, что в нем реализован дополнительный торговой сигнал в виде ещё одной линии. Продолжая тему B. Williams’а сигнал отображает «укус» котировок индикатором - Alligator’s Bite. Дополнительный параметр
Технический индикатор Awesome Oscillator является классической реализацией торгового подхода Билла Вильямса. Индикатор имеет те же параметры что и интерпретация в МТ5 (отображает дельту между МА с периодом 5 и 34 рассчитанную по средним ценам). Ключевым отличием является графическое отображение каждого торгового сигнала, что позволяет более качественно провести анализ актива и получить звуковое оповещение о появлении сигнала. Торговые сигналы индикатора: 1. Crossed zero line : данный торговый с
Технический индикатор Bollinger Bands классически отображается двумя линиями, которые демонстрируют отклонение котировок от МА 20. Для этого используется стандартное отклонение, параметр которого собственно и задаёт динамику двум полосам. Так как индикатор отображает момент повышенной волатильности на рынке, закрытие котировок за полосами свидетельствует об импульсном направлении рынка или же выхода с длительной зоны проторговки. Таким образом, работа на пробой позволяет войти в момент отклонени

Технический индикатор широко известен читателям и поклонникам стратегии «черепах». Отображается линией по нижней/верхней точке цены за определенный интервал времени. Значение ценового канала также используют для определения зон поддержки и сопротивления. Если котировки актива прорывают и закрываются ниже/выше канала, то это является сигналом работы в сторону пробоя. Способы применения: Индикатор является самодостаточным и не требует дополнительных фильтров для начала работы. Однако для надёжност

Технический индикатор Price Channel & Bollinger Bands является комбинацией двух наиболее популярных канальных индикаторов. Данный индикатор отображает моменты пробоя как каждого канала по отдельности, так и генерирует сигналу в момент одновременного закрытия цен за линиями поддержки/сопротивления. Каждый пробой подсвечивает свечу определенным цветом, что позволяет убрать линии для более комфортной работы с графиком. В случае одновременного пробоя PC и BB, индикатор также отобразит необходимый ма

Технический индикатор Universal Oscillator является комбинацией торговых сигналов самых популярных и широко используемых осцилляторов. Индикатор представлен гистограммами, а также линиями fast и slow MA, что позволяет расширить список получаемых торговых рекомендаций и работать как по тренду, так и в боковом движении рынка. Таким образом, гистограммы позволяют определить момент пробоя ценовых значений и движение в новой фазе рынка, а линии указывают на зоны перекупленности и перепроданности. Ос
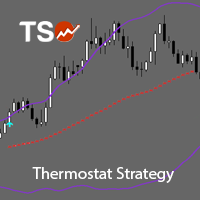
TSO Thermostat Strategy is an indicator that can adapt to the current market conditions by switching from a trend-following mode to a short-term swing mode, thus providing the best possible entry/exit signals in any situation. It is based on the Thermostat Trading Strategy as presented in the book Building Winning Trading Systems with TradeStation by G. Pruitt and J. R. Hill. Strategy The Thermostat Strategy uses different entry and exit conditions based on the current situation of the market
ボリューム入力によって可能な動きを検出したときに通知する便利なツールです。
基本的には先物です。
NO OFFER / NO DEMANDの領域を検出します。
進行中のろうそくの容積を前の容積と比較する。
ボリュームが減少している場合、現在の契約が前の契約を上回ると、ALERT!
- メインのグラフィックまたはウィンドウにロードすることができます。
- どんな一時的なものでも。
- ポップアップウィンドウで警告を表示します。ポップアップウィンドウでは、アラームのグラフが表示されます。
- パターンが検出されると、音響警報が鳴ります。
...............................................
A's Capital Line is a complex algorithm that detects 100% of the trends .
This line marks the following information: The entrance to the trend. Stop of loss. Supports and resistances. When to take Profit.
Send alerts to your cell phone through metatrader It works perfect on any instrument (stocks, forex, crypto, commodities, indices, etc). Also in any time frame to adjust to any trading style. Please see Screenshots for examples and Follow us on instagram. Image 1 Line settings are diferent
MetaTraderマーケットは自動売買ロボットとテクニカル指標を販売するための最もいい場所です。
魅力的なデザインと説明を備えたMetaTraderプラットフォーム用アプリを開発するだけでいいのです。マーケットでプロダクトをパブリッシュして何百万ものMetaTraderユーザーに提供する方法をご覧ください。
取引の機会を逃しています。
- 無料取引アプリ
- 8千を超えるシグナルをコピー
- 金融ニュースで金融マーケットを探索
新規登録
ログイン