YouTubeにあるマーケットチュートリアルビデオをご覧ください
ロボットや指標を購入する
仮想ホスティングで
EAを実行
EAを実行
ロボットや指標を購入前にテストする
マーケットで収入を得る
販売のためにプロダクトをプレゼンテーションする方法
MetaTrader 5のための新しいテクニカル指標 - 39

Simple Dispersion Zones(シンプル・ディスパージョン・ゾーンズ) は、トレーダーの日々のマーケット分析をサポートするために設計された、シンプルで使いやすく、かつ強力なインジケーターです。 直近の N 本のローソク足の高値と安値をもとに、重要なディスパージョン(分散)ゾーンを計算し、透明な赤い三角形でチャート上に表示します。これにより、重要なトレードエリアを素早く視覚的に把握できます。 トレンドチャネルの描画、レンジ相場の特定、ブレイクアウト戦略の計画など、あらゆる場面で価格の動きを明確かつ効果的に視覚化するのに役立ちます。 シンプルで直感的なインターフェース
カスタマイズ可能なパラメーター
すべての銘柄・時間足に対応
初心者から上級トレーダーまで幅広く対応 Simple Dispersion Zones を使って、チャート分析をより簡単かつ正確にしましょう。

The indicator shows your profit and loss (PnL) for the current day right on your trading chart. Anchored at the top-right corner, it displays "PnL: [amount]"—green if you’re up, red if you’re down, white if it’s zero. Every time you close a trade, it updates instantly, adding up your profits, commissions, and swaps from all buys and sells trades since midnight. No fuss, no extra charts—just real-time feedback on how your day’s going.
FREE

This indicator creates a dashboard-style visual display that shows volume and volatility data across multiple:
Trading symbols (likely different currency pairs or instruments) Timeframes (different chart periods like M5, M15, H1, etc.)
The dashboard is organized in a table format where:
Symbols are listed in rows
Timeframes are displayed in columns
Each cell contains volume and volatility data for a specific symbol/timeframe combination
Main Advantages Multi-time frame Analysis: Allows you to

Swing Detector — When You Think You Know Swings, Think Again
One of the key reasons many traders fail is their inattention to seemingly simple details they believe they’ve mastered. One such critical detail is the accurate identification of market swings (Swing Highs / Lows) on the chart. If you ask a group of traders to manually and consistently mark swing points on a chart, you'll find that more than half struggle to do it correctly . Not due to lack of knowledge, but because of mental fatigu
FREE
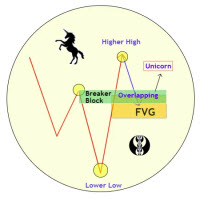
Unicorn Model ICT Indicator — Smart Trading with Precision The Unicorn Model ICT Indicator is a powerful and intelligent tool designed for traders who follow Smart Money Concepts (SMC) and Inner Circle Trader (ICT) methodologies. This indicator simplifies complex price action by visually identifying key market structures and providing high-probability trade setups. Key Features: A Bullish Unicorn Pattern A Lower Low (LL), followed by a Higher High (HH) A Fair Value Gap (FVG), overlapping the est

Identify key support/resistance levels and potential breakouts with the HighestOpenIndicator! Based on daily, weekly, and monthly high/low/open prices, it provides clear signals for informed trading decisions. Featuring the iconic "HO" from the logo, this MT5 version is ported from the original MT4 indicator by TooSlow on ForexFactory, with contributions from Dave (4xtrader2009). Disclaimer: This indicator is provided for educational purposes only. The author is not responsible for any losses in
FREE

- Displays horizontal lines for Previous Day High (PDH) and Previous Day Low (PDL) on the chart. - Customizable line colors via input parameters. - Sends sound alerts, pop-up notifications, and mobile push notifications upon the initial crossover of PDH or PDL. - Alerts are triggered only once per crossover event; they re-trigger only if the price moves away and re-crosses after a specified minimum interval. - Automatically updates the PDH/PDL levels at the start of each new day. - All indicator
FREE

FLAT ADVANCED TREND V1.5 – Identify Trends with Professional Precision
Flat Advanced Trend is your ultimate solution. It combines the power of ADX, ATR and RSI into a visually intuitive, easy‑to‑use tool designed for serious traders. Key Features: Smart Trend Detection – Filters out market noise using ADX + +DI/–DI and displays only the most reliable signals. Advanced Filters – Includes ATR for volatility and RSI for momentum (fully customizable). Real‑Time Info Panel – Shows current trend, stre
FREE

The simplest indicator. It emits a standard sound signal (an audio file from the standard MetaTrader library - alert.wav) after a period of time you select. Unfortunately I was unable to add the ability to select your file due to language restrictions. Fixed a bug: when switching TF, a complete reinitialization of the indicator occurred, and it thought that a new time interval had arrived
FREE

Free forever simple pip meter for MT5 with customizable font color. Display profit or loss in both points count and currency value. Supports 4 currency symbols ($,€,£ ,¥). For unsupported currencies, it shows a 3-character currency short form. Enhance your trading interface with clarity and precision. Easy to use and tailored for diverse Forex traders. Perfect for MT5!
FREE
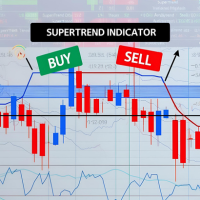
The Machine Learning Supertrend is a highly effective trading indicator specifically designed to identify and illustrate potential buy and sell signals through the use of clearly marked arrows.
One of the key advantages of this indicator is that it operates as a leading indicator, meaning it anticipates market movements rather than following them. Unlike many traditional indicators, the Machine Learning Supertrend does not lag or repaint, ensuring the signals provided are timely and reliable.
PRICE WILL BE INCREASED TO £4999 SOON!
5 or 15 MINUTE CHART ONLY: A state-of-the-art trading indicator, designed with advanced analytical and mathematical programming, delivers top-tier buy and sell signals. Simply enter a small buy position when a green arrow appears and a small sell position when a red arrow is shown. While signals from this indicator are infrequent, they boast exceptional accuracy when generated. Please apply your own stop-loss and take-profit levels as needed.

Pro Period Separators For MetaTrader 5 The built-in period separators feature doesn’t allow users to specify the time period, so you can use this indicator to create advanced period separators, you can add daily, weekly, monthly, yearly separators on any time frame. Default Inputs DAILY SEPARATOR SETTINGS show daily separators = Yes hour of the separators = 04 minute of the separators = 00 color of the separators = Silver width of the separators = 1 style of the separators = STYLE_DOT

The Auric Pulse Indicator is a powerful MetaTrader 5 (MT5) tool designed to identify trends (uptrend, downtrend, and consolidation) in financial markets. It is particularly effective for trading Gold (XAUUSD) due to its sensitivity adjustments and multi-timeframe capabilities. Indicator Overview The indicator provides: Three trend states (color-coded): Green = Uptrend (strong bullish momentum) Red = Downtrend (strong bearish momentum) Yellow = Consolidation (sideways market) Mul
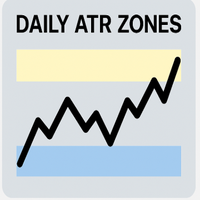
Daily ATR Zones – Precision Intraday Range Mapping Daily ATR Zones is a clear tool that plots intraday high/low targets using the Average True Range (ATR) of the previous days. These zones help traders anticipate potential price extremes , identify liquidity pockets , and define reversal or breakout levels — all based on objective volatility data. Key Features: Flat Zone Logic — Based on Open ± ATR , not bands around price
Custom Zone Thickness — Adjustable via ATR ratio ( ZoneHeightRatio )
FREE
Swap Monitor Indicator v1.0 by @marekfleisi Swap Monitor is a clean, lightweight MetaTrader 5 indicator that displays real-time swap values and open position swap data for the current symbol — directly on your chart. Whether you're a swing trader optimizing overnight holds or just want clear insight into swap costs and income, Swap Monitor gives you instant transparency on: LONG & SHORT swap values Color-coded swap profitability Open positions summary (including total swap profit/loss)
FREE

Este es un indicador que trabaja en indices BOOM 1000 y su equivalente en Weltrade Gain 1200. Basicamente trabaja en temporalidad de 15 minutos y su objetivo es cazar spikes. Se recomienda la temporalidad de 15 minutos por que genera un poco mas de precision. Se recomienda indices que general altos spikes, como el BOOM 1000. Lo interesante de cazar spikes es que se puede gestionar el riesgo. La configuracion ideal para BOOM 1000 y Gain 1200 es la que esta por defecto.

Indicador "Precision Entry Timer" - O Relógio do Timing Perfeito Este indicador revoluciona sua estratégia de trading ao identificar o momento exato para entrar em uma operação , combinando análise técnica e temporização de mercado. Ele utiliza um algoritmo avançado que cruza dados de: Volume Real (fluxo de ordens institucionais) Padrões de Candles (sequências de alta/procura com confirmação) Convergência de Médias (EMAs rápidas e lentas em alinhamento) Fuso Horário de Liquidez (períod

A utility indicator which displays account balance, equity and P&L of the current account on Chart.
Indicator parameters: Balance_Color : Change the color of the balance text Equity_Color : Change the color of the equity text Text_Size : Adjust the font size (8-20) Corner : Select which chart corner to display the text (0=top-left, 1=top-right, 2=bottom-left, 3=bottom-right) X_Offset/Y_Offset : Adjust the position from the selected corner Show_Background : Toggle the background rectangle Backg

В индикаторе реализованы трёхбарные свинги Ганна.
Задача свингов Ганна очень проста: они помогают определять тренд на рынке. Кроме того, они позволяют понять саму суть цены, отбросив все лишнее. С ними гораздо проще найти точки входа в рынок и построить ключевые уровни. Свинги прекрасно устраняют рыночный шум (особенно трёхбарные), избавляя трейдера от необходимости отвлекаться на незначительные колебания цены.

Este es un indicador hecho para indices Crash, en el broker Deriv, o indices Paint en el broker Weltrade. Su funcion es buscar velas de tendencia trend, y es recomendado verlo en temporalidad de 5 minutos o mas. Se que con las velas trend, corres el riesgo que un Spike te sorprenda, sin embargo la idea es ganar pocos pips para no arriesgar mucho. Recuerda que los Spike no respetan Stop Lost pero con una buena gestión de riesgo puede ser rentable. La idea es ganar pocos pips por entradas y este i

- Real price is 80$ - 45% Discount (It is 45$ now) Contact me for extra bonus indicator, instruction or any questions! - Lifetime update free - Non-repaint - Related product: Gann Gold EA - I just sell my products in Elif Kaya Profile, any other websites are stolen old versions, So no any new updates or support. Advantages of M1 Scalper Pro Profitability: M1 Scalper Pro is highly profitable with a strict exit strategy. Frequent Opportunities: M1 Scalper Pro takes advantage of numerous smal

Direct Scalping shows the most SUPER SUPER SUPER EARLY opportunity to scalp the market. Do entry as early as possible, as soon as the first sign appears.
It plays sound alert so that you can wait the moment while doing something else.
Remember to cut loss below the '' area. Yes, it is not stop loss but cut loss (exit on candle close). Made for M1 timeframe, but higher is good too.
My new favorite setup: M3 using 8 indicators with different parameters: 11, 18, 25, 32, 39, 46, 53, and 60.
Combin

Stats Probability (CStatsBoard) MQL5 インジケーターは、価格の変動をパーセンテージとして統計的に測定し、サブウィンドウ内にプロフェッショナルなテーブル形式でリアルタイムに表示する先進的な分析ツールです。高速な更新と抜群の精度を備えており、市場の動向を深く理解し、情報に基づいた意思決定を行いたいトレーダーにとって必須のツールです。 主な機能:
このツールは、サブウィンドウ内にスタイリッシュでプロフェッショナルなテーブル(CStatsBoard)として表示され、リアルタイムで更新されます。高速なパフォーマンスと高い精度を保証し、以下の4つの分析オプションを提供して価格のボラティリティを評価します: 最大レンジ統計 (Max Range Stats): 1か月内の最高価格と最低価格の間のパーセンテージ範囲を計算します。 始値-高値統計 (Open - High Stats): その月の始値からその月の高値までのパーセンテージ差を測定します。 始値-安値統計 (Open - Low Stats): その月の始値からその月の安値までのパーセンテージ差を測定
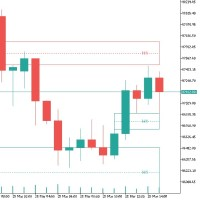
トレーディングにおけるインバランス:基礎と戦略 トレーディングにおけるインバランスとは、市場において需要と供給の間に不均衡が生じている状態を指します。これは、買い注文の過多(強気インバランス)または売り注文の過多(弱気インバランス)として現れ、非効率な価格形成につながり、トレーダーに機会を生み出します。 技術的な側面 「ローソク足パターン」 : インバランスは、多くの場合、3本のローソク足パターンで表されます。2本目のローソク足が他のローソク足よりも長く、動きの方向を決定します。 「ローソク足のヒゲ」 : インバランスの主な基準は、1本目と3本目のローソク足のヒゲが重ならないことです。 インバランスの取引方法 基本戦略 「インバランスの特定」 : 十分な取引量なしに価格が急激に変化したゾーンを探します。 「エントリーポイント」 : リミット注文を使用して、インバランスの部分的または完全な重なり後に取引を開始します。 「リスク管理」 : インバランスゾーンの外側にストップロスを置き、インバランスのサイズの1.5〜2倍で利益を確定します。 戦略の例 「インバランスの部分的または完全な埋め戻
FREE

ライブトレード&履歴ビジュアライザーは、トレーダーが保有中および決済済みポジションを明瞭な視覚的指標で追跡できるよう設計された強力なMetaTrader 5インジケーターです。ライブトレードの監視でも過去のパフォーマンス分析でも、エントリー/エグジットポイント、損益、トレード統計を直感的でカスタマイズ可能な表示でチャート上に直接提供します。
主な機能:
エントリー価格と現在価格を動的線で結んだアクティブ取引の可視化
リアルタイムでの損益の即時更新
エントリー/エグジットマーカーとトレンドライン付き過去取引の表示
取引詳細(利益、獲得/損失ポイント、ポジションサイズ)の一目で確認
取引タイプ(BUY/SELL)によるフィルタリングと表示履歴の制限
損益付き直近取引を表示するオプションのサマリー表
パフォーマンスを素早く確認できる整理されたレイアウト
スマートな更新レート制御による低CPU使用率
対象ユーザー:
デイトレーダー&スキャルパー – 保有ポジションと直近取引を迅速に評価
スイングトレーダー – パターン分析のための過去の取引履歴を確認
全戦略タイプ
FREE
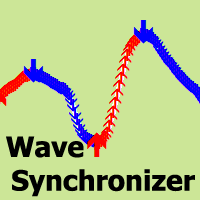
Wave Synchronizer は、波動分析の視覚的なインジケーターです。ローソク足の動きのシーケンスを組み合わせて方向性のある波を構築し、市場と同期した動きを生み出します。
各波の始まりはシグナル矢印で始まり、アラートもあります。
インジケーターは、以前の履歴の矢印を再描画したり移動したりすることはありません。
シグナル矢印は、ローソク足の終値に表示されます。
あらゆる取引商品や時間枠で動作するように適応します。
使いやすく設定も簡単で、入力パラメーターは 2 つだけです。選択したパラメーターで使用する時間枠の選択と、MA ラインの計算方法です。
推奨パラメーターは 1 ~ 2 期間シフトできます。
取引資産を購入する場合は矢印の方向が赤になります。
取引資産を売却する場合は矢印の方向が青になります。
RSI Divergence Suite Pro - MetaTrader 5 用高度な指標 概要 RSI Divergence Suite Pro は、MetaTrader 5 用の高度なテクニカル指標であり、価格と RSI の間のダイバージェンスを自動的に検出し、高精度の取引シグナルを提供します。このプロフェッショナルな指標は、RSI の強力な機能とダイバージェンス分析、マルチタイムフレームのサポート/レジスタンス、および完全なアラートシステムを組み合わせています。 主な機能 高度なダイバージェンス検出 4 種類のダイバージェンス: レギュラーブル:価格が安値を更新する一方で、RSI が高値を更新する強気シグナル レギュラーベア:価格が高値を更新する一方で、RSI が安値を更新する弱気シグナル ヒドゥンブル:強気トレンドの確認(継続) ヒドゥンベア:弱気トレンドの確認(継続) 統合された品質フィルター: 最小出来高フィルター ATR ボラティリティフィルター RSI レベルフィルター(買われすぎ/売られすぎ) バー間距離フィルター 2. 強度分類システム シグナルの自動分類: 強:
FREE
This indicator has been developed as an analytical tool based on exponential moving averages (EMA) . Its purpose is to provide additional insights into market dynamics using two exponential moving averages (EMA) and one smoothed exponential moving average (SMMA) . The indicator can be applied to different financial instruments and timeframes, depending on user preferences. Some traders use it on 30-second charts , complementing it with a 2-minute chart . How the Indicator Works The analysis is b
FREE

Pip Scope – Accurate Chart Perception for Smarter Trades The Problem:
MetaTrader automatically adjusts the vertical scale of charts to keep all candles visible. While this is helpful for keeping price action on screen, it can distort your perception of movement size. A small move may suddenly appear huge, while a large move may look minor. This can mislead traders—especially scalpers and intraday traders—into poor risk assessment, incorrect position sizing, and misplaced stop-loss levels. T
FREE
Full Functionality of the MT5
"TWR DERIV MTF BREAKOUT" INDICATOR
FOR APP SOURCE CODE: t.me/KingRennie
APP SOURCE CODE WORKS FOR MT4 AND MT5
FEE =$1500 The MT5 " TWR DERIV MTF BREAKOUT " INDICATOR is a comprehensive trading tool designed to help traders make informed decisions by utilizing Fibonacci levels, time-based analysis, and demarcating major trading sessions. This INDICATOR is ideal for both novice and experienced traders who want to enhance their trading strategies with advanced tech

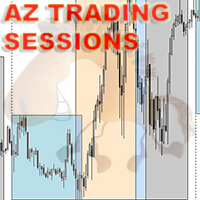
AZ_custom_daily_candle The indicator allows you to draw the contours of daily candles on small timeframes, plus you can customize the display of, for example, an H1 candle and see how it looks on the M5 chart (I think this is a useful setting for scalping). Further, it is possible to shift the beginning/end of drawing candles, change the background color, line thickness. Suggestions and wishes are welcome. v 1.05 (31/03/2025)
By demand, I have added the ability to turn on/off daily maximum/mini
FREE
Attention - the indicator was initially developed for trading futures and the nuances of the Sunday session. This modification does not take into account the Sunday premarket, but is strictly tied to the time on the chart for correct operation on the spot market. Standard ATR indicator, you can enable ignoring abnormally large candles. It is possible to change the location of the displayed text in 4 corners of the chart. You can change the calculation period (days ago). Bonus - the indicator ha
FREE

Multi Currency Multi Time Market Scan Signals Multi Currency Multi Time Market Scan Signals (MT5 Dashboard) Unlock Smarter Trading with Real-Time Market Insights Across Multiple Currencies & Timeframes! The Multi Currency Multi Time Market Scan Signals dashboard is your all-in-one solution for MetaTrader 5 , designed to simplify complex market analysis and pinpoint high-probability trading opportunities. Say goodbye to manual chart hopping – this powerful tool scans multiple symbols and timef
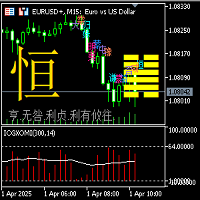
Indicator description of Yijing Guaxiang Oscillation Mean Indicator: (1) This Yijing Guaxiang change indicator is based on the Yin-Yang transformation thought of the "I Ching" philosophy in ancient Chinese culture, integrating the results of the long-short game in each candlestick K-line period of the financial trading K-line chart, using China's oldest prediction coding method, in the form of the 64 hexagrams of the I Ching, combining the Yin-Yang of each line of the hexagram with the Yin-Yang
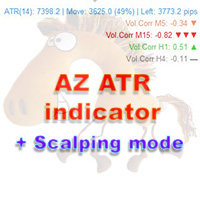
AZ ATR indicator (with volume correlation bonus)
Standard ATR indicator, you can enable ignoring abnormally large candles. It is possible to change the location of the displayed text in 4 corners of the chart. You can change the calculation period (days ago). Bonus - the indicator has a correlation with volumes. Can be enabled to display a possible priority at the current moment in the market.
What do the values mean: Positive correlation (0.3 - 1.0): 0.3-0.7 - moderate connection
FREE
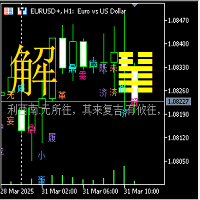
I Ching 64 Hexagram Change Indicator
1. Hexagram Indicator Description: (1) This 64 Hexagram Change Indicator is based on the Yin-Yang transformation thought of the "I Ching" philosophy in ancient Chinese culture, integrating the results of the long and short game of each candlestick K-line period of the financial trading K-line chart, using China's oldest prediction coding method, in the form of the I Ching 64 hexagrams, combining the Yin-Yang of each line of the hexagram with the Yin-Yang of
FREE

Trade Hunter MT5 - Buy and Sell Indicator
Unlock precise trading opportunities with Trade Hunter MT5! This powerful indicator identifies potential buy and sell signals by analyzing price movements over a customizable period. Blue arrows mark buy opportunities below key lows, while red arrows highlight sell signals above critical highs. With adjustable parameters like bar range, percentage offset, and alert settings, Trade Hunter adapts to your strategy. Optional alerts and notifications ensur
FREE

RTSPattern v10.50 – Elevate Your Price Action to a Data-Driven Strategy RTSPattern v10.50 is more than just an indicator — it’s a precision tool that brings pattern recognition and predictive modeling into your price action workflow. Whether you’re identifying recurring structures or validating market behavior, RTSPattern helps you move from guesswork to statistical confidence. What makes RTSPattern unique: Intuitive Pattern Selection
Simply click the first and last candle of any pattern you see

The POC_Levels indicator calculates and displays the 3 most frequently occurring price levels (Points of Control – POC) based on historical candles. It is useful for identifying areas of high market interest (like support/resistance zones) across any timeframe. How It Works
The indicator analyzes the last LookbackBars candles. It counts how many times each price level (based on the selected price type) appears. Then it selects the top 3 most frequent prices and draws horizontal lines at those l
FREE
Support Resistance Channel MT5 The Support Resistance Channel MT5 indicator plots dynamic support and resistance levels based on a configurable lookback period, displaying them as green and red lines respectively. It optionally shows goldenrod-colored arrows when price touches these levels, indicating potential trend changes (not explicit buy/sell signals) , along with customizable "RES" and "SUP" labels. With adjustable parameters like lookback period, arrow size, and label offset, it offers t
FREE

The "Price change from zero" indicator is designed to display price changes over a selected period in points.
1. The basic idea The indicator calculates the difference between the closing price on the current bar and the opening price on the bar set back by the Candle Period. The result is displayed as a line in a separate window.
2. Interpretation Positive value: The price has increased over the period.
Negative value: The price decreased during the period.
Zero value: The price has retur
FREE

Revolutionize Your Trading Journey with the Ultimate Trend Analyzer: Trending View Indicator!
Experience seamless trading precision with the Trending View, a cutting-edge solution designed to elevate your trading on MT5. Powered by advanced logic and packed with over many premium features, this tool is a game-changer for traders seeking accuracy and efficiency.
Why Choose Trending View Indicator? · 100% Real-Time Accuracy: No delays, no repaints—always stay ahead of the
RSI Power Bars – Clear and Precise Momentum Visualization Description: This indicator upgrades the classic RSI into a much more visual and powerful tool. Instead of a flat line, it displays colored bars that instantly show the direction and strength of price movement. Red = bullish momentum
Green = weakness or pullback No more guessing trend shifts or calculating momentum mentally — you see it instantly . Key Benefits: Instantly spot trend reversals Visualize market momentum with bars

Statistical Arbitrage Spread Generator for Cointegration [MT5] What is Pair Trading? Pair trading is a market-neutral strategy that looks to exploit the relative price movement between two correlated assets — instead of betting on the direction of the market. The idea? When two assets that usually move together diverge beyond a statistically significant threshold, one is likely mispriced. You sell the expensive one, buy the cheap one , and profit when they converge again. It’s a statistica
FREE
Supertrend with CCI Indicator for MQL5 – Short Description The Supertrend with CCI Indicator is a powerful trend-following tool that combines Supertrend for trend direction and CCI for momentum confirmation. This combination helps reduce false signals and improves trade accuracy. Supertrend identifies uptrends and downtrends based on volatility.
CCI Filter ensures signals align with market momentum.
Customizable Settings for ATR, CCI period, and alert options.
Alerts & Notifications via
FREE
The Periodic ATR Indicator visually compares the ATR values of each bar to the average ATR values for the same time of day over previous days. By contrasting the current ATR value with the historical average, this tool allows traders to identify exceptionally strong or weak market movements. It also helps to contextualize each market movement within the broader framework of long-term market behavior. This versatile indicator is compatible with all timeframes, including higher ones such as 4-hou
FREE
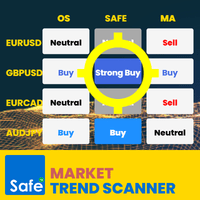
Market Trend Scanner is a trend analyzer or trend screener indicator that helps you know the trend in selected timeframe of all symbols you're watching .
This indicator provides clear & detailed analysis results on a beautiful dashboard, let you able to use this result right away without need to do any additional analysis. How it works
Step 1: Calculate values of 23 selected & trusted technical indicators (Oscillator & Moving Average indicators)
Step 2: Analyze all indicators using best prac

Receive notifications for multi-trendline or single trendline breakout. Yes! You heard us right! You will be notified the moment price crosses any and all the timeframe trendlines that you have chosen. 1. ADDING MULTIPLE OR SINGLE TRENDLINES IN THE SAME DIRECTION To trigger a stronger trading opportunity you can require that price breaks one or more trend lines of different timeframes in the same direction. To do this navigate to the timeframe for which you want to add a trendline and click

Max Min Delta Indicator - Market Volume Imbalance Analysis Gain Deeper Insights into Market Volume Imbalance with Delta Analysis What is the Max Min Delta Indicator? The Max Min Delta Indicator is a powerful market volume analysis tool that visually represents maximum and minimum delta values using a histogram. It helps traders identify market strength, weakness, absorption, and aggressive buying/selling activity with precision. Key Features Histogram Visualization: Displays Max Delta (Green) an

Full Functionality of the MT5
"TWR MTF BREAKOUT" INDICATOR
FOR APP SOURCE CODE: t.me/KingRennie
APP SOURCE CODE WORKS FOR MT4 AND MT5
FEE =$1500 The MT5 " TWR MTF BREAKOUT " INDICATOR is a comprehensive trading tool designed to help traders make informed decisions by utilizing Fibonacci levels, time-based analysis, and demarcating major trading sessions. This INDICATOR is ideal for both novice and experienced traders who want to enhance their trading strategies with advanced technical analys
MFI Divergence is a technical indicator that detects regular bullish and bearish divergences between price and the Money Flow Index (MFI) at swing highs and lows. It highlights potential reversal points by drawing clean green (bullish) and red (bearish) arrows directly on the chart. The indicator uses configurable swing detection, customizable MFI period, and an optional MFI threshold filter to show signals only in oversold/overbought zones. Alerts are triggered only once per bar on candle close
FREE

Spearman Rank MTF – Momentum Oscillator with Trend Intelligence The Spearman Rank MTF is a powerful oscillator designed to measure trend strength and direction using a statistical approach based on Spearman's Rank Correlation . This indicator excels at detecting trend changes, key reversals, and overbought/oversold conditions with precision and clear visual cues. Key Benefits Multi-Timeframe (MTF) support – analyze higher timeframes without leaving your current chart. Dual smoothing modes –

Fibo Harmonic Levels Indicator Overview The Fibo Harmonic Levels indicator is a powerful MetaTrader 5 (MT5) tool designed to automatically plot harmonic Fibonacci-based support and resistance levels on your chart. These levels and can be applied to different timeframes (Daily, Weekly, Monthly) either automatically or manually. The indicator also includes an alert system that notifies traders when price touches or crosses any harmonic level, with configurable pause intervals to prevent

ReversalRadar: Precision Trend Identification Indicator Trade With Confidence, Trade With The Trend ReversalRadar is a powerful trend identification tool designed to give traders the edge in spotting high-probability trading opportunities. By accurately identifying the current market direction, this indicator allows you to align your trading strategy with the prevailing trend, significantly increasing your potential for profitable trades. Key Features: Real-time Trend Analysis : Dynamic visual s

Indicator Statistics MultiPairs
1. Current Openning Ords
- Symbols Openning
+ Buy Orders
+ Buy Volume
+ Sell Orders
+Sell Volume
- Floating by Symbols
2. Closed Orders
- Statistics by Today, Week, Month, YTD and Volume
- Sum of Closed Orders by Symbol
3. Statistics by Day
- Statistics by Day and Volume
4. DrawDown by Day
- Each day DrawDown in Week
- Percent of DrawDown
Contact me at Telegram @MaiMew68

優れたテクニカルインジケーター「Grabber」をご紹介します。これは、すぐに使える「オールインワン」トレーディング戦略として機能します。
ひとつのコードに、市場のテクニカル分析ツール、取引シグナル(矢印)、アラート機能、プッシュ通知が強力に統合されています。 このインジケーターを購入された方には、以下の特典を無料で提供します: Grabberユーティリティ:オープンポジションを自動で管理するツール ステップバイステップのビデオマニュアル:インジケーターのインストール、設定、取引方法を解説 カスタムセットファイル:インジケーターをすばやく自動設定し、最大限の成果を出すための設定ファイル 他の戦略はもう忘れてください!Grabberだけが、あなたを新たなトレードの高みへと導いてくれるのです。 Grabber戦略の主な特徴: 推奨タイムフレーム:M5〜H4 対応通貨ペア・資産:どれでも使用可能ですが、私が実際に検証した以下を推奨します(GBPUSD、GBPCAD、GBPCHF、AUDCAD、AUDUSD、AUDSGD、AUDCHF、NZDUSD、NZDCAD、EURCAD、EURUSD、E
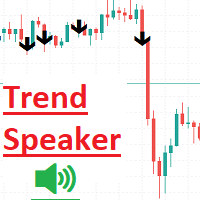
Trend Speakerインジケーター は、リアルタイムで市場のトレンドを簡単に追跡し、分析したいトレーダーのために設計された強力なツールです。チャート上で明確で信頼できる買いと売りのシグナルを提供し、市場の現在のトレンドを非常に便利に評価できます。ユーザーフレンドリーなインターフェースを備えたTrend Speakerは、潜在的な取引機会を見逃すことなく、情報に基づいた意思決定を行い、取引戦略を強化するのに役立ちます。すべてのBUYおよびSELLシグナルには、ストップロス(Stop Loss)とテイクプロフィット(Take Profit)が表示されます。 スクリーンショットでは: 緑の点は、TP1からTP7までのTake Profitを表します 赤い点は、Stop Lossを表します。 使用法: すべての時間枠で実行できます。 BUYおよびSELLの矢印の色と幅を自分で簡単に変更できます。 このインジケーターの使用は非常に簡単で便利です。リラックスして、すべてがうまくいきます。 プロパティを変更することで、TPとSLを簡単に表示または非表示にできます。
もしこのインジケーターが

MetaTrader 5 の WH Trading Sessions MT5 インジケーターを使用して、取引の精度を高めましょう。この強力なツールを使用すると、主要な市場セッションを簡単に視覚化して管理できます。 ベース オン: WH SMCインジケーターMT5
MT4 バージョン: WH トレーディングセッション MT4
主な特徴: インタラクティブ GUI パネル – アジア、ロンドン、ニューヨークの 取引セッションを簡単に選択して切り替えることができます。
カスタマイズ可能なアラートと設定 – 直感的な オプション タブ を使用して、インジケーターを戦略に合わせてカスタマイズします。
高速で応答性の高いインターフェース - 移動、最小化、最大化が可能なパネル でスムーズなエクスペリエンスをお楽しみください。
自動 GMT オフセット処理 - 手動調整は不要です。セッションは常に市場時間に合わせて調整されます。
トレーディングセッション で市場動向を先取りし、取引の決定を最適化しましょう
FREE

マルチフラクタルインジケーター – 低タイムフレームで高タイムフレームを分析する最強ツール トレード中に 1分足で上位タイムフレームの高値と安値 を確認できたら便利だと思いませんか?例えば、 1分足チャートで1時間足の高値と安値をジグザグラインとして可視化 できたり、 4時間足の市場トレンド をチャートを切り替えずに把握できるとしたら? それを実現するのがマルチフラクタルインジケーターです!
この革新的なインジケーターは、 小さな時間軸で大きな時間軸の市場構造を分析 し、より正確なトレード判断を可能にします。 このインジケーターが必要な理由 短い時間軸でトレードしていても、 上位タイムフレームの主要な高値・安値や市場の方向性 を知ることは極めて重要です。このインジケーターなら、以下のメリットがあります。 最大10種類の上位タイムフレームの高値・安値を1つのチャート上に表示
上位タイムフレームの市場方向を数値で表示(+1: 上昇、-1: 下降)
ボタン一つで各タイムフレームのフラクタルの表示・非表示を切り替え可能
各フラクタルの色とサイズを自由にカスタマイズ
FREE

大物のように取引しましょう!ITZ は、機関投資家の動きに合わせようとしているトレーダーにとって究極のツールです。
高度に最適化された戦略を活用して、セッション シグナルに活用しながら、入ってくる市場セッションと出ていく市場セッションに関する情報を常に提供します。
主な機能:
1. 複数通貨のサポート – さまざまな資産間で簡単に取引できます。
2. M1 から M30 の時間枠に最適化 – スキャルパーやデイ トレーダーに最適です。
3. 3 つの強力なシグナル戦略 – 高確率の取引向けに設計されています。
4. セッション マーカーとアラート – シドニー、東京、ロンドン、ニューヨークの市場セッション通知で先手を打つことができます。
5. カスタム サウンド アラート – 独自のオーディオ キューで通知を受け取り、取引の認識を高めます。
6. 勝率の高いシグナル – ピーク時の有効性のためにフィルタリングされています。
7. 継続的な開発と更新 – 定期的な機能強化で先手を打つことができます。
8. 最大限に活用していただくために、役立つガイドラインをまとめた
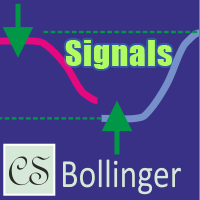
CS Bollinger – ボリンジャーバンドをベースにしたシグナルインジケーターであり、主要なサポートおよびレジスタンスの水準を迅速に特定し、視覚的なトレードシグナルを提供します。レベル切替えの改良されたロジックにより、インジケーターはチャート上で自動的にレベルを調整し、価格の反転が確認されるとシグナル矢印を表示します。これにより、トレーダーは市場へのエントリーおよびエグジットに最適なタイミングを素早く見つけることができます。柔軟な設定により個々のトレード戦略に合わせて調整可能であり、初心者から経験豊富なトレーダーまで幅広く対応しています。
パラメータ
デフォルト値
説明
BollingerPeriod
5 ボリンジャーバンドの計算期間。平均値を計算するためのバーの数を指定します。
BollingerDeviation
5 バンドの上限および下限ラインを計算するための偏差係数
CheckZeroBar
false シグナル生成時に最新バー(ゼロバー)をチェックするかどうか
ColorResistance
clrDeepPink
上から下への反転レベルを示すレ

インジケータは、売買シグナルを示しています。 任意の時間枠、任意の通貨ペア。 パラメータ: alertsMessage-メッセージウィンドウを無効にして有効にします。 alertsSound-サウンドをオフまたはオンにします。 矢印の種類-矢印アイコンを選択するためのものです。 インジケータ信号をフィルタリングする3つの簡単な方法: より古い時間枠からの表示器の読書との方向を点検しなさい。 標準のMACDチャートを使用します。 放物線インジケータを使用してください。 責任の免責事項: また、お金の管理を忘れて損失を止めるべきではありません。 レバレッジを使って外国為替やその他の金融商品を取引することは非常に危険であり、重大な損失につながる可能性があります。 市場での取引操作を行うことは、すべての人に適しているわけではありません。 質問や疑問がある場合は、すべてのリスクを認識し、独立した財務アドバイザーの助けを求める必要があります。 あなたの取引システムの補助要素として指標を使用することをお勧めします。 指標を購入することで、外国為替通貨市場に存在するすべてのリスクを理解し、受け入れます
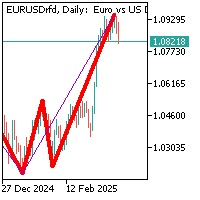
この指標には、周期が13と55の異なる2つのジグザグが形成されています。
インジケータの2つのセグメントが所定の位置に形成されて接続され、それによって特定の時間枠で価格の最小値または最大値を形成すると、インジケータは反対方向の可能性のある価格反転を通知します。 最小期間(期間13)でジグザグを形成するときに、最大期間(期間55)が同じ最小または最大のままである場合、これは前の最大または最小への修正移動が可 重要! より短い期間のジグザグインジケータの新しいアームが形成された後に位置を追加する必要があります。 それ以外の場合は、負の利益値が可能です。また、ジグザグのジュニアアームを形成した後、それは可能です 90%の信任の損失なしでこの器械の位置を再配列するため。 この方法では、価格を絞ることができます。ジグザグインジケータには重大な欠点があることに注意してください, これは、強い価格の動きで価格を書き換えることで表現されます。したがって、私は価格の動きのフィルタとして追加の他の指標を使用することをお勧めします。

Matrix Currency – Multi-Timeframe Analysis Tool The Matrix Currency is an advanced indicator designed to analyze currency strength in the Forex market. It provides efficient monitoring and strategic support for traders seeking clear and actionable insights. Key Features Multi-Timeframe Analysis : Simultaneously monitors multiple timeframes (from M1 to MN1) with real-time updates, displayed in an intuitive matrix format. Alert System : Customizable notifications via pop-up, email, and mobile devi
FREE

Trend Risk Analyzer intelligently identifies trends, impulses, and corrections, calculating optimal trade volumes and safe levels for stop-loss and take-profit. Increase your accuracy, reduce risks, and boost your trading profits! This product is also available for MetaTrader 4 => https://www.mql5.com/en/market/product/134800 The key feature of Trend Risk Analyzer is its capability to calculate the average range of each market element, enabling traders to set justified stop-loss and take-profi
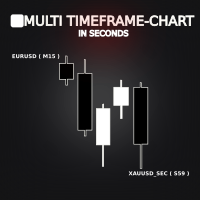
Multi Timeframe Chart in Seconds indicator allows users to visualize multiple timeframes or multiple symbols on a single chart. Instead of creating and opening a new custom chart with a different name, this indicator creates a custom chart and displays it on chart's main window, or the user can create multiple windows on the same chart using one indicator. This indicator serves the same purpose as custom charts for seconds, but the main purpose is to visualize multiple timeframes or symbols, fo
FREE
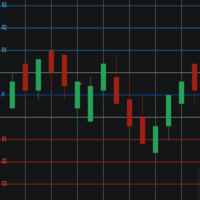
Pivot Points Levels Description The Pivot Points Levels indicator is an advanced and comprehensive tool for technical analysis based on support and resistance levels calculated from pivot points. This free indicator combines 6 different calculation methods with support for multiple timeframes, offering a robust solution for identifying key price reversal and continuation areas. Key Features 6 Calculation Methods : Traditional, Fibonacci, Woodie, Classic, DeMark (DM), and Camarilla Multi-Timefram
FREE
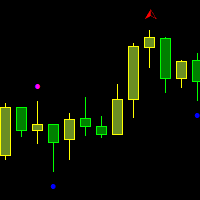
The indicator draws two types of Bill Williams' fractals: Broken fractals – the price has been at least once above or below these fractals. Unbroken fractals – new fractals where the price has not yet moved above or below them. You can configure the color of the fractals, as well as the number of bars used for the indicator's display.
фрактал Вильямса фрактал БВ фракталы Вильямса пробой фрактала пробитый фрактал Торговый хаос broken fractal unbroken fractal Williams fractal Trading Haos Bi
FREE
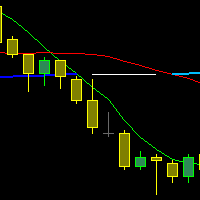
The indicator draws three Moving Averages. Two short ones cross a long one.
At the same time, the long MA changes color: If both short MAs are above the long one - first color; If both short MAs are below the long one - second color; If the two short MAs are on opposite sides of the long one - third color. All three MAs are based on closing prices with a smoothing method of "simple."
cross MA cross 3 MA cross three Moving Average across Moving cross Moving crossing MA crossing MA across MA
FREE
MetaTraderマーケットは、他に類のない自動売買ロボットやテクニカル指標の販売場所です。
MQL5.community ユーザーメモを読んで、取引シグナルのコピー、フリーランサーによるカスタムアプリの開発、支払いシステムを経由した自動支払い、MQL5Cloud Networkなど、当社がトレーダーに対して提供するユニークなサービスについて詳しくご覧ください。
取引の機会を逃しています。
- 無料取引アプリ
- 8千を超えるシグナルをコピー
- 金融ニュースで金融マーケットを探索
新規登録
ログイン