YouTubeにあるマーケットチュートリアルビデオをご覧ください
ロボットや指標を購入する
仮想ホスティングで
EAを実行
EAを実行
ロボットや指標を購入前にテストする
マーケットで収入を得る
販売のためにプロダクトをプレゼンテーションする方法
MetaTrader 5のための新しいテクニカル指標 - 43
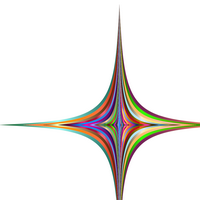
時系列を滑らかにするために、さまざまなウィンドウ機能を使用できます。ウィンドウ機能は、スムージングのレベル、ノイズ抑制などの特性が互いにかなり異なる場合があります。このインジケーターを使用すると、メインウィンドウの機能を実装し、財務時系列でのパフォーマンスを評価できます。 インジケーターパラメーター: iPeriod –インジケーター期間。 iPeriod> = 2 iCenter は、ウィンドウ関数の中心が配置される参照のインデックスです。デフォルトでは、このパラメーターは0です。ウィンドウの中心はインジケーターの中心と一致します。 1 <= iCenter <= iPeriodの場合、ウィンドウ関数の中心がシフトし、その結果、インジケーターのいくつかの特性が変化します。図1では、中心の選択がウィンドウ機能とインジケーターの表示にどのように影響するかを確認できます。このパラメータは、0.5刻みで変更できます。 一部のウィンドウ関数は、追加のパラメーター(ParameterAおよびParameterB)を使用します。それらはウィンドウの重みに影響します。このため、インジケーターの

Daily session open lines shows the traders three important trading session opens. By default it is set up to show you: Zero GMT Open Line London Open Session Line New York Open Session Line The default times are set according to GMT+2 and as such you are able to change and customise according to your specific time zone. The Indicator is usefull specially for the trader who trades the London and NewYork sessions.
FREE

The SMTrendLine indicator is based on the principles of graphical construction of Bollinger bands.
Graphically, the Bollinger is two lines that limit the price dynamics from above and from below, respectively. These are a kind of support and resistance lines, which most of the time are located at levels far from the price.
As we know, the Bollinger bands are similar to the envelopes of moving averages. The difference between them is that the envelope boundaries are located above and below t
FREE

This indicator was created based on posts from forex factory thread titled There is no Magic Moving Average - You need only one - by @andose2 a.k.a Andrei Florin. If you want to know about how to use this trading strategy please go and read https://www.forexfactory.com/thread/691864-there-is-no-magic-moving-average-you.
Note: Below are extracts some of the posts .
Estabilish a trend, based on Market Cycles, then go only long in the Markup Phase and only short in the Decline phase ,
FREE

GannRS Trend Scalper GannRS is an advanced trading tool based on Gann Law and Supports and Resistances. designed to have an active trading at any time not lagging Indications are given at the beginning of a new candle
Please watch the full tutorial video.
How to use GannRS Very easy to set up... Put it on your chart Adjust inputs
Inputs Show Resistance and support : [bool] true = Shows R/S on chart false = does not show Show Levels :[bool] true = Shows levels on the chart false = doe

The Monthly Weekly Open Line is an indicator that plots: The current month open line that will extend till the last week on the month. Weekly lines that span the look back days period that you have set . Each line will extend from the respective weekly Monday zero GMT till friday of the respective week. Monthly and Weekly open lines can be used to build very powerfull anc consistent trading strategies. They act as natural S/R price barriers.
FREE

True Days is a tool designed specifically for the trader who wants to catch intraday volatility in price charts. True day makes it easier for the trader to avoid trading in the dead zone - a period in time where markets are considered dead or non volatile. The trader can concentrate on finding opportunities only during periods of profound market movements. By default the indicator gives you a true day starting at 02:00 to 19:00 hours GMT+2. You can adjust according to your Time Zone. By deafult
FREE

High of the Day and Low of the day Time and Price Fractal Studies is an indicator that will help you identify certain patterns that tend to repeat themseleves at certail times of the day or at certain prices.
It is used to study Daily Highs ad Lows in relation to time and price.
You will get to answer certail questions like:
At what time of day does this market usually turn around. At what price does the market turn. Is it at round numbers etc
FREE

The daily custom period seperator indicator allows you to draw period seperators for your lower time frame charts H1 and below. The period seperator gives you options to set different colors for: Weekend - saturday/sunday Monday and Friday Midweek - Tuesday to Thursday.
By default the indicator plots the period seperator line at 00:00 hours for the last 10 days.
Use Cases: The indicator can be used as a colourful alternative period seperator to the default MT5 period seperator. For those t
FREE

A indicator to show saturation in buying or selling With fast and complex mathematical calculations Easily find saturation points for buying or selling Can be used in all symbols and time frames with many signals Can be combined with different indicators and different time frames With simple settings and simple working methods
Features: Can be used on all symbols Can be used in all time frames Can be used in all markets (Forex, stock, etc.) Large number of signals Same performance on all t

The order block locator is powered by three main search algorithms thar can be used to find order blocks. Simple Fractal Search Algorithm Naive Fractal Movers Algorithm
Candle Transition Algorithm You can even combine the power of your 2 favourite algorithms and get the best of both worlds: Mixed Algorithm (Naive Fractal + Candle transition) Mixed Algorithm (Simple Fractal + Candle Transition
Simple Fractal Search Algorithm
The algorithm finds the fractals based on your setting paramers fo

Time and Price Fractal Studies is an indicator that will help you identify certain patterns that tend to repeat themseleves at certail times of the day or at certain prices. It is used to study Fractal Highs ad Lows in relation to time and price. You will get to answer certail questions like: At what time of day does this market usually turn around. At what price does the market turn. Is it at round numbers etc.
FREE

MT4 indicator version https://www.mql5.com/en/market/product/72342 MT5 EA https://www.mql5.com/en/market/product/82583
I personally use this indicator to scalp. Accurate for accessing extremes and supports for buy positions primarily for 1 minute time frames. Other time frames can be used but the levels are different. Its a better oscillator and compare with others to see the difference. Day trade using neuro network concepts. This indicator uses elementary forms of neuro network
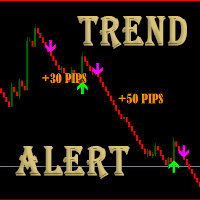
Characteristics of Trend Alert Platform: Metatrader4 Currency pairs: Any (recommended major) Trading Time: Any Timeframe: M5 or higher In-built Alert System Trend Alert is easy to use.
ITS FREE, GIVE ME A GOOD RATING!
Trend Alert indicator can be added to the existing trading systems , or used in combination with other indicators , filters its signals.
Send me a mail for further details.
FREE

Hi there! Since I am starting commercial and non-commercial product publishing I would highly appreciate: If you like this product, please rate it. That will help to promote not only this product, but indirectly another ones. So, such promotion will help to make some money from commercial products. Thus, I will have opportunity to fund my another directions of trading researches like bot development using mql4 and mql5 programming languages as well as python written products like crypto bots. If
FREE
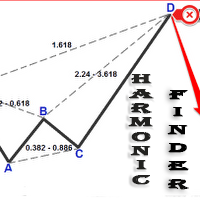
Automatically finding harmonic patterns has been made easy for traders. For those who do not know harmonic patterns : it is a method of technical analysis based on Fibonacci ratios in the markets and patterns made of these. Kind of like patterns such as triangles and double tops, but with precise measurements which makes computerized measuring tools especially appealing for trading these patterns. Some highlights from this Indicator include: Efforts to reduce the amount of screen clutter thro

Hi there! Since I am starting commercial and non-commercial product publishing I would highly appreciate: If you like this product, please rate it. That will help to promote not only this product, but indirectly another ones. So, such promotion will help to make some money from commercial products. Thus, I will have opportunity to fund my another directions of trading researches like bot development using mql4 and mql5 programming languages as well as python written products like crypto bots. If
High Probability Reversal Arrow Indicator The indicator looks for trend exhaustion areas, and plots Buy/Sell arrow after on confirmation of trend exhaustion. Signals can also be shown as popup alerts, or be sent as e-mail or mobile phone notification. Trades can be taken on breakout of the signal candle. Inputs
Signal Type: Aggressive/Normal History Bars : Can be set to 0 (zero) to show all historical signals, or can be set to a limited number of bars for faster execution. Show Alert : True/F
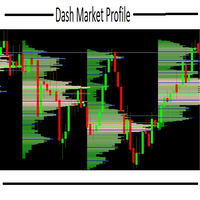
this indicator is essential when it's necessary to identify trade locations on chart. You can initially get an idea of the candlestick's direction with other graphical tools and then identify the best regions with the DMP. The Dash Market Profile is a statistical indicator, that mean it is an indicator that is based on mathematical calculations, identifying the best regions and observing the candles of the best regions to trade. The financial market is not as easy as it seems, it is necessar
100 % PER MONTH PROFIT---- MY NEW SIGNAL HERE -------> https://www.mql5.com/en/signals/2162238?source=Site+Signals+My#
What Is the Average True Range (ATR)? The average true range (ATR) is a technical analysis indicator, introduced by market technician J. Welles Wilder Jr. in his book New Concepts in Technical Trading Systems, that measures market volatility by decomposing the entire range of an asset price for that period. The true range indicator is taken as the greatest of the fol
The Spike King Indicator is, as the name suggests, a forex trading tool that recognizes spikes in the market. This is a perfect indicator for reversal traders. A spike often indicates a turn-around moment. The best way to use that gauge is to apply it to your favourite trading system as a filter. ONGOING PROMO!!! The indicator is displayed in a separate window placed just below the main trading chart, as well as a confirmation arrow with shows us in the chart fr every new signal. HAS AN INBUILT

Size Bars – индикатор отображает на графике максимальный, минимальный, текущий и средний размер баров (свечей) за выбранный период.
Отображаемые параметры индикатора Size Bars: 1) Текущий размер бара в писах (по максимум/минимум, тело бара). 2) Максимальный, минимальный и средний размер свечей BUY . 3) Максимальный, минимальный, средний размер свечей SELL . 4) Количество свечей BUY и количество свечей SELL . 5) Среднее количество свечей подряд BUY и SELL . 6)

このプロジェクトが好きなら、5つ星レビューを残してください。 インスタグラムでフォロー:borelatech このインジケータは、指定されたためのオープン、ハイ、ロー、クローズ価格を描画します
特定のタイムゾーンの期間と調整が可能です。 これらは、多くの機関や専門家によって見られた重要なレベルです
トレーダーは、彼らがより多くのかもしれない場所を知るために有用であり、
アクティブ。 利用可能な期間は次のとおりです。 前の日。 前週。 前の月。 前の四半期。 前年。 または: 現在の日。 現在の週。 現在の月。 現在の四半期。 現年。
FREE

このインジケーターはフラクタルの価格構造を分析し、市場ダイナミクスで起こり得る反転ポイントを決定します。 フラクタルはサポートレベルとレジスタンスレベルとして使用できます
利点:
すべてのインストゥルメントとタイムシリーズで動作します。 結果を再描画しません。 カスタマイズ可能なインジケーター要素の色、 あらゆるトレンド戦略と完璧に調和します。 フラクタルの強さを調整します。
MT4バージョンインジケーター -> ここ / AW フラクタル EA MT5 -> ここ
戦略:
フラクタルは、中央に頂点を持つくさびの形をした幾何学的図形を形成するキャンドルの組み合わせです。つまり、平均価格がピークであり、ピークの前の後続および前の価格がピークのローソク足より下または上に位置する場合です。これらのマークはサポートレベルとレジスタンスレベルとして使用できます。 AW Flexible Fractals は、フラクタルの構造により、シグナルを即座に表示するのではなく、遅延を伴って表示する
FREE

Real Trend Zigzag PRO shows the real trend of a market, u nlike the default Zigzag indicator. It calculates the trend in real time and shows green lines for upwards trends, red lines for downward trends and blue lines for no trends. Regarding the old slogan "the trend is your friend" it helps you to decide if should open a buy or sell position. The PRO version is a multi timeframe zigzag (MTF). Means, it shows the trend of the current timeframe as well as the trend of a higher or lower time.

This indicator shows a candle combination based on dodge, dodge and pin bar. The logic of the pattern is to stand on the side of strength, after uncertainty. The indicator is universal and is useful for trading binary options, forex, ETFs, cryptocurrency, stocks. The indicator supports timeframes from M5 to MN, including non-standard TF presented in MT5. (М5,М6,М10,M12, M15, M20, M30, H1, H2, H3, H4, H6, H8, H12, D1, W1, MN). The ability to enable and disable TF is implemented. Sound alerts and

This Advanced Pivots Point is a MT5 Indicator and the essence of this technical indicator is to transform the accumulated history data. Pivot Point Indicator provides for an opportunity to detect various peculiarities and patterns in price dynamics which are invisible to the naked eye. Pivot Points Fibonacci retracements Previous day’s open, high, low, and close.
FREE
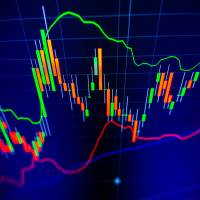
The indicator calculates reversal points based on the past trend and forms a channel (outer) on this basis. This elapsed time span from which the reversal points are determined can be specified in the settings.
An inner channel is also drawn in white. The trend continues in this channel, if there is a sideways trend. Here the upper / lower line form the possible turning point.
The indicator is suitable for all trading areas, whether forex, crypto, metals, indices or futures. All areas trade

Triple Exponential Moving Average (TRIX) It is a strong technical analysis tool. It can help investors determine price momentum and identify oversold and overbought signals in a financial asset.
Advantages of having an indicator like TRIX.
One of the main advantages of TRIX over other trend-following indicators is its excellent filtering of market noise and its tendency to be an early rather than late indicator.
To aid in the operations, a coloring was configured to facilitate the identif
FREE
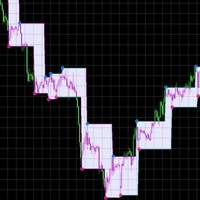
The ZigZag indicator, which has already become common and familiar to any trader, has acquired new forms and received additional reinforcement by including the results of Parabolic SAR analysis in its team. The tandem of these two indicators shows excellent accuracy in determining the direction of the trend and timely receiving a signal about its reversal. The main signals on the chart are red and blue markers (if desired, the colors can be changed). Blue marker - we start selling, red-purchases

Description:
The Wall of Worry indicator allows you to assess market sentiment and possible reversals. The indicator represents three lines that are displayed in a separate window.
Black line (trend) - the amount of volumes in the candle body.
Red line (bears) - the amount of volumes in the upper shadow of the candlestick.
Blue line (bulls) - the amount of volumes in the lower shadow of the candle.
The idea is based on "Wall of Worry" - this is the periodic tendency of financial marke
An indicator of patterns #52 and #53 ("Falling/rising wedges") from Encyclopedia of Chart Patterns by Thomas N. Bulkowski.
Parameters: Alerts - show alert when an arrow appears Push - send a push notification when an arrow appears (requires configuration in the terminal) PeriodBars - indicator period K - an additional parameter that influences the accuracy of pattern shape recognition ArrowType - a symbol from 1 to 17 ArrowVShift - vertical shift of arrows in pixels ShowLevels - show lines

Trade Sentiment or trade assistant is a MT5 Indicatior. That show buy or sell signal of different indicator to assist to take trades. That will help you to take right trades or to get confirmation for your trade. You don't need to have this indicators. Including indicators like RSI , STOCH , CCI. And the signals are Based on different Timeframes like 5M , 15H , 1H and 4H.
FREE

Fully featured Pivots and Levels indicator Pivots: Floor (normal), Woody, Camarilla, Fibonacci Levels: ATR, Historical Volatility with standard deviations, Close Price Volatility with standard deviations
Features: - 4 +/- levels
- MTF, pivots/levels based on Daily, Weekly, 4hr or even 15min - Hour and minute time offset
- Texts with prices and pip distances to central pivot/level - Inputs for Camarilla/Fibonacci/ATR/Volatility levels
- Alerts, popup, push, email, sound, live or completed ca

Real Trend Zigzag shows the real trend of a market, u nlike the default Zigzag indicator. It calculates the trend in real time and shows green lines for upwards trends, red lines for downward trends and blue lines for no trends. Regarding the old slogan "the trend is your friend" it helps you to decide if should open a buy or sell position. If you are looking for a multi timeframe zigzag, take a look at the PRO version: https://www.mql5.com/en/market/product/72071 MT4 version can be found her

A very useful indicator to show you the previous day High and Low level as a channel on any time frame. This is an essential tool that helps you identify the current market position and trend. Every trader should have this in his toolbox, as sometimes when working on smaller time frames we forget about what happened yesterday :) and therefore we get distracted by false movements of the market.
I hope you enjoy my products and for the Demo version before leaving a negative review (if the need a

ADX indicator is used to determine the trend and its strength. The direction of the price is shown by the +DI and -DI values, and the ADX value shows the strength of the trend. If +DI is above -DI, then the market is in an uptrend, if on the contrary, it is a downtrend. If ADX is below 20, then there is no definite direction. As soon as the indicator breaks this level, a medium-strength trend begins. Values above 40 indicate a strong trend (a downtrend or an uptrend).
Multicurrency and multit

***** This is an indicator for MT5 providing accurate arrow signals without repainting. ***** Trade With Sam Simple Strategy Guide : https://www.mql5.com/en/blogs/post/740855
MT4 version of the indicator
Try Out and see the Difference
The Sam's Trend Blaster indicator tracks the market trend with an unmatched reliability, by ignoring sudden fluctuations and market noise. It has been designed to trend-trade intraday charts and small timeframes. Its winning ratio is around 85%. This is a

Supply and Demand indicator does not repaint as it counts the number of tests/retests occurred in the past x number of times. As a trader you need a path to be able to place your buy and sell trades such as: Supply and Demand, Falling & raising channels . Experienced trades will draw the key levels and channels around the timeframes. But, they will not be able to draw them on the small time frames as the price changes too frequent. This indicator is based on Shved supply and demand indicator, b
FREE

Channels indicator does not repaint as its based on projecting the falling and raising channels. As a trader you need a path to be able to place your buy and sell trades such as: Supply and Demand , Falling & raising channels. Falling and raising channels can be in any time frame and also can be in all time frames at the same time and the price always flows within these channels. Experienced trades will draw the key levels and channels around the time frames. But, they will not be able to draw
FREE

The indicator draws levels based on the overbought and oversold values of the RSI indicator.
The maximum values are taken into account, which are equal to or exceeded certain limits. That is, for example, when the price has gone into the overbought zone, the highest price is selected from all prices in this zone for this period of time, and as soon as the indicator value returns to a value below the overbought value, the level is fixed and the calculation of new values begins.
The sam
FREE

This is an original, agile, and excellent trending system. Whether you are a beginner trading novice or a professional trader, this set of indicators can help you quickly and timely track the latest changes in market trends. It has the following characteristics: The method of use is extremely simple, plug and play, and the display of all trend analysis results is clear at a glance; There is no need to configure any functional parameters, the trend tracking indicator will automatically analyze th
Binary Options Assistant (BOA) BLAZE Signals Indicator provides signals based on Christian’s at BLW Online Trading Binary Options Strategy. Indicators: 3 Moving Averages
Stop missing trades, stop jumping from chart to chart looking for trade set-ups and get all the signals on 1 chart! U se any of the BOA Signals Indicator with the Binary Options Assistant (BOA) Multi Currency Dashboard . All BOA Signal Indicator settings are adjustable to give you more strategy combinations. The signals c

Binary Options Assistant (BOA) BURN Signals Indicator provides signals based on Ana Trader Binary Options Strategy. Indicators: MACD & Stochastic
Stop missing trades, stop jumping from chart to chart looking for trade set-ups and get all the signals on 1 chart! U se any of the BOA Signals Indicator with the Binary Options Assistant (BOA) Multi Currency Dashboard . All BOA Signal Indicator settings are adjustable to give you more strategy combinations. The signals can be seen visually and hea
Binary Options Assistant (BOA) COLD Signals Indicator provides signals based on Amalia Trader Binary Options Strategy. Indicators: Keltner & Stochastic
Stop missing trades, stop jumping from chart to chart looking for trade set-ups and get all the signals on 1 chart! U se any of the BOA Signals Indicator with the Binary Options Assistant (BOA) Multi Currency Dashboard . All BOA Signal Indicator settings are adjustable to give you more strategy combinations. The signals can be seen visually
Binary Options Assistant (BOA) LAVA Signals Indicator provides signals based on Lady Trader Binary Options Strategy (Bollinger Band & Stochastic). Indicators: Bollinger Bands & Stochastic
Stop missing trades, stop jumping from chart to chart looking for trade set-ups and get all the signals on 1 chart! U se any of the BOA Signals Indicator with the Binary Options Assistant (BOA) Multi Currency Dashboard . All BOA Signal Indicator settings are adjustable to give you more strategy combinatio
Binary Options Assistant (BOA) CHILL Signals Indicator provides signals based on Katie Tutorials Binary Options Strategy. Indicators: 3 Moving Averages & RSI
Stop missing trades, stop jumping from chart to chart looking for trade set-ups and get all the signals on 1 chart! U se any of the BOA Signals Indicator with the Binary Options Assistant (BOA) Multi Currency Dashboard . All BOA Signal Indicator settings are adjustable to give you more strategy combinations. The signals can be seen vi
Binary Options Assistant (BOA) ICE Signals Indicator provides signals based on gkNextLevel Binary Options Strategy. Indicators: 2 Bollinger Bands & Stochastic
Stop missing trades, stop jumping from chart to chart looking for trade set-ups and get all the signals on 1 chart! U se any of the BOA Signals Indicator with the Binary Options Assistant (BOA) Multi Currency Dashboard . All BOA Signal Indicator settings are adjustable to give you more strategy combinations. The signals can be seen v

An indicator of patterns #24 and #26 ("Head and Shoulders") from Encyclopedia of Chart Patterns by Thomas N. Bulkowski. Parameters: Alerts - show alert when an arrow appears Push - send a push notification when an arrow appears (requires configuration in the terminal) PeriodBars - indicator period K - an additional parameter that influences the accuracy of pattern shape recognition ArrowType - a symbol from 1 to 17 ArrowVShift - vertical shift of arrows in pixels ShowLevels - show levels Col

An indicator of pattern #30 ("Island Reversal") from Encyclopedia of Chart Patterns by Thomas N. Bulkowski (two gaps, the second gap is in the direction of the first one). Parameters: Alerts - show alert when an arrow appears Push - send a push notification when an arrow appears (requires configuration in the terminal) GapSize - minimum gap size in points ArrowType - a symbol from 1 to 17 ArrowVShift - vertical shift of arrows in pixels ShowLevels - show levels ColUp - color of an upward line
Gap indicator (pattern #23) from Encyclopedia of Chart Patterns by Thomas N. Bulkowski.
Parameters: Alerts - show alert when an arrow appears Push - send a push notification when an arrow appears (requires configuration in the terminal) GapSize - minimum gap size in points ArrowType - a symbol from 1 to 17 ArrowVShift - vertical shift of arrows in pixels Auto5Digits - automatic multiplication of GapSize by 10 when working with 5 and 3 digit quotes. Note. Arrows appear at the opening of a

An indicator of patterns #21, #22, #23 ("Flag") from Encyclopedia of Chart Patterns by Thomas N. Bulkowski. Parameters: Alerts - show alert when an arrow appears Push - send a push notification when an arrow appears (requires configuration in the terminal) PeriodBars - period in bars K - an additional parameter that influences the accuracy of pattern shape recognition. The influence of the parameter will be visible if not all of the pattern variants are enabled (not all three parameters Expandin

Moving Average Crossover with Alert is a indicator that can show buy and sell arrow types of alerts supported by the platform based on the crossover of two moving averages according to the parameters given by the trader. You can change inputs by yourself. This indicator only show the arrows to buy or sell to execute the trade you have to do it by yourself. For more information see the screenshot.
FREE
This is the Stargogs Volatility Arrow V1 Yeahhh!!! This Arrow is based on trend, support and demand and based on EMA's. You can change the parameters or settings like you want to. Message Me for the System which works best with this Indicator for free (include: Template, and other indicators). This indicator works with all Currency Pairs, All Volatility indices, All Indices, Boom & Crash Indices, Gold and NASDAQ. Works on All Timeframes Add the following to your chart with Stargogs Volatility A

A flexible 2-Line MACD indicator The default MACD indicator inside MT4, limits you to using the MACD with a fast-EMA, slow-EMA. This MACD indicator allows you to set your own MA-Method choices for these 2 components, separately! You can select from SMA, EMA, SMMA, LWMA, ADAPTIVE MA, FRACTAL MA, DEMA, TEMA, VARIABLE INDEX DYNAMIC MA, and can even use a separate method for each 2 fast-slow. The signal line has options from SMA-EMA-SMMA-LWMA. On-chart colored candles, with drawing condition types i

Binary Options Assistant (BOA) Multi Currency Dashboard for Binary Options (MT5) .
You can use any of the BOA Signals Indicators with the dashboard. Just change the BOA Signals Indicator Name in the dashboard settings to the indicator you want to get signals from. For example: CHILL. BLAZE: BOA_BLAZE_Indicator_v1 Strategy : BLW Online Trading Binary Options Strategy (3 Moving Average)
LAVA: BOA_LAVA_Indicator_v1 Strategy: Lady Trader Binary Options Strategy (Bollinger Bands & Stoc

Binary Options Assistant (BOA) BOIL Signals Indicator provides signals based on Ana Trader Binary Options Strategy. Indicators: Stochastic
Stop missing trades, stop jumping from chart to chart looking for trade set-ups and get all the signals on 1 chart! U se any of the BOA Signals Indicator with the Binary Options Assistant (BOA) Multi Currency Dashboard . All BOA Signal Indicator settings are adjustable to give you more strategy combinations. The signals can be seen visually and heard au
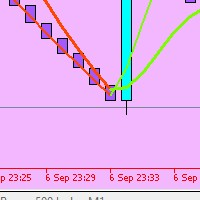
The marik_moving average signal indicator for the MetaTrader 5 trading terminal is built on the interaction of the fast and slow moving Hull.
The moving average is known for the fact that the lag of the indicator, characteristic of moving averages, is minimized in it. The marik_moving average signal indicator for MT5 at the intersection of the "Fast" and "Slow" lines displays a signal that is regarded as a likely price reversal.

This indicator uses Fibonacci to determine your trading levels precisely and measurably. It helps you to earn big profits. This indicator can also be used for various currency charts. You can also combine it with other indicators that you like so that the profits you get are also even greater. I hope you give me input so that this indicator can be better. We recommend using for the period M1 to M15. feel free to discuss with me. Thanks.

- This Indicator will automatically plot 13 support/resistance reference lines base on Fibonacci level calculation for timeframe M30 and above. - Not available for charts with timeframe lower than M30 due to noisier (high fluctuation) nature.
- The reference lines are plotted from a maximum and minimum levels derived automatically from a custom algorithm. - The 13 reference lines are at 123.6%, 111.8%, 100%, 88.2%, 76.4%, 61.8%, 50%, 38.2%, 23.6%, 11.8%, 0%, -11.8% & -23.6%. - It will also plot
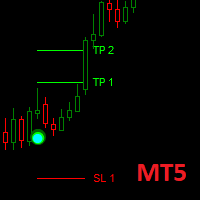
Dark Point is an Indicator for intraday trading. This Indicator is based on Trend Following strategy, also adopting the use of the atr to determine the right volatility. We can enter in good price with this Indicator, in order to follow the strong trend on the current instrument. If you love Dark Point, consider adding some power: Dark Power
Key benefits
Easily visible take profit/stop loss lines Intuitive directional points/arrows by colors Useful statistics , which indicate the
FREE

A fully featured BB indicator You're no longer limited to the built in default of using BB off a SMA method, now you can choose from: SMA - SMMA - EMA - LWMA - ADAPTIVE - FRACTAL ADAPTIVE - DEMA - TEMA - VARIABLE INDEX DYNAMIC
You now also have up to 5 standard deviation levels, with price labels. Styling wise, there are color gradients provided for deviation filling, candles (bars too), deviation lines and texts.
Options: - MTF - 9 choices of MA to base the BB off
- 5 adjustable deviation

Fractal 358 Plus is a predictive indicator that provides the clearest sight of price movements. Identifying graphic patterns such as Caixote (Crate), Pivot and Inside Candle , it shows entries and exits spots, as well as threats to your trades in the markets. It comes ready to use with B3 Mini Index (WIN$ series) and can be adjusted to use with any asset and timeframe. Fractal 358 unravels price movement
Based on the Fibonacci sequence, Fractal 358 is a new and different way of reading and un

1. What is it The classic Bollinger Bands and the Bollinger Bands indicator built into the system, they have the same mean period and deviation period. And the method of average is just the simple moving average method. The deviation method used is just the standard deviation method. All this limits our research because: Sometimes we would like to have longer period averages + shorter period deviations. Sometimes we want moving averages that are not limited to simple moving averages but als
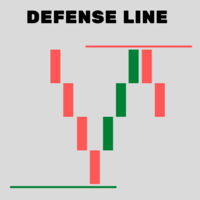
Indicator that determines very accurately "future" where BUYERS and SELLERS will defend their positions.
DOES NOT use moving averages, Fibonacci or any other underlying indicators.
SIMPLE AND EFFICIENT !!
In these defense regions "DEFENSE LINE" is the best region for decision making to buy / sell.
1- Place the indicator on the chart
2 - Move the Vertical lines to the period to be analyzed
3 - The Defense Line will be drawn automatically
4 - To erase the Defense Line, press the

It so happened that it is no longer necessary to write about the principles of operation of indicators of this type. The presented indicator redraws the trend direction until it changes to the opposite. whether this is right or not is up to you to judge. It works well together with SM trend Cloud, which is implemented in the SMak ZigZag EA and Pyramid EA Expert Advisor code. When these two indicators work together, it is possible to determine the further trend movement with a high degree of pr
FREE

In the SM Trend Cloud indicator, two buffers are used for calculation and rendering. One of the main advantages of this tool is its simplicity, while its signals can be quite accurate. But, again, we have a trend indicator in front of us, and therefore it will generate false signals mainly in conditions of consolidation. At the same time, I do not advise using the indicator in its own form, there is no way to do without additional filters. As an additional signal, I suggest using ZigZag indicat
FREE

The Retracement Feeder checks for retracement opportunities after the first move has occurred. Basically it scans for the second wave of trend. Works with any financial instrument, It does not repaint/change color or cancel arrows, Easy to set and use. Works great with Renko Charts
MT4 version: https://www.mql5.com/en/market/product/67443 How it works The indicator is based on RSI and Stochastics. The algorithm used in the Retracement Feeder allows the Stochastic and RSI to minimize the t

Moving Average Colored
A very simple indicator, but one that cannot be missed when carrying out your operations. Considered one of the oldest and indispensable indicators to have on your chart now with coloring to make your operations even easier. Configuration Parameters: Time course Averaging Method
Come and see our mql5 signals too https://www.mql5.com/pt/signals/914535?
FREE
An indicator of patterns #28 and #29 ("Horn bottoms" and "Horn tops") from Encyclopedia of Chart Patterns by Thomas N. Bulkowski. Parameters: Alerts - show alert when an arrow appears Push - send a push notification when an arrow appears (requires configuration in the terminal) BarsInsideFrom - minimum number of bars between the tops BarsInsideAdd - the number of bars between the tops can be in the range from BarsInsideFrom to BarsInsideFrom+BarsInsideAdd-1. If the value is -1, the number of b
MetaTraderマーケットは、履歴データを使ったテストと最適化のための無料のデモ自動売買ロボットをダウンロードできる唯一のストアです。
アプリ概要と他のカスタマーからのレビューをご覧になり、ターミナルにダウンロードし、購入する前に自動売買ロボットをテストしてください。完全に無料でアプリをテストできるのはMetaTraderマーケットだけです。
取引の機会を逃しています。
- 無料取引アプリ
- 8千を超えるシグナルをコピー
- 金融ニュースで金融マーケットを探索
新規登録
ログイン